Dissertation on
A CLINICAL STUDY OF VITAMIN D
SUPPLEMENTATION IN DIABETIC RETINOPATHY
PATIENTS WITH TYPE 2 DIABETES MELLITUS
Submitted in partial fulfillment of requirements of
M.S. OPHTHALMOLOGY
BRANCH - III
REGIONAL INSTITUTE OF OPHTHALMOLOGY
MADRAS MEDICAL COLLEGE
CHENNAI- 600 003
THE TAMILNADU
DR.M.G.R. MEDICAL UNIVERSITY
CHENNAI
CERTIFICATE
This is to certify that this dissertation titled “A CLINICAL STUDY OF VITAMIN D SUPPLEMENTATION IN DIABETIC RETINOPATHY PATIENTS WITH TYPE 2 DIABETES MELLITUS” is bonafide record of the research work done by DR. JAIN LUBHANI SUDARSHAN, Post graduate in the Regional Institute of Ophthalmology & Government Ophthalmic Hospital, Madras Medical College and Government General Hospital, Chennai-03, in partial fulfillment of the regulations laid down by the Tamil Nadu Dr. M.G.R Medical University for the award of M.S. Ophthalmology Branch III, under my guidance and supervision during the academic year 2012 – 2015.
PROF. DR. P. S. MAHESWARI. M.S., D.O.,
CHIEF, VITREORETINA SERVICES, Regional Institute of Ophthalmology & Government Ophthalmic Hospital, Madras Medical College,
Chennai-600 008.
PROF.DR.K.NAMITHA BHUVANESWARI M.S., D.O.,
DIRECTOR AND SUPERINTENDENT, Regional Institute of Ophthalmology & Government Ophthalmic Hospital, Madras Medical College,
Chennai-600 008.
PROF.DR.R.VIMALA.M.D.,
DEAN
Madras Medical College & Government General Hospital,
ACKNOWLEDGEMENT
I express my sincere thanks and gratitude to PROF. DR. R. VIMALA, M.D., Dean, Madras Medical College and Government General Hospital, Chennai for permitting me to conduct this study at the Regional Institute of Ophthalmology and Government Ophthalmic Hospital, Chennai.
I have great pleasure in thanking PROF. DR. K. NAMITHA BHUVANESWARI M.S., D.O., Director and Superintendent, Regional Institute of Ophthalmology and Government Ophthalmic Hospital, Madras Medical College, for her valuable advice in preparing this dissertation.
I express my profound gratitude to PROF. DR. P.S. MAHESWARI M.S., D.O., my unit chief and my guide for her valuable guidance and constant support at every stage throughout the period of this study.
I am very grateful to my Co-guides, my unit chief, PROF. DR. B. CHANDRASEKARAN, M.S. D.O., and my unit assistant professor, DR. M. PERIYANAYAGI, M.S., for rendering their valuable advice and guidance for this study.
I am extremely thankful to my unit assistant professors, DR. M. SIVAKAMI. M. S. and DR. A. ANURADHA, M.S., for their valuable suggestions and guidance during the course of this study.
I wish to express my sincere thanks to all the professors, assistant professors and all my colleagues who had helped me in bringing out this study.
Submission author: Assignment title:
Submission title: File name:
File size: Page count:
Word count: Character count:
Submission date: Submission ID:
Digital Receipt
This receipt acknowledges that Turnitin received your paper. Below you will find the receipt information
regarding your submission.
The first page of your submissions is displayed below.
Jain Lubhani Sudarshan 221213004… TNMGRMU EXAMINATIONS
A clinical study of Vitamin D supplem… Retinopathy_patients_with_type_2_D… 229.13K
109 13,682 75,333
24-Sep-2014 11:02PM 455510385
DECLARATION BY THE CANDIDATE
I hereby declare that this dissertation entitled “A CLINICAL STUDY OF VITAMIN D SUPPLEMENTATION IN DIABETIC RETINOPATHY
PATIENTS WITH TYPE 2 DIABETES MELLITUS” is a bonafide and
genuine research work carried out by me under the guidance of
PROF. DR. P.S. MAHESWARI., M.S. D.O.
DATE:
CONTENTS
S.NO. TITLE PAGE NO.
PART I
1. INTRODUCTION 1
2. REVIEW OF THE LITERATURE 5
A. HISTORY 7
B. ANATOMY 8
C. EPIDEMIOLOGY 13
D. CLASSIFICATION 23
E. PATHOGENESIS 27
F. CLINICAL FEATURES 33
G. CLINICAL EVALUATION 39
H. MANAGEMENT 42
I. SCREENING SCHEDULE 50
J. ETDRS RECOMMENDATIONS FOR FOLLOW-UP 51 K. VITAMIN D AND ITS ROLE IN DIABETIC
RETINOPATHY
52
PART II
3. AIMS AND OBJECTIVES 56
4. MATERIALS AND METHODS 57
5. BIOCHEMICAL ESTIMATION OF VITAMIN D IN SERUM
62
6. OBSERVATION AND RESULTS 65
7. DISCUSSION 97
8. SUMMARY 104
9. LIMITATIONS OF THE STUDY 107
PART III 11. BIBILIOGRAPHY
12. PROFORMA
ABBREVIATIONS
PDR – Proliferative diabetic retinopathy NPDR – Non proliferative diabetic retinopathy IDDM – Insulin dependent diabetes mellitus NIDDM – Non insulin dependent diabetes mellitus FBS – Fasting blood glucose
PPBS – Post prandial blood glucose HbA1c – Glycosylated haemoglobin
VEGF – Vascular endothelial growth factor NVD – New vessels on the disc
NVE – New vessels elsewhere
1
INTRODUCTION
Diabetes mellitus is a major cause of morbidity and mortality, the world over. It is the most prevalent endocrine disorder that exists in the world today. It is estimated that the total number of diabetics will increase worldwide from 171 million in 2000 to 366 million in 2030.5
2 approximately 10% have type 1 diabetes, a majority comprising of type 2 diabetes.
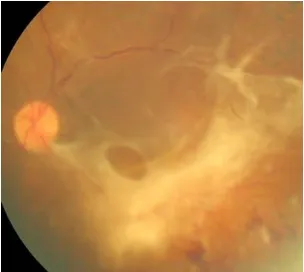
Diabetes is known to cause an array of microvascular and macrovascular complications such as nephropathy, neuropathy, coronary artery disease, peripheral vascular disease and cerebrovascular disease. Among the ophthalmic complications are corneal abnormalities, iris neovascularisation, glaucoma and cataracts. However the commonest ophthalmic complication remains diabetic retinopathy, a sight threatening disorder, which is its microvascular complication. It may have a devastating impact on an individual's quality of life, and hence early detection through routine screening for patients at risk for developing diabetic retinopathy and those who may progress to a severe stage is essential to reduce preventable blindness from this disease.
3 progression of diabetic retinopathy such as the duration of diabetes, glycaemia control, blood pressure, serum creatinine concentration and the body mass index.
Vitamin D, until recently was known for its effects on the musculoskeletal system, however various studies have now demonstrated the non-traditional benefits of Vitamin D, including its role in diabetes mellitus. Chiu KC et. Al. in 2004 showed that it is required for normal insulin secretion and glucose homeostasis.6 It has been shown to have anti-inflammatory, antioxidant, antiangiogenic and antiproliferative functions.
Vitamin D deficiency is a growing health care concern. Several studies have demonstrated widespread vitamin D deficiency and insufficiency, both in patients with a wide spectrum of diseases and in apparently healthy individuals. Holick, M.F. in 2007 found that an estimated 1 billion people were affected by vitamin D deficiency.7
5
REVIEW OF LITERATURE
Diabetic retinopathy is a distressing microvascular complication of both type 1 and type 2 diabetes mellitus. Damage observed in diabetic retinopathy is through the formation of advanced glycosylation end products and increased metabolism through the sorbitol and hexosamine pathway leading to increased production of several growth factors such as vascular endothelial growth factor (VEGF), thereby aggravating the disease process.
The cause of loss of vision in diabetic retinopathy may be macular oedema, macular ischemia, vitreous haemorrhage and tractional retinal detachment. In patients with background diabetic retinopathy, the progression to vision threatening diabetic retinopathy at 1 year has been estimated to be 5% and for pre-proliferative retinopathy the same has been found to be 15%.
6 The Chennai Urban Rural Epidemiology Study (CURES) I demonstrated the prevalence of diabetic retinopathy as 17.6%. The Chennai Urban Rural Epidemiology Study (CURES) 2 study was undertaken to demonstrate the association between diabetic retinopathy and serum lipids in South Indian urban population.12
7
HISTORY
Retinal manifestation of diabetes were first observed by Eduard Jaeger in 1856. This was possible only after the development of the direct ophthalmoscope in 1855. Albrecht Von Graefe apposed Jaeger’s findings, stating that there was no causal relationship between diabetes and retinopathy.
In 1872, Edward Nettleship provided the first histopathological evidence of “Cystoid Degeneration of the Macula” in patients with Diabetes in his publication. The proliferative changes occurring in Diabetic Retinopathy and the importance of tractional retinal detachments and vitreous haemorrhages were then described by Wilhelm Manz in 1876.
8
ANATOMY
The retina forms the inner coat of the eye ball, where the optical image is formed by the optical system of the eye. It is has a purplish red appearance due to the presence of visual purple in the rods. Its thickness ranges from 0.56mm in the peripapillary retina to 0.18 to 0.2 at the equator and about 0.1mm at the ora serrata. It is thinnest at the fovea. It has a surface area of 266 mm2.
It has an outer pigmented and inner neurosensory layer, both of which are derived embryologically from the neuroectoderm. The outer retinal pigment epithelium develops form the outer layer of the optic cup and the inner neurosensory layer develops from the inner layer of the optic cup. The neural retina terminates anteriorly at the ora serrata.
Specialised Areas of the Neural Retina:
Macula Lutea
9
Fovea Centralis
It is a depressed area in the centre of the macula lutea, measuring about 1.85mm in diameter. The floor is called the foveola and the sides of the depression are called Clivus. This depressed area is formed due to the nerve cells being displaced peripherally, leaving only the cones in the centre. There are no rods or blood vessels overlying the fovea. The fovea has the highest concentration of cones and hence represents the area of maximum visual acuity of the eye. It accounts for 5 degrees of the visual fields.
The foveola is located 2 disc diameters from the temporal edge of the optic disc and 1 mm below the horizontal meridian. It measures 0.35 mm in diameter. The umbo is a depression at the centre of the foveola and is responsible for the foveolar reflex. The foveal avascular zone is situated outside the foveola, but inside the fovea.
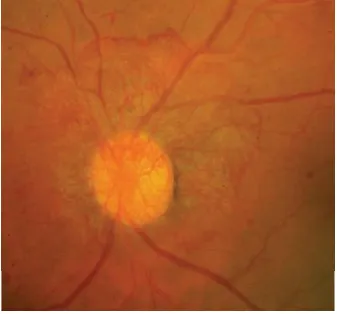
Optic Disc
10 depression which is the physiological cup from where the central retinal vessels enter and leave the eye.
Histology
The retina is composed of 10 layers, based on light microscopic findings. These, from outside to inside are:
1. The retinal pigment epithelium 2. The rods and cones
3. The external limiting membrane 4. The outer nuclear layer
5. The outer plexiform layer 6. The inner nuclear layer 7. The inner plexiform layer 8. The ganglion cell layer 9. The Nerve fibre layer
11
Blood Supply
It is from 2 sources:
1. The Outer Lamina consisting of four layers namely the pigment epithelium, the layer of rods and cones, the external limiting membrane and the outer nuclear layer are supplied by the choriocapillaries.
2. The Inner Lamina comprising of the remaining 6 layers namely the outer plexiform layer, inner nuclear layer, ganglion cell layer, nerve fibre layer and the internal limiting membrane is supplied by the central retinal artery and veins.
3. The outer plexiform layer is supplied partially by the choriocapillaries and partially by the central retinal artery.
Blood Retinal Barrier
13
EPIDEMIOLOGY
There are 171 million people worldwide suffering from diabetes mellitus, a figure which is predicted to be doubled by 2030, according to the 2004 WHO publication. In 2002, 5 million people were blind due to diabetic retinopathy, constituting 5% of the world blindness. The prevalence of diabetic retinopathy in India is found to vary between 10.5% to 26.2%. It is a leading cause of new blindness for individuals between 20 to 74 years of age in both developed and developing countries. This increasing incidence has lead to its inclusion in the "priority list" of "Vision 2020".
Type 1 diabetes mellitus (IDDM) comprises of 10-15% of all diabetics, the remaining 85% being type 2 diabetes mellitus (NIDDM). In type 1 diabetes of less than 5 years duration, diabetic retinopathy is seen in 13% of patients, which increases to 90% with a duration of 10-15 years and 100% with a duration of greater than 20 years.
14 prevalence of 40% in those taking insulin and 24% in those not taking insulin.
While patients with Type 1 diabetes have a high incidence of diabetic retinopathy, type 2 diabetes still accounts for the causation of a majority of the cases observed, due to its increased prevalence.
The prevalence of non-proliferative retinopathy, proliferative retinopathy and macular oedema was reported as 71%, 23% and 11% in IDDM and 47%, 6% and 8% in NIDDM respectively, in the WESDR. They reported a 10 year incidence of retinopathy in IDDM below 30 years age as 89% and that above 30 years age as 79%. In NIDDM patients greater the 30 years age the incidence of retinopathy is less in the estimates provided by more recent population-based studies.14,15
15 the diabetics the crude prevalence of retinopathy was 40%, while 8% of diabetic patients suffered from visual loss due to retinopathy.
Due to advances in the management of diabetes, the prevalence of diabetic retinopathy and its consequential visual loss has not been found to increase, accompanying the increased prevalence of diabetes which has been noted in the recent years. This is attributed to a more stringent glycaemia control in patients with IDDM. This is reflected by the fact that up to 85% patients were found to be using more than 3 injections of insulin daily and up to 91% of patients were practising self monitoring of blood glucose. This resulted in a decrease in the mean levels of HbA1c to 7.6% and up to 33% diabetics attaining the ADA guidelines of a glycosylated haemoglobin level of less than 7%, as observed in the WESDR.
16 Factors that may increase the incidence of diabetic retinopathy include hypertension, obesity, hyperlipidemia, pregnancy and oral contraceptives, glomerulosclerosis and a sudden shift from oral hypoglycaemic agents to insulin.
FACTORS INFLUENCING DIABETIC RETINOPATHY
1. Duration of diabetes
17
2. Age
An increase in the prevalence of retinopathy has been observed as age advances. The hormonal changes during puberty influence the progression of retinopathy. Elevated Insulin like Growth Factor I (IGF I) is produced under the influence of growth hormone and closely resembles a chain of insulin. It is known to enhance the development of diabetic retinopathy.
3. Sex incidence
An increased incidence of proliferative diabetic retinopathy was observed in men with an earlier onset of diabetes than women, in the WESDR study. However besides this, no significant difference in the prevalence or progression of retinopathy was observed between males and females in the WESDR study.
4. Race
18 Americans then the non-Hispanic whites who were 40 years of age or older.
5. Genetic factors
Data from several studies has revealed familial clustering of diabetic retinopathy suggesting a genetic susceptibility. Patients with HLA DR 4 and DR 5 phenotype have been found to have an increased risk of proliferative diabetic retinopathy. HLA B 15 individuals are more likely to develop diabetic retinopathy, while individuals with HLA B 7 are 4 times less likely to develop PDR.
6. Glycaemic control
Retrospective studies measuring glycosylated haemoglobin, evaluating long term control of blood glucose have suggested that hyperglycaemia is closely associated with the development of retinopathy.
19
· Intensive therapy reduced the first appearance of any retinopathy by 27% and clinically meaningful diabetic retinopathy by 35 to 74%.
· Intensive therapy also reduced the development of other
microvascular complications such as reduction of microalbuminuria by 35%, clinical proteinuria by 56% and clinical neuropathy by 60%.
· Intensive treatment included insulin administration at least thrice daily with dose adjustment on the basis of self blood glucose monitoring with aim of achieving normoglycaemia.
However this study was based on the results obtained from patients suffering from IDDM and not NIDDM.22
20 These studies conclusively demonstrate that stringent control of blood glucose, both in patients with IDDM and NIDDM, is of utmost importance to decrease the sight threatening complications resulting from retinopathy. The studies further emphasized the importance attaining the ADA guidelines of a target of HbA1c levels below 7% and suggest that the earlier this level is achieved after the diagnosis of diabetes, the lower the risk for development and progression of retinopathy.
7. Hypertension
21
8. Pregnancy
Pregnancy creates a state of insulin resistance thereby promoting the progression of retinopathy.
9. Protienuria and diabetic nephropathy
Diabetic nephropathy has been found to be a significant risk factor in the development and progression of diabetic retinopathy.
10. Serum lipids
In the ETDRS, higher levels of serum lipids at baseline were associated with an increased incidence of hard exudates at the macula and decreased visual acuity. Patients with hypercholesterolemia and receiving insulin therapy, demonstrated an increase in the number of hard exudates on fundus evaluation. 14,15
11. Smoking
22 monoxide concentrations. However most studies, showed no association between smoking and retinopathy.14,15
12. Alcohol
In patients with IDDM, alcohol intake was found to decrease the incidence of PDR in some studies.14,15 In the UKPDS, an increased alcohol consumption was found to be related to an increased incidence of retinopathy only in newly diagnosed young men with NIDDM.
13. Ocular factors
23
CLASSIFICATION
The most wide used classification internationally is that proposed by the Early Treatment Diabetic Retinopathy Study (ETDRS) or the modified Airlie House Classification. It gives a better understanding regarding the progression and management of the disease.
ETDRS Classification of diabetic retinopathy
I. NPDR (Non Proliferative Diabetic Retinopathy)
It is characterised by configurational changes in the veins, exudates and retinal haemorrhages. The severity of retinopathy is sub-classified as
a. Mild NPDR:
At least one microaneurysms and definition not met for moderate NPDR.
24 b. Moderate NPDR:
· Severe retinal haemorrhages (more than ETDRS standard photograph 2A: about 20 medium-large per quadrant) in 1-3 quadrants or mild intraretinal microvascular abnormalities (IRMA).
· Significant venous beading can be present in no more than 1 quadrant.
· Cotton wool spots are commonly present.
The risk of progression to PDR is 12-27 % within 1 year and 33 % within 5 years.
c. Severe NPDR:
The 4-2-1 rule; one or more of:
· Severe haemorrhages in all 4 quadrants
· Significant venous beading in 2 or more quadrants
· Moderate IRMA in 1 or more quadrants
25 d. Very severe NPDR
Two or more of the criteria for severe NPDR. The risk of developing PDR is 75 % within 1 year.
II. Proliferative diabetic retinopathy (PDR)
a. Early
New vessels on the disc (NVD) or new vessels elsewhere (NVE), but extent insufficient to meet the high-risk criteria. The risk of developing high-risk PDR within 5 years is 75 %. b. High-risk
· New vessels on the disc (NVD) greater than ETDRS standard photograph 10A (about ½ disc area)
· Any NVD with vitreous or preretinal haemorrhage
· NVE greater than ½ disc area with vitreous or preretinal haemorrhage (or haemorrhage with presumed obscured NVD/E)
Macular oedema can be classified as:
26
· Ischemic
· Mixed
Clinically significant macular oedema (CSME) was defined in ETDRS as:
· Retinal thickening within 500 microns of the centre of the macula
· Exudates within 500 microns of the centre of the macula, if associated with retinal thickening (which may be outside the 500 microns)
27
PATHOGENESIS OF DIABETIC RETINOPATHY
Structural, rheological and biochemical factors contribute to the development of diabetic retinopathy.
I) Structural changes
1. Capillary basement membrane thickening
Electron microscopy has proved marked thickening of the basement membrane, with swiss-cheese like vacuolization and deposition of fibrillar collagen which stains positive for type III collagen.
2. Loss of microvascular intramural pericytes
In digest preparation they have been noted as empty, balloon like spaces bulging from the side of the capillary wall. This is probably related to the action of the sorbitol pathway.
3. Loss of endothelial cells and endothelial cell dysfunction
28 cell junctions become loose which could be related to the reduced expression of ZO-1 protein. Fenestrations appear in the endothelial cell cytoplasm.
II) Rheological changes
1. Platelet abnormalities
An increased platelet adhesiveness and aggregation and decreased platelet survival has been demonstrated by various studies. The cause of increased platelet aggregation may be due to elevated levels of Von Willebrand factor-Factor VIII, increased production of thrombaxane A2 by platelets and reduced prostaglandin production by endothelial cells
2. Red blood cell abnormalities
29 increased erythrocyte aggregation results in increased blood viscosity and microinfarction of the retinal vasculature.
III) Biochemical changes
1. Prolonged hyperglycaemia
This is a major etiological agent for all microvascular abnormalities of diabetes including retinopathy. The cellular mechanisms postulated are as follows:
· Prolonged hyperglycaemia alters the expression of genes leading
to the formation of gene products that can alter cellular functions
· Advanced glycation end products are formed by the non-enzymatic binding of several sugars to proteins, which are long lived and play a causal role in diabetic complications
30 2. Sorbitol pathway
It is the most prominent enzymatic mechanism suggested to cause diabetic retinopathy and other complications. Sorbitol formed from glucose by aldose reductase, is slowly converted by sorbitol reductase to fructose. Since the latter reaction is a slow process, sorbitol accumulates in toxic concentrations leading to endothelial cell damage and cellular oedema.
3. Diacyl glycerol (DAG) and Protein Kinase C (PKC)
The level of DAG and the activity of PKC is elevated in patients with diabetes leading to decreased retinal blood flow.
4. Insulin receptors and glucose transportation
31 5. Vascular endothelial growth factor (VEGF)
It is an angiogenic factor. An upregulation of genes for its expression has been noted in hypoxia of proliferative diabetic retinopathy. It may also be responsible for macular oedema in diabetic retinopathy.
Hence the following sequence of events can be postulated in diabetic retinopathy:
1. Hyperglycaemia with insufficient insulin is the starting point. Advanced glycation end products are formed due to nonenzymatic binding of several sugars to proteins. Chronic hyperglycaemic results in oxidative stress.
2. Altered signalling of pathways involving protein kinase C, nuclear factor kappa-B and MAP kinase occurs due to increased polyol metabolism of glucose.
3. This results in damage to RPE cells, endothelial cells, pericytes and neurons. Recruitment of inflammatory cells also occurs.
32 5. Elevated fibrinogen and alpha 2 globulin result in increased red
cell aggregation
6. Elevated growth hormone is associated with increased production of Von Willebrand factor and reduced prostacyclin levels leading to increased platelet aggregation.
7. Hyperglycaemia impairs prostacyclin production by endothelial cells.
8. Impaired RBC and platelet aggregation impairs haemorheodynamics in the microcirculation.
9. Impaired blood flow in the microcirculation caused by a sluggish flow rate or microinfarction leads to hypoxia and ischemia.
33
CLINICAL FEATURES
Diabetic retinopathy can be broadly classified into the proliferative and non-proliferative varieties. The hallmark of proliferative retinopathy being presence of new vessels in the retina and optic disc. The clinical features are as follows:
1. Microaneurysms
These are usually the first visible signs of diabetic reinopathy and the hallmark of NPDR. They are identified ophthalmoscopically as red dots, most commonly in the posterior pole. Their size ranges from 15 to 60 microns in diameter. Histologically, they are hypercellular outpouchings of the capillary wall. On FFA, they can be identified as hyperfluorescence dots much more extensive than those identified clinically. Punctuate haemorrhages, in contrast show blocked fluorescence on FFA. Hence FFA can be used to distinguish between the two.
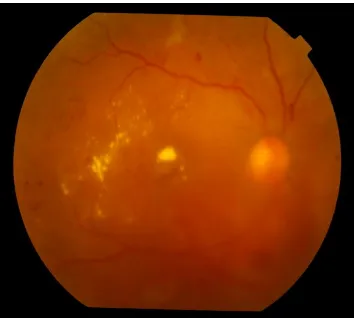
2. Hard exudates-
34 usually seen as discrete intra retinal deposits surrounding microaneurysms in a circinate ring. They are usually located in the outer layers of retina, but can be more superficial and may be seen as individual dots or confluent patches. In late stages subretinal exudates can be replaced by fibrotic plaques.
3. Soft exudates-
These are small, whitish, fluffy, superficial lesions that represent infarction of the retinal nerve fibre layer with accumulation of neuronal debris. The swollen ends of the disrupted nerve axons are known as cystoids bodies.
4. Intraretinal Microvascular Abnormalities(IRMA)-
These are arteriovenous shunts that run from retinal arterioles to venules, bypassing the capillary bed. Hence they are seen in areas adjacent to marked capillary non-perfusion as fine, red, irregular intraretinal lines.
5. Venous abnormalities-
35 narrowing and dilatation. Abnormalities within one half disc diameter of the disc margin are ignored. These changes correlate with risk of developing proliferative changes.
6. Arteriolar abnormalities-
These are early markers of ischemic changes and include peripheral narrowing, silver-wiring and vascular obliteration. Abnormalities within one half disc diameter of the disc margin are ignored.
7. Capillary closure
It is one of the most important features of diabetic retinopathy, the extent and location of which is most accurately visualised on fluorescein angiography.
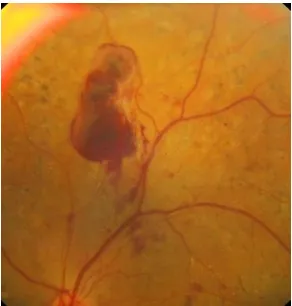
8. Retinal haemorrhages
36 engorgement of capillaries. Deeper dark round haemorrhages representing hemorrhagic retinal infarcts may also occur. These may indicate subsequent progression to neovascularisation. Flame shaped haemorrhages arise in the nerve fibre layer from pre-capillary arterioles.
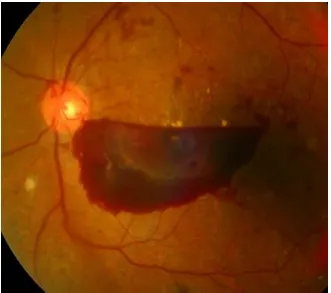
9. Preretinal haemorrhage-
Both boat shaped haemorrhages with a fluid level and round, oval or linear patches of the haemorrhage just anterior to the retina or under its internal limiting membrane are included in pre-retinal haemorrhages. Haemorrhages on the surface of the detached retina, is also considered to be preretinal haemorrhage.
10. Diabetic macular oedema
37 layer and the outer plexiform layer, however it may eventually involve the entire thickness of the retina.
11. New vessels-
These are most commonly seen at the posterior pole, though they may occur anywhere in the posterior pole. At least one quarter of the retina must be non-perfused prior to the development of proliferative changes. They appear as irregular vessels, often forming networks which may be accompanied by fibrous tissue which gradually increases as these vessels increase in size. Neovascularisation at the disc (NVD) is neovascularisation on or within one disc diameter of the optic disc, while neovascularisation elsewhere (NVE) is present away from the optic disc. Neovascularisation of the iris (NVI) may also develop which has a high risk for the development of neovascular glaucoma.
12. Vitreous changes
38 into the vitreous cavity. Pre-retinal haemorrhages may also break into the vitreous. Vitreous condensation and fibrosis may also occur.
13. Retinal detachment
39
CLINICAL EVALUATION
1. Visual Acuity
Visual loss mainly depends on the involvement of the macula.
2. Indirect Ophthalmoscopy and slit lamp biomicroscopy with 90 D lens
This technique allows the examiner to integrate the view of the entire retina.
3. Direct Ophthalmoscopy
Though the area of retina examined is smaller, the increased magnification of this method allows detailed examination of the various retinal lesions.
4. Fundus Photography
40 passing through the centre of the disc and horizontal lines passing through its upper and lower borders. It is useful for documentation of lesions and during follow up.
5. Fundus Fluorescein Angiography
This is one of the essential investigations needed in diabetic retinopathy. It can demonstrate microaneurysms, intraretinal microvascular abnormalities, new vessels and the extent of capillary closure. It provides the earliest evidence of a breech in the blood retinal barrier. Macular oedema can also be detected on FFA and classified into the focal, diffuse or ischemic variety. In eyes with asteroid hyalosis or hazy media, FFA may reveal lesions previously undetected on fundus examination.
6. Optical Coherence Tomography
41 7. Ultrasonography
42
MANAGEMENT
I. Non-Proliferative Diabetic Retinopathy
The Diabetic Retinopathy Study (DRS) and the Early Treatment Diabetic Retinopathy Study (ETDRS) are two landmark trials where laser photocoagulation was the principal modality of treatment. The results of these trials form the basis for the guidelines presently used in the treatment of diabetic retinopathy. The treatment for NPDR varies based upon the severity of the diabetic retinopathy and whether there is an associated clinically significant macular oedema.
II. Proliferative diabetic retinopathy
43
Laser photocoagulation
It involves transpupillary delivery of laser energy for the production of burns in the retina. It causes destruction of some retinal areas, allowing the blood and oxygen to be better delivered to the rest of the retina, thus having a beneficial role in retinal ischemia and decreasing the release of angiogenic factors.
Scatter Photocoagulation for NPDR
It has been observed that the risk-benefit ratio of photocoagulation becomes more favourable as the retinopathy progresses from severe or very severe non proliferative stage or early proliferative stage. The risk of visual loss is significantly reduced by early scatter photocoagulation in patients with NIDDM (Ferris et al).
Photocoagulation for Diabetic Macular Oedema
44 in the edematous retina. Laser burns must be of 50 – 100 microns in diameter, 0.1 seconds exposure time and must be applied between 500 – 3000 microns from the centre of the fovea. In ETDRS, the grid laser photocoagulation was used in cases of diffuse macular edema where focal areas of leakage could not be identified. It consists of light intensity burns with a spot size of 50-200 microns, exposure time of 0.1 seconds and spaced more than 1 burn width apart.
The adverse effects of photocoagulation observed in some patients include the development of choroidal neovascularisation, which may lead to subretinal fibrosis. The risk factor for these adverse effects was the presence of extensive hard exudates depositions in the posterior pole in patients with hyperlipidemia.
The ETDRS study demonstrated that treated eyes had a 12 percent loss of 15 letters of vision in 3 years compared to 24 percent in the untreated eyes.
Photocoagulation for PDR
45 There has been wide agreement that prompt treatment must be initiated in most eyes with PDR that have well established NVD or vitreous or preretinal haemorrhages. Extensive neovascularisation in the anterior segment is a strong indication for scatter photocoagulation. Cryo applications or vitrectomy with endo photocoagulation are other alternatives which may be used if media opacities prevent visualisation of the retina. Signs of severe retinal ischemia increase the urgency to initiate scatter photo coagulation, as these eyes are more prone to anterior neovascularisation.
ETDRS Protocol for Photocoagulation
46 The ETDRS recommended that scatter treatment should be considered only in eyes nearing the high risk stage, where the risk-benefit ratio of photocoagulation was approached a favourable range. It must be avoided in mild and moderate NPDR.
In patients with very severe NPDR or moderate PDR, systemic factors must be taken into account while deciding when to begin treatment. Diabetic retinopathy may progress rapidly in pregnancy and renal failure, warranting earlier treatment. Macular oedema sometimes increases at least temporarily, after scatter photocoagulation. This may be followed by transient or persistent reduction of visual acuity.
The six factors to be considered at follow up are -
1. Change in new vessels since the last visit or last photocoagulation. 2. Appearance of new vessels
3. Frequency and extent of vitreous haemorrhages since last visit 4. Status of vitreous detachment
47 When additional scatter treatment is carried out using the above mentioned protocol, burns are placed between the treatment scars, sparring the area within 500 microns of the centre of macula using burns not larger than 200 microns. The areas chosen are generally those in which new vessels.
Anti-VEGF drugs
Currently 3 anti-VEGFs are available, Ranibizumab (Lucentis), Pegaptinib (Macugen) and Bevacizumab (Avastin). Vascular endothelial growth factor (VEGF) has been found responsible for most of the proliferative changes in diabetic retinopathy. Hence intravitreal injections of anti-VEGF agents have been postulated to have significant role in treatment.
Several studies have established its role in macular oedema, demonstrating that all 3 drugs were useful in decreasing macular oedema and improving the vision. However, recurrence may occur requiring repeated injections.
48 photocoagulation needed, laser still remains the treatment of choice for PDR. These drugs may be used in persistent neovascularisation not responding to laser therapy and pre-operatively, to reduce the risk of intraoperative haemorrhage.
These drugs may be associated with worsening of fibrosis or precipitation of tractional retinal detachment. Following anti-VEGF injections, a shift in the balance between VEGF and the profibrotic factor, CTGF may occur, promoting these changes.
Steroids
49
Other medical therapies
Aspirin use did not affect the progression of retinopathy or the risk of visual loss according to the ETDRS. Aldose reductase facilitates the conversion of glucose to sorbitol. The use of aldose reductase inhibitors have not demonstrated any beneficial effects in diabetic retinopathy (Sorbinil Retinopathy Trial Research Group, 1993).73 Lowering of serum lipids was found useful in macular oedema associated with hyperlipidemia.
Vitrectomy
50
SCREENING SCHEDULE - SUGGESTED FOR
DETAILED OPHTHALMIC EVALUATION OF
DIABETIC PATIENTS
Type of diabetes Timing of first eye examination
Follow up interval recommended
Type 1 Within 5 years of the diagnosis
Every 1 year
Type 2 At the time of diagnosis
Every 1 year
Any type with pregnancy
Before conception or in the early first trimester
51
ETDRS RECOMMENDATION FOR FOLLOW-UP
CATEGORY FOLLOW UP
No diabetic retinopathy Review in 12 months
Mild NPDR Review range of 6-12 months, depending stability, severity and associated systemic features
Moderate NPDR Review in approximately 6 months
Severe NPDR Review in 4 months Very severe Review in 2-3 months
Early PDR Treatment considered according to stability, severity and associated systemic factors. If the patient is not treated, review in 2 months High-risk PDR Treatment should be performed
52
VITAMIN D AND ITS ROLE IN DIABETIC
RETINOPATHY
53 of biologically inactive vitamin D in adipose tissue may result in Vitamin D deficiency.27 Ogunkolade WB et. Al. demonstrated that chewing of beetle nut resulting in increased conversion to inactive vitamin D metabolite, 24,25 (OH)2D is also known to result in a deficient state.28
Although Vitamin D is known for its association with calcium and phosphorus homeostasis and bone metabolism, recent evidence has revealed several unconventional functions of vitamin D including its role in respiratory, cardiovascular, infectious and autoimmune diseases and cancer.29-38
54 further supported by animal studies.47,48 Borrisova A.M. et. Al. and Chiu C.J. et. Al. have now conclusively demonstrated that vitamin D influences the pathogenesis of diabetes mellitus through both pancreatic insulin secretion49 and insulin sensitivity and thereby affects the pathogenesis of the disease.50 Hitman G.A. et. Al. demonstrated that the beta cells possess receptors for the activated hormone 1, 25-dihydroxyvitamin D3 (1, 25(OH) 2 D3) and vitamin D-dependent calcium-binding proteins.51 An improvement in insulin release in response to oral glucose load was seen following Vitamin D supplementation in one study. It was accompanied by a reduction in free fatty acids and an increase in serum calcium.52 Vitamin D may influence insulin sensitivity by mediating calcium metabolism and regulation of insulin receptor gene.53 It also regulates human peroxisome proliferator activated receptor D, which may have an important role in insulin sensitivity.54-55
55 of 1, 25(OH) 2 D3 in inhibiting retinal neovascularization by using a mouse model of ischemic retinopathy,57 while Kaur H. et. Al. showed that it inhibited endothelial cell proliferation in cell culture studies.58
56
AIMS AND OBJECTIVES
AIMS
To evaluate the effect of supplementation of Vitamin D in delaying the progression, the association of serum 25 hydroxy Vitamin D with the level of Diabetic Retinopathy, and its use as a predictor of the severity of Diabetic Retinopathy.
PRIMARY OBJECTIVE
To evaluate whether the oral supplementation of vitamin D delays the progression of Diabetic Retinopathy.
SECONDARY OBJECTIVE
To evaluate the association between serum 25 hydroxy Vitamin D and the level of Diabetic Retinopathy
57
MATERIALS AND METHODS
SUBJECT SELECTION:
40 patients with type 2 diabetes mellitus and diabetic retinopathy were included in this prospective, interventional study which was carried out at the department of vitreo-retina services, Regional Institute of ophthalmology and Government ophthalmic hospital, Madras Medical College, Chennai, over a period of 1 year.
Inclusion criteria:
· Patients must be aged 18 years and above.
· Patients with type 2 Diabetes Mellitus who are diagnosed as Non Proliferative Diabetic Retinopathy or Proliferative Diabetic Retinopathy
Exclusion criteria:
· Patients with type 1 Diabetes
· Patients previously on vitamin D supplementation.
anti-58 convulsants such as Carbamazepine, phenytoin and phenobarbitone or excessive doses of vitamin A (> 20,000 units/day).
· History of disorders that are known to affect the metabolism of
Vitamin D and major medical illness including renal failure, hepatic dysfunction, and musculoskeletal disorders were excluded
· Serum calcium < 8 or > 11 mg/dL
· Patients on hormone replacement therapy, steroids or testosterone.
PROCEDURE
HISTORY:
59 Patients then underwent a complete systemic and ocular examination.
GENERAL EXAMINATION
General vital data like pulse, blood pressure, peripheral pulses were noted. Height (in meters) and weight (in kgs) was recorded and systemic examination of CNS, CVS, RS and abdomen was done.
OCULAR EXAMINATION
· Visual acuity was assessed by Snellen’s chart and refractive status was noted
· Anterior segment evaluation with slit lamp biomicroscopy was performed
· Intraocular pressure was measured using Goldmann Applanation tonometer
· Diabetic retinopathy was evaluated by a dilated fundus examination using 90D & indirect ophthalmoscopy
60
· All patients will underwent Fundus fluorescein angiography and OCT to assess maculopathy if present
· The levels of retinopathy will then be classified as per the ETDRS.
INVESTIGATIONS
Fasting blood glucose levels (FBS), Post prandial blood glucose levels (PPBS), urine sugar and albumin and serum Calcium were measured. Measurement of serum 25 hydroxy Vitamin D and HbA1C was be done prior to and following 6 months of oral vitamin D supplementation.
Twenty patients received daily oral supplementation of 2000 IU of Vitamin D for a duration of 6 months, constituting the treatment arm, while the other 20 patients served as the control arm.
FOLLOW UP PROCEDURES/ VISITS
61 repeated at each visit. Fundus fluorescein angiography was repeated at 3 months and 6 months. OCT to re-assess maculopathy, was repeated at 3 and 6 months, or earlier in selected patients if deemed necessary. Fasting and post prandial blood glucose levels (FBS and PPBS) and urine sugar and albumin were measured to ensure glycaemia control. Compliance with oral Vitamin D supplementation therapy was ensured by counting the empty medicine strips at each visit and history of Vitamin D toxicity if any was elicited.
ASSESSMENT OF PARAMETERS
· The level and severity of diabetic retinopathy
· Improvement in Best corrected visual acuity (logMAR conversion of Snellen’s chart)
62
BIOCHEMICAL ESTIMATION OF VITAMIN D
IN SERUM
In our study, the direct, competitive chemiluminescent immunoassay (CLIA) method was used for quantitative estimation of 25- hydroxy Vitamin D. This is a United States Food and Drug Administration (FDA)–approved immunoassay method. This method was developed in 2002 and measured total 25-hydroxy vitamin D in serum samples. Hepatic metabolism converts Vitamin D3 and D2 to 25-hydroxyvitamin D. Serum or plasma 25-OH vitamin D levels is the best indicator of vitamin D nutritional status.
PERFORMANCE SPECIFICATIONS
The measurement range is from 4 to 150 ng/ml.
SAMPLE REQUIREMENTS
· Human serum samples
63
PREPARATION OF SAMPLES
At least 250 µL of sample is essential for the first test. Frozen samples must be thawed and mixed thoroughly until a homogeneous specimen is obtained.
STORAGE OF SAMPLES
Samples are stored in the frozen state (-20˚C or below) in glass or plastic vials without any additives or preservatives.
REAGENTS
· Anti 25 OH Vitamin D antibody coated magnetic particles
· Conjugate used is an isoluminol derivative, in phosphate buffer with EDTA, preservatives, surfactants and 10% ethanol
PRINCIPLE OF THE TEST
64 following the second 10 minute incubation period. Chemiluminescent reaction is initiated by adding the starter reagents. The photomultiplier detects the light signal, the strength of which is used to determine the 25-hydroxy vitamin D levels. The light signal, indicated in relative light units bears a negative relation with 25 hydroxy vitamin D levels.
REFERENCE VALUES OF 25 HYDROXY VITAMIN D
Deficiency : <20 ng/ml Insufficiency : 20 – 30 ng/ml Sufficiency : 30 - 100 ng/ml Toxicity : >150 ng/ml
STATISTICAL ANALYSIS
65
OBSERVATION AND RESULTS
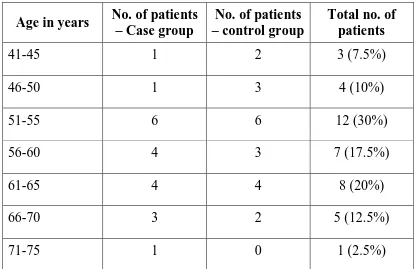
40 patients were enrolled in this study. 20 patients received oral Vitamin D supplementation, serving as the case group and the remaining 20 patients served as the control group.
[image:84.595.100.517.397.666.2]Age distribution
Table 1. Age distribution of a total of 40 patients in
the case and control arm.
Age in years No. of patients – Case group
No. of patients – control group
Total no. of patients
41-45 1 2 3 (7.5%)
46-50 1 3 4 (10%)
51-55 6 6 12 (30%)
56-60 4 3 7 (17.5%)
61-65 4 4 8 (20%)
66-70 3 2 5 (12.5%)
66
Chart 1. Age distribution
In this study patients between 51-55 years were maximally affected (30%). The oldest patient enrolled was 72 years, while the youngest patient was 43 years. The mean age at presentation was 58.85 ± 7.09 years in the case group and 56.50 ± 7.72 years in the control group.
1 1
6
4 4 3
1 2 3 6 3 4 2 0 0 2 4 6 8 10 12 14
41-45 46-50 51-55 56-60 61-65 66-70 71-75
N um be r o f p at ie nt s
Age (in years)
67
Sex distribution
Table 2.Distribution of males and females
Sex
No. of patients – case group
No. of patients – control group
Total no. of patients
Male 9 12 21 (53.5%)
Female 11 8 19 (47.5%)
Chart 2. Sex wise distribution
21 (53.5%) males and 19 (47.5%) females were affected with diabetic retinopathy in this study.
53.50% 47.50%
Sex distribution
68
[image:87.595.102.518.177.311.2]Laterality and symmetry
Table 3. Symmetry of involvement of eyes
No. of patients – case group
No. of patients – control group
Total patients
Symmetrical involvement
18 19 37 (92.5%)
Asymmetrical involvement
2 1 3 (7.5%)
Chart 3. Symmetry of involvement of eyes
All patients enrolled in this study had bilateral disease, however the severity of diabetic retinopathy was asymmetrical in 3 patients (7.5%). The remaining 37 cases (92.50%) had a bilaterally symmetrical presentation of diabetic retinopathy. The age and sex distribution and the symmetry of involvement were not significantly different between
92.50% 7.50%
symmetry of involvement of eyes
Symmetrical involvement
69
[image:88.595.108.507.230.419.2]Severity of diabetic retinopathy at presentation
Table 4. Classification of patients based on severity of retinopathy
at presentation
Severity of retinopathy
No. of patients – case group
No. of patients – control
group
Total patients
Moderate NPDR 5 5 10
Severe NPDR 5 5 10
Very severe NPDR 5 5 10
Early PDR 5 5 10
Table 5.Classification of eyes based on severity of retinopathy at
presentation
Severity of retinopathy
No. of eyes in case group
No of eyes in control group
Total no. of eyes
[image:88.595.110.513.513.686.2]70
Chart 4.Distribution of eyes based on severity of retinopathy
at presentation
In both the case and control group, 5 patients each were diagnosed with moderate NPDR, severe NPDR, very severe NPDR and early PDR. None of the patients were diagnosed with mild NPDR or high-risk PDR at presentation. In patients with asymmetrical disease, the eye with increased severity of retinopathy was used to decide the level of retinopathy to which the patient must be assigned to.
Of the 80 eyes studied, 22 eyes (27.5%) had moderate NPDR, 18 eyes (22.5%) had severe NPDR, 21 eyes (26.3%) had very severe NPDR and 19 eyes (23.8%) had early PDR. The distribution of severity of retinopathy at presentation was not significantly different between the case and control groups by Pearson’s Chi Square test
0 5 10 15 20 25 Moderate NPDR Severe NPDR Very severe NPDR Early PDR
11 9 11 9
11
9 10 10
N um be r o f e ye s
Severity of diabetic retinopathy
71
[image:90.595.104.511.199.380.2]Duration of Diabetes mellitus
Table 6.duration of diabetes
Duration of diabetes (in years)
No. of patients – case group
No. of patients – control group
Total patients
<5 2 0 2 (5%)
5-10 4 6 10 (25%)
10-15 5 8 13 (32.5%)
15-20 6 4 10 (25%)
20-25 3 2 5 (12.5%)
Table 7.Distribution of the duration of diabetes according to the severity of retinopathy
Severity of retinopathy
Duration of diabetes in cases
(in years) Duration of diabetes in controls (in years) p-value
[image:90.595.103.514.493.715.2]72
Chart 5.Duration of diabetes
The duration of diabetes was taken as the interval between the first diagnosis of diabetes mellitus by health personnel and the present study period. A majority of patients (32.5 %) had duration of diabetes between 10-15 years, 25% of patients had duration between 5-10 and 15-20 years, 12.5% had a duration between 20-25 years and the least number of patients had a duration of less than 5 years (5%).
Patients with early PDR had the longest duration, with a mean of 17 years and 18.25 years in the case and control groups respectively. On the other hand, patients with moderate NPDR showed a mean of 9 years and 8.5 years in the case and control groups respectively, being the least.
The mean duration of diabetes in the case and control groups
0 5 10 15
< 5
years 5 - 10 years 10-15
years 15-20 years 20-25 years
2 4 5 6
3 0
6 8 4
2 N um be r o f pa tie nt s
Duration of diabetes (in years)
73
[image:92.595.132.486.394.581.2]Distribution of maculopathy
Table 8.Distribution of maculopathy
Maculopathy No. of eyes - cases
No. of eyes – controls
Total eyes
Present 27 (67.5%) 30 (75%) 57 (71.25%) Absent 13 (32.5%) 10 (25%) 23 (28.75%)
Chart 6.Distribution of maculopathy
A total of 57 eyes (71.25%) had associated maculopathy with features of diabetic retinopathy. The mean CMT at baseline was 250 ± 59.67 microns in the cases and 252.80 ± 54.65 microns in the controls. The cases and controls did not differ significantly in the duration of diabetes, occurrence of maculopathy or the mean CMT at baseline.
67.5 75 32.5 25 0% 10% 20% 30% 40% 50% 60% 70% 80% 90% 100%
Case group control group
74
[image:93.595.116.502.292.615.2]Best Corrected Visual Acuity at baseline
Table 9.BCVA at baseline
Visual Acuity Case group Control group
No.of eyes % No.of eyes %
3/60 - 6/60 6 15 6 15 6/36 – 6/24 8 20 9 22.5 6/18 – 6/12 19 47.5 17 42.5 6/9 – 6/6 7 17.5 8 20
Chart 7.BCVA at baseline
After logMAR conversion, the mean BCVA was found to be 0.5085 ± 0.33059 in the cases and 0.5250 ± 0.33429 in the controls which was not found to be significantly different, with a two-tailed
p-case group control group 0 5 10 15 20 6/6-6/9 6/18-6/24 6/36-6/48 6/60-3/60 6 8 19 7 6 9 17 8 N um be r o f e ye s
BCVA at baseline
75
[image:94.595.102.523.198.363.2]Treatment of diabetes mellitus
Table 10.Treatment of diabetes
Treatment of Diabetes
No. of patients-Case group
No. of patients – control
group
Total no. of patients
Insulin 10 9 19 (47.5%) Oral hypoglycaemic
agents (OHA)
9 9 18 (45%)
Insulin + OHA 1 2 3 (7.5%)
76
Table 11.Distribution of the treatment of diabetes according to the
severity of retinopathy
Treatment of diabetes
No. of
patients-Case group
No. of patients –
control group
Total no. of patients
Moderate NPDR
OHA 5 5 10
Severe NPDR OHA 4 4 8
Insulin 1 1 2
Very severe NPDR
Insulin 4 4 8
Insulin + OHA 1 1 2 Early PDR Insulin 5 4 9 Insulin + OHA 0 1 1
77
[image:96.595.116.502.319.551.2]Treatment of retinopathy
Table 12.Treatment of retinopathy
Treatment of retinopathy No. of eyes – cases
No. of eyes - controls
Grid laser photocoagulation 30 30 Pan-retinal
photocoagulation
29 31
Chart 8.Distribution of retinopathy
Patients in the case as well as control group continued to receive laser treatment in the form of pan-retinal photocoagulation or grid photocoagulation during the course of the study. The number of eyes receiving grid laser photocoagulation was 30 patients each in the case and control groups, while those receiving pan-retinal photocoagulation were 29 and 31 patients respectively in the case and control groups.
28 28.5 29 29.5 30 30.5 31 Grid laser photocoagulation pan retinal photocoagulation 30 29 30 31 N um be r o f e ye s
Treatment of diabetic retinopathy
78
[image:97.595.108.510.202.302.2]Associated systemic diseases
Table 13.distribution of associated hypertension
No. of patients with
hypertension Percentage
Case group 6 15%
Control group 5 12.5%
79
[image:98.595.101.515.214.463.2]HbA1c levels at baseline
Table 14.Distribution of HbA1c levels according to the severity of retinopathy
Severity of retinopathy Mean (in %) Standard deviation Mean (in %) Standard
deviation P value
Moderate
NPDR 7.140 0.270 7.160 0.288
0.9126
Severe NPDR 7.540 0.055 7.520 0.084 0.6666 Very severe
NPDR 7.880 0.084 7.9 0.082
0.7294
Early PDR 8.3 0.1 8.3 0.115 1.0 Total 7.715 0.460 7.715 0.459 1.0
Table 15.Distribution of HbA1c levels
Serum HbA1c levels
No. of patients
Moderate NPDR Severe NPDR Very severe NPDR Early PDR Total patients
[image:98.595.107.510.547.724.2]80
Chart 9.Distribution of HbA1c levels according to severity of retinopathy
The mean serum HbA1c levels were 7.715 ± 0.460% in cases and 7.715 ± 0.459% in controls, which was not found to be significantly different (two-tailed p value=1.0 by unpaired t-test). The levels of serum HbA1c were highest in patients with early PDR in both cases and controls and progressively decreased with increasing severity of retinopathy, being lowest in patients with moderate NPDR.
Of the 40 patients enrolled in the study, a majority (60%) of the patients demonstrated fair gylcaemic control (serum HbA1c = 7.0%-8.0%), 30% of the patients showed unsatisfactory control (serum HbA1c = 8.0%-10.0%) and the remain 10% of patients demonstrated
6.5 7 7.5 8 8.5 Moderate
NPDR Severe NPDR Very svere NPDR Early PDR 7.14 7.54 7.88 8.3 7.16 7.52 7.9 8.3 H bA 1c le ve l ( in p er ce nt ag e)
Severity of diabetic retinopathy
81
[image:100.595.100.516.201.478.2]Serum FBS levels
Table 16.FBS Levels in diabetic retinopathy
Severity of retinopathy FBS levels Mean (in mg/dl) Standard deviation Mean (in mg/dl) Standard
deviation P value
Moderate
NPDR 131.4 8.96 131.25 11.44
0.9830
Severe NPDR 146.8 6.42 147.2 10.43 0.9436 Very severe
NPDR 154.6 4.04 153.6 3.71
0.6943
Early PDR 171.2 7.09 170.4 8.11 0.8722 Total 151.0 16.0 150.8 16.14 0.9688
Chart10.Baseline serum FBS levels in diabetic retinopathy
0 50 100 150 200 Moderate
NPDR Severe NPDR Very severe NPDR Early PDR 131.4 146.8 154.6 171.2 131.2 147.2 153.6 170.4 M ea n FB S le ve l ( in m g/ dl )
Severity of diabetic retinopathy
83
[image:102.595.115.516.208.429.2]Serum 25 hydroxy Vitamin D levels at baseline
Table 17.Distribution of baseline serum 25 hydroxy vitamin D levels
Serum 25 hydroxy Vitamin D levels (ng/ml)
No. of patients
Moderate NPDR Severe NPDR Very severe NPDR Early PDR Total patients
<20 8 8 9 10 35 (87.5%) 20-30 1 1 1 0 3 (7.5%) 30-100 1 1 0 0 2 (5%)
>100 0 0 0 0 0
Table 18. Distribution of baseline serum 25 hydroxy vitamin D levels according to severity of retinopathy
Severity of retinopathy Mean Vitamin D levels (ng/ml) Standard deviation Minimum Vitamin D levels (in ng/ml) Maximum vitamin D level (in ng/ml)
Moderate NPDR 27.573 6.0525 18.8 42.5 Severe NPDR 22.518 3.6956 18.3 32.3 Very severe
[image:102.595.102.512.525.762.2]84
Chart 11.Mean 25 hydroxy Vitamin D levels at baseline according
to severity of retinopathy
A total of 35 patients (87.5%) enrolled in the study were found to have Vitamin D deficiency (serum 25 hydroxy vitamin D: < 20 ng/ml), 3 patients (7.5%) were found to have Vitamin D insufficiency (serum 25 hydroxy vitamin D : 20-30 ng/ml) and 2 patients (5%) were found to have normal Vitamin D levels.
By One way ANOVA with Post Hoc tests and Tukey HSD, a highly significant p value of less than 0.001 was obtained, indicating that the levels of serum 25 hydroxy Vitamin D measured in the 40
0 5 10 15 20 25 30 Moderate
NPDR Severe NPDR Very severe NPDR Early PDR 27.57 22.52 17.58 12.31 M ea n 25 (O H ) V ita m in D le ve l ( in n g/ m l)
Severity of diabetic retinopathy
85 retinopathy increased from moderate NPDR to early PDR. The patients with moderate NPDR had a mean value of serum 25 hydroxy vitamin D of 27.573 ng/ml, which decreased to 22.518 ng/ml and 17.557 ng/ml in patients with severe and very severe NPDR respectively and patients with early PDR had the lowest value of serum 25 hydroxy vitamin D of 19.945 ng/ml.
Pearson correlation test, showed a two-tailed significance of - 0.841, indicating a strongly negative correlation between serum 25 hydroxy Vitamin D levels with the severity of diabetic retinopathy as documented at baseline in all 40 patients. Hence as the serum levels of 25 hydroxy Vitamin D decreased, the severity of diabetic retinopathy was found to increase.
86
Serum 25 hydroxy Vitamin D levels at 6 months
Chart12.Serum 25 hydroxy Vitamin D at baseline and 6 months
The mean serum 25 hydroxy Vitamin D levels were 42.4930 ± 9.9332 ng/ml and 20.1305 ± 1.7346 ng/ml in the case and control group respectively at the end of 6 months, which was significantly higher in the case group following 6 months of oral supplementation than the control group. A two-tailed p value of 0.8793 by the unpaired t-test was obtained.
The mean serum 25 hydroxy Vitamin D levels were 20.1150 ± 8.1012 ng/ml and 20.1305 ± 7.7575 ng/ml in the control group at baseline and at 6 months respectively, showing a no significant
87
Table 19.Distribution of serum 25 hydroxy Vitamin D levels at 6
months in cases
Serum 25 hydroxy Vitamin D3 levels (ng/ml) in cases at
6 months
No. of patients percentage
<20 0 0
20-30 4 10%
30-100 16 80%
>100 0 0
88
[image:107.595.119.498.481.728.2]Severity of retinopathy – at 1 month follow up
Table 20.Severity distribution of retinopathy at 1 month
Severity of retinopathy
at 1 month
No. of eyes in case
group
Percentage in case
group
No of eyes in control group Percentage in control group Moderate NPDR
11 27.5% 11 27.5%
Severe NPDR 9 22.5% 9 22.5% Very severe
NPDR
11 27.5% 10 25%
Early PDR 9 22.5% 10 25%
Chart 13.Severity distribution at 1 month
0 2 4 6 8 10 12 Moderate
NPDR Severe NPDR Very severe NPDR Early PDR 11
9
11
9 11
9 10 10
N um be r o f e ye s
Severity of diabetic retinopathy
90
[image:109.595.111.512.508.732.2]Severity of retinopathy – at 3 months follow-up
Table 21.Severity distribution of retinopathy at 3 months
Severity of retinopathy
at 3 month
No. of eyes in case
group
Percentage in case
group
No of eyes in control group Percentage in control group Moderate NPDR
11 27.5% 11 27.5%
Severe NPDR 9 22.5% 9 22.5% Very severe
NPDR
11 27.5% 10 25%
Early PDR 9 22.5% 2 5% High-risk
PDR
0 0 8 20%
Chart 14.Severity distribution at 3 months
0 2 4 6 8 10 12 Moderate