Progress and challenges
in the transformation
of children and young
people's mental health care
a report of the Education Policy Institute's
Mental Health Commission
Emily Frith
August 2016
EDUCATION
POLICY
INSTITUTE
Published August 2016 Education Policy Institute
This work is licensed under a Creative Commons Attribution-NonCommercial-ShareAlike 4.0 International License. For more information visit creativecommons.org
About the author
Emily Frith is the Education Policy Institute’s Director of Mental Health and Rehabilitation. Prior to this she was Special Adviser to the Deputy Prime Minister, Nick Clegg, with responsibility for Health and Welfare policy from 2013 to 2015. During this time, she coordinated on behalf of the Deputy Prime Minister the campaign to improve mental health services. Emily has also worked for the Prison Reform Trust on support for people with mental health problems in the criminal justice system, and the Driver Youth Trust on the identification and support for children with special educational needs. From 2005 to 2009, she was External Affairs Manager for Turning Point, the social care organisation which provides services for people with a substance misuse problem, a mental health problem or a learning disability.
Acknowledgements
The Education Policy Institute would like to thank our Commissioners for their advice and expertise, The Commission would particularly like to thank our Youth Reference Group members for their invaluable advice. They included: Jessica Mell, Foyez Syed, Zoe Johnson, Lucas Shelemy, Denis Kirya, Sai Kadirrajah, Laura Cocks, Holly Cookson, Jasmine Wyeth, and Naomi Barrow.
The Education Policy Institute would also like to thank the following people and organisations who have helped with the research for this report: The Association of State Girls’ Schools; Peter Hindley, Royal College of Psychiatry; Max Davie, Royal College of Paediatrics and Child Health; Steve Mallen, MindED Trust; Helen Pye, South West Yorkshire NHS Partnership Foundation Trust; Paul Jenkins, Chief Executive, and Paul Burstow, Chair, Tavistock and Portman NHS Foundation Trust; Professor Jim McManus, Director of Public Health, Hertfordshire County Council; Revd Dr Brendan McCarthy, National Adviser: Medical Ethics and Health and Social Care Policy, The Archbishops’ Council, The Church of England; Dr Sam Royston, Director of Policy and Research, The Children’s Society; Fergus Crowe, Chief Executive, Winston’s Wish; Andy Bell and Lorraine Khan, Centre for Mental Health; Max Birchwood, Professor of Youth Mental Health, Warwick Medical School; Catherine Roche, Chief Executive, Place2Be; the Anna Freud Family School; Duncan Law, Anna Freud Centre; Zoe Mulliez, Healthwatch England; Liz Maudslay and Pirandeep Dhillon, Association of Colleges; Laurie Oliva, Young Minds; Professor Isobel Heyman, Great Ormond Street Hospital; Tony Childs, HSCIC; Alan Wardle, NSPCC; Sarah Woodhouse, Turning Point; Dr Ann York CQC; Nerys Anthony, Director, Young People Health and Wellbeing, Catch 22; Barbara Rayment, Youth Access; Neil Ralph, Health Education England; Jeff Halperin, Camden and Islington Foundation Trust; Emma Wilson, CRN Mental Health Young Person’s Advisory Group; Sinem Cakir, Chief Executive, MAC UK.
The author would like to thank David Laws and Natalie Perera for their editorial advice and Anthony Rowlands, Jo Hutchinson, Rebecca Johnes, and Russell Eagling for their support on final drafting.
About
Contents
Foreword by Rt. Hon. Norman Lamb MP
4
Introduction
5
Executive Summary
7
1. Local Transformation Plans
11
2. Barriers to transformation
20
3. National policy progress since Future in Mind
39
Conclusion
31
Foreword by Rt. Hon. Norman Lamb MP
When I launched Future in Mind in March 2015, my aim was to modernise the way children and young people's mental health services operate. Central to this objective was the need to tackle the treatment gap that exists. Far too many children and young people in this country are unable to get the help they need in a timely way. Our current child and adolescent mental health system is often geared towards intervening only when a crisis is reached. The vision of Future in Mind, with the additional funding secured in the Budget last year, is to move towards a system focused on prevention and early-intervention, where specialist services are integrated with wider health and care support.
This report explores progress over the first year of the programme. A huge amount of work has been going on across the country to explore new ways of working, reduce waiting times and increase access for young people. I pay tribute to the dedication and commitment of people working within Child and Adolescent Mental Health Services who do not always get the thanks and attention they deserve. These clinicians and other workers share our vision of a different approach. Nevertheless, they are often frustrated in their endeavours by working in a system which is not yet fit for purpose.
This report shows wide variation in progress achieved so far, and aims to help those areas of the country which are struggling with the challenge to learn from areas which are leading the way. Our analysis of published plans does not claim to provide a detailed exploration of progress in each area but simply to demonstrate the variation within the plans as they were written and to highlight where improvements can be made as the process of transformation continues.
We have also identified the key barriers to progress, the most concerning of which relates to the workforce. Unless there is a concerted effort at a national level to tackle the workforce shortages and training needs that exist, we will not be able to close the treatment gap and ensure that our children and young people can get the support they need. In addition, the workforce of the future must have the right skill mix to achieve far better prevention and early intervention as envisaged by Future in Mind.
The Education Policy Institute (previously known as CentreForum) established a Commission on Children and Young People’s Mental Health in December 2015. Chaired by former Mental Health Minister Rt. Hon. Norman Lamb MP, the Commission aims to understand and explore progress in transforming children and young people’s mental health services in England. The other Commissioners are:
z Roy Blatchford, Director, National Education Trust
z Sarah Brennan, Chief Executive, Young Minds
z Professor Tanya Byron, clinical psychologist, writer, broadcaster and government advisor
z Kat Cormack, mental health consultant
z Jacqui Dyer, adviser to Department of Health and NHS England, service user and carer z Professor Peter Fonagy, Chief Executive, Anna Freud Centre, London
z Dr Lise Hertel, GP, Clinical Lead for Mental Health, NICE, Newham CCG
z Tim Horton, Health Foundation, former advisor to Ed Miliband MP
z Dr Charlie Howard, Founder, MAC-UK
z Dan Mobbs, Chief Executive, MAP, advice and counselling service, Norfolk and Norwich
Our first report, Children and Young People’s Mental Health: The State of the Nation was published in April 2016.1 This found that child and adolescent mental health services are turning away, on average,
nearly a quarter (23 per cent) of the young people referred to them for help. Our analysis of services’ eligibility criteria showed that this is often because there are high thresholds for access to their services. Once a referral is accepted, young people frequently have to wait many months for treatment. Indeed, the average of trusts’ longest waiting times was nearly ten months between referral and the start of treatment. There was also significant variation in waiting times between providers. The average waiting time in Gateshead was five times as long as for those just down the road in Tyneside. Similarly, waiting times in North West London vary widely from two months in Kensington and Chelsea, to nearly six months in Brent.
In this, our second report, the Commission has focused on progress in transforming services since the publication of the Coalition Government’s strategy, Future in Mind, in March 2015.2 Accompanied by
announced investment of £1.25bn over five years, the strategy aims to improve the care offered to children and young people in England by 2020. This report explores what progress has been made in the first year of the programme and the barriers and risks which could hinder the process of transformation.
Note on Methodology
The Commission was very concerned about ensuring the voice of young people was central to our work. After careful discussion on the best approach to this, we recruited a Youth Reference Group, inviting and supporting young people to apply via a number of organisations. We would like to thank our Youth Reference Group members for their invaluable advice. They included: Jessica Mell, Foyez Syed, Zoe Johnson, Lucas Shelemy, Denis Kirya, Sai Kadirrajah, Laura Cocks, Holly Cookson, Jasmine Wyeth, and Naomi Barrow. Several members of our Commission continually work directly with young people in their services and Kat Cormack has extensive experience of services both as a client and supporting young people who are currently in treatment.
The research for this report was based on analysis of local transformation plans, which every area in
1 Children and Young People’s Mental Health: State of the Nation, CentreForum, April 2016: http://epi.org.uk/report/children-young-peo-ples-mental-health-state-nation/
2 Future in Mind, Department of Health and NHS England, March 2015: https://www.gov.uk/government/uploads/system/uploads/attach-ment_data/file/414024/Childrens_Mental_Health.pdf
England has developed as a condition of receiving additional investment under the Future in Mind
programme. The methodology for this analysis is described in more detail in Chapter One of this report. In addition, the Education Policy Institute issued a Call for Evidence in February 2016. This was distributed widely to key stakeholders in the field of children and young people’s mental health. It asked for views on the barriers and risks which could hinder progress in transforming services and recommendations for policy change. We received 64 responses from a wide range of organisations and practitioners, which have contributed to this report.
We held roundtables with the Association of Colleges and the Association of State Girls’ Schools to inform our research on mental health and education. We also conducted 51 interviews with professionals across the child and adolescent mental health system and three visits to schools and mental health services.
In order to assess progress in the delivery of Future in Mind, the government’s strategy to improve children and young people’s mental health, the Education Policy Institute’s expert Commission has conducted an analysis of the local transformation plans that have been developed by local partnerships of health and care leaders across the country. These set out each area’s strategy for improving services in line with the vision of Future in Mind and are a condition of receiving the first year’s tranche of the additional investment announced as part of the programme.
Local children and young people’s mental health services have been working very hard to improve support and there are some excellent examples of good practice highlighted in this report. In particular, clinicians within services are, for the most part, driven to improve their services and ensure that these services are centred around the needs of young people. They are often frustrated in doing so by operational policies and systemic problems, and it is these problems and frustrations which this Commission seeks to address.
Our research finds that the process of implementing Future in Mind has led to some positive changes, including:
z Every area of the country has developed a plan, shining a spotlight on children and young people’s mental health and ensuring that all areas have become more aware of the gaps in provision in their locality;
z Local health and care leaders have been working together to coordinate the design of new services;
z The process has delivered some much needed transparency to the system, with local plans including service level information that had previously not been available at a national level;
z Data is now beginning to be gathered nationally to inform service improvement;
z Some excellent examples of local transformation plans, set out in detail in Chapter One of this report.
Nevertheless, our analysis shows wide variation in the quality of local delivery. Of the 121 published plans,3only 18 areas (15 per cent) have ‘good’ plans. 58 plans (48 per cent) ‘require improvement’
and 45 plans (37 per cent) ‘require substantial improvement’.
It is important to note that our analysis was of published plans. Many areas included a lot more information in their internal submissions and it was not possible for us to review those. The local transformation plans represent a moment in each area’s transformation process. We could only analyse the information contained in the plans and it may be that there is good work going on in some areas which was not covered in detail in their published plans. As this methodology has not been used previously, it is not possible to know how far it will act as a marker for whether outcomes of services will be improved in each area. This analysis is therefore not a league table or final assessment of progress in each area. It is intended as a useful tool for areas to measure their progress against their peers. It is also intended to aid transparency by encouraging local health and care leaders to demonstrate their activity in their public plans. We recognise that the plans capture a snapshot of activity at a local level, and that areas were starting from very different positions. A good plan may misrepresent what is happening locally and an area with a less effective plan may have made extensive progress since the plan was produced. Our next report will explore further progress in six areas.
In this report, plans were judged on five measures. These were:
3 The plans have all, apart from one area (Greenwich) been published online. Some have only been published in summary form or do not include the background documents submitted to NHS England for assurance.
z Transparency;
z Involvement of children and young people;
z Level of ambition;
z Early intervention, including links with schools and GPs; z Governance.
For further information about the methodology, please see Section One of the full report.
Overall, the plans were particularly weak on involving children and young people, level of ambition for service reform, and having strong governance to ensure effective implementation.
On average, localities in the Eastern and West Midlands regions performed best. The mean score for the Eastern region was 34.9, while the mean score for the West Midlands was 34.4. Plans from the rest of the South East and the East Midlands received the lowest mean scores: 30 and 29.3 respectively. There was, however, wide variation within regions between different local plans.
Barriers to Transformation
The Education Policy Institute has identified six key barriers to effective delivery of Future in Mind:
i. Workforce (both recruitment difficulties and training needs);
ii. Funding;
iii. Commissioning;
iv. Data;
v. Fragmentation (the complexity and gaps between services);
vi. Intervening too late.
Workforce
In order to investigate the problems within the workforce in more detail, the Education Policy Institute sent a freedom of information request to CAMHS providers. The key findings were as follows:
z 83 per cent of trusts which responded stated that they had experienced recruitment difficulties.
z The same proportion had had to advertise posts on multiple occasions to fill roles.
z Mental health nurses were the most difficult profession to recruit, followed by consultant psychiatrists.
z These recruitment challenges had led to an 82 per cent increase in expenditure on temporary staffing in the last two years. In 2015-16 nearly £50m was spent on agency staff by 32 trusts.
z There was regional variation in recruitment difficulties, with six providers (15 per cent) not
experiencing any problems, in particular trusts in the Midlands and some Northern trusts.
Funding
The £1.25bn over five years announced in March 2015 equates to £250m per year. Only £143m was released in the first year, and of that only £75m was distributed to local health leaders. It is not yet clear how much of this has been spent on frontline services.
For 2016-17, £119m has been allocated to local areas, but this has been included in their total baseline allocation. It has not been ring-fenced and so there is a risk that it will be spent on other priorities. Additionally, as specialist services sit within a wider network of support, from youth services to local authority funded charities and social care, there is a risk that the overall budget for children and young people’s mental health may not increase or may even be reduced due to wider austerity measures.
Commissioning
A recurrent theme in our research was the complexity and quality of local commissioning (the system by which local services are planned and paid for). Commissioning is fragmented across national and local bodies, which causes conflict and confusion. Clinical commissioning groups and local authorities do not always have the expertise in mental health to design services effectively and hold them to account.
Data
Child and adolescent mental health services are still operating without the data they need to plan services effectively. There is no up to date information on how many young people need treatment and what the projected increase in prevalence is over the next five years, which makes it difficult for services to know by how much they need to increase capacity. Similarly, there is no nationally agreed measurement of waiting times or access thresholds, which means that it is very difficult to bench-mark performance and hold providers to account.
Fragmentation
A key barrier to delivering services more effectively is the way in which children and young people’s mental health care is delivered across so many different organisations. This causes fragmentation in the system and risks young people falling through the gaps between services. For example, there is di-vision between early intervention, specialist community and inpatient services. More widely, mental health is often organised in isolation from wider community health and hospital services even though people who use these services often end up needing both physical and mental health treatment (for instance those who self-harm). There is also a divide between mental health services and the edu-cation system, where young people spend the majority of their time and which is a more suitable setting for the identification and early support of vulnerable young people.
Intervening too late
Next steps
Future in Mind set out a vision for the transformation of children and young people’s mental health services, giving ownership to frontline commissioners to manage the programme. All local areas were tasked with developing local transformation plans to set out their strategy for improving children and young people’s mental health care. 122 plans4 were developed by partnerships between the NHS and
local authorities across the country, some covering just one town, while others involved county-wide collaborations. The plans were developed as a condition of receiving the new investment. After a process of assurance, all areas received their funding allocation.
Analysis of the Plans: Methodology
The Education Policy Institute worked with our expert Commissioners to develop a scorecard in order to categorise local plans into one of three distinct groups. These were ‘good’, ‘requires improvement’ or ‘requires substantial improvement’.
Our Commissioners brought a wealth of expertise, both clinical and operational, to the development of the scorecard. They have experience spanning healthcare commissioning, the voluntary sector, education, service user involvement and direct service provision.
Plans were given a score out of 50 based on five measures, each worth 10 points. These were:
1. Transparency
In this category, plans were assessed on the following indicators:
z Understanding their local level of need. This included using national and local data to estimate current and future prevalence rates and need for services at different levels, such as universal/ targeted/specialist or inpatient care;
z Honesty about current service provision, highlighting where problems exist rather than including only positive information;
z Clearly setting out the current problems challenges they face;
z An understanding of workforce development needs.
2. Involvement of children and young people
In this category, plans were assessed on the following indicators:
z How far children and young people were consulted as the plan was developed;
z How far co-production with young people is built into ongoing plans;
z What mechanisms were used to engage young people;
z Whether young people were involved in co-production of services.
3. Level of ambition
In this category, plans were assessed on the following indicators:
z How far the plan is aligned with the key priorities identified in Future in Mind;
z Whether the local area is seeking to transform provision, for example through redesigning the whole service model;
z Whether the plan focused on simply increasing capacity in current services;
z Whether the plan seeks to remove tiers and gaps between services and design a smooth pathway
4 The Greenwich plan was not available at the time of this study so our analysis covered 121 plans in total.
from first referral to specialist treatment.
4. Early intervention including links with schools and GPs
In this category, plans were assessed on the following indicators:
z To what extent the plan invests sufficient resource in outreach;
z Whether the plan includes clear proposals for integrated service provision with universal services such as GP practices and schools;
z To what extent the plan focuses on preventing problems escalating to a point where specialist services are needed;
z How far have they developed plans for use of innovative digital technologies such as online counselling;
z What involvement has there been of voluntary sector providers.
5. Governance
In this category, plans were assessed on the following indicators:
z How likely it is that the plan will be delivered;
z Whether there are clear mechanisms to track progress, such as measureable and ambitious key performance indicators;
z Whether there is sufficient oversight at a senior level. For example, through a partnership steering group or board. How frequently they plan to meet;
z Whether the plan includes an action plan with timelines and deadlines; z Whether the plan includes a risk register.
Given the wide-ranging scope of the plans, the analysis had to choose to focus on these core measures, rather than commenting on every aspect. We were not able to look in detail at proposals on eating disorders, perinatal care, access for vulnerable groups or crisis support. We also could not look in detail at important elements such as improving the competencies of staff with better assessment, supervision and training as this was not covered in detail in many plans.
Plans were rated by the same person and scores were referenced to previously assessed plans to aid consistency.
Analysis of the plans: Results
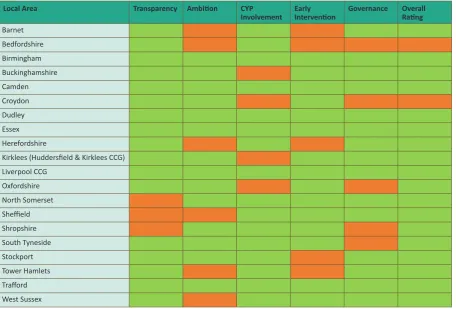
There was wide variation in the quality of plans, with scores ranging from 17 to 46 out of 50. Only 18 plans (15 per cent) were rated ‘good’ – having a score of 40 or higher.
[image:13.595.72.529.251.560.2]58 plans (48 per cent) were rated ‘requires improvement’, based on a score between 30 and 40. 45 plans (37 per cent) had a ‘requires substantial improvement’ rating of lower than 30. Greenwich’s plan was not publicly available at the time the analysis was undertaken.
Figure 1: The twenty highest scoring plans (in alphabetical order)
Local Area Transparency Ambition CYP
Involvement Early Intervention Governance Overall Rating
Barnet Bedfordshire Birmingham Buckinghamshire Camden
Croydon 7
Dudley Essex Herefordshire
Kirklees (Huddersfield & Kirklees CCG) Liverpool CCG
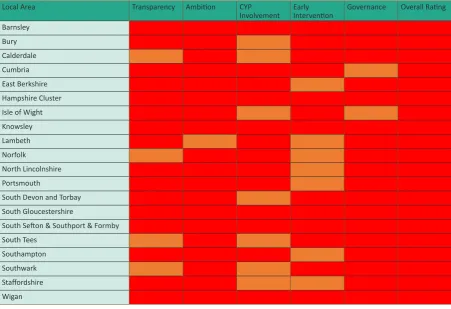
Figure 2: The twenty lowest scoring plans (in alphabetical order)5 Local Area Transparency Ambition CYP
Involvement Early Intervention Governance Overall Rating Barnsley
Bury Calderdale Cumbria East Berkshire Hampshire Cluster Isle of Wight Knowsley Lambeth Norfolk
North Lincolnshire Portsmouth
South Devon and Torbay South Gloucestershire
South Sefton & Southport & Formby South Tees
Southampton Southwark Staffordshire Wigan
Features of the best and worst local plans
Our analysis identified some common features of excellent local transformation plans:
z A high level of ambition to transform the way services are run, in combination with detail on how this vision can be achieved.
z Detailed analysis of local prevalence data and risk factors, combined with an assessment of current service gaps.
z Full and meaningful engagement with children and young people, both those using services and those not currently engaged.
z Excellent partnership working, such as with schools and the voluntary sector, in the design of plans.
z Clear governance structures with dedicated project management, detailed implementation plans with clear objectives, and regular oversight from senior local leaders.
Conversely, there are key themes which characterise those plans which have received a lower score:
z A lack of ambition for service redesign, with plans focused on small scale projects or increasing the capacity of current services without transformation.
z A lack of engagement with the wider agenda behind Future in Mind, with a greater focus instead on how to spend the additional funding.
z A lack of focus on the key challenges which will impact upon delivery, such as workforce capacity, information technology and data. Objectives and/or implementation plans are not clear and governance structures are confusing.
z Inclusion of a lot of detail on government policy or the structure of current services and not much information on future plans.
Scores by category
[image:15.595.79.532.383.656.2]There was not a wide variation between categories. On average, the plans score well on the measure of transparency. They also score better on early intervention, such as awareness campaigns or peer support programmes. The lowest average scores are for level of ambition, involvement of young people, and governance, but these are not far behind the top two measures.
Figure 3: Average scores for local transformation plans by category
5.8 5.9 6.0 6.1 6.2 6.3 6.4 6.5 6.6 6.7 6.8 6.9
Governance Early
Intervention
Involving Children and Young People
Ambition for
Service
Transformation
Transparency
Transparency
The best plans in this category include national and local data on prevalence of mental health problems, broken down by condition, age, gender and the likely impact on each tier of services6. They include
projections for future demand and compare this to the provision of current services. Many have either undertaken or are planning to undertake a full Joint Strategic Needs Assessment focused on emotional wellbeing for children and young people7. They use this effectively to influence the development of
their strategy. For example, City and Hackney’s plan includes a clear comparison between planned provision and projected demand as part of a detailed gap analysis which is then linked closely to the priorities set out in the plan.
The best plans also provide detailed information and analysis about current service performance, including access thresholds and waiting times. They set out what services are on offer locally and are honest about the challenges they face and the gaps in local service provision. This information is also used to influence their priorities for transformation. They recognise the need for a strong focus on workforce audit and training.
The plans that score less well in this category are those which are not transparent about their current service offer and seek to highlight only the positive aspects of their provision, without a full understanding of the challenges they face.
Ambition
Plans that score well in this area are thinking innovatively about how to meet the needs of their local population. For example, Birmingham has established a new service for children and young people from birth to 25. Oxfordshire is redesigning its whole service model to remove artificial thresholds between services. The best plans have detailed proposals on how they will make the changes, such as through retendering the services.
The plans are, for the most part, aligned to the priorities set out in Future in Mind. They often mention increasing access for vulnerable groups, moving away from ‘tiers’ of service and introducing a Single Point of Access.
A subsection of those which score less well focus on increasing capacity in current services without thinking about new ways to deliver care. Another group which scores badly in this category consists of plans which reflect the language and principles of Future in Mind but are vague on detailed implementation plans and it is therefore difficult to gauge what practical changes will be introduced as a result.
For example, some plans talk vaguely about introducing a ‘Single Point of Access’ but it is unclear what this will mean in practice. It could simply mean a single entry point for specialist services, which still have a high threshold of access. Alternatively, a single point of access could cover all services, including early-intervention, and provide a source of consultation and advice for those referring to it.
While some areas have ambitious local plans, overall the level of ambition is disappointing. Very few areas are following the lead of Birmingham and extending services up to the age of 25. While most areas mention exploring the use of new technologies, very few set out in detail radical plans for introducing digital support. In addition, only 15 areas mention plans to encourage staff to offer outreach within communities. The Essex strategy, however, demonstrates innovation on both of these fronts: it sets out how it will work with young people to design self-help apps building on their existing online
6 CAMHS services are traditionally broken down into four ‘tiers’. The best plans estimate demand for universal services (tier one), commu-nity targeted counselling support (tier two), specialist commucommu-nity services (tier three) and inpatient care (tier four).
7 A Joint Strategic Needs Assessment is an important part of health service planning. It is an ongoing process by which local authorities, clin-ical commissioning groups (CCGs) and other public sector partners jointly describe the current and future health and wellbeing needs of
resource, The Big White Wall and includes plans for workers to outreach into community settings such as children’s centres and other familiar and convenient places.
Involving Children and Young People
There is strong evidence that involving children and young people in service design improves the quality of service offered,8 but this involvement can often be tokenistic9. Our analysis found that nearly every
area has conducted some form of engagement with children and young people, but in many areas this has meant a survey or one or more limited engagement events. Overall, plans score poorly in this area. The best areas in this category have a much stronger focus on co-production of new services with children and young people. For example, Camden has undertaken extensive engagement work, including the recent launch of a young people’s outreach service, ‘The Hive’, designed and run in partnership with the young people who will use it. Sheffield and Newcastle Gateshead have both trained young people to be co-commissioners, involved in the design of service specifications. Dorset is amongst those areas giving young people a formal role on their transformation plan steering group.
Early intervention
Plans which score well in this category have clear proposals for joining up specialist services with early intervention support in the community. They might propose named specialist links for GP practices and schools or include the role of the voluntary sector in a joined up pathway of services. For example, Liverpool’s plan includes the establishment of mental health community hubs, reaching into communities to provide drop-in services and parenting programmes. It also includes plans for support in all local schools, including specialist CAMHS consultation and training for school staff.
Those which score less well in this area do not include details of how they will have a greater focus on early intervention and on preventing problems reaching crisis point. Instead they might have vague ambitions for schools and universal services to offer more support.
Our analysis found that while every plan mentions the importance of connections with schools, it was clear that school leaders were not closely involved in the development of the plans. An exception to this is the Croydon plan, which includes a proposal to co-design a programme of support in schools with the education sector, including staff training, commissioning guidance and a whole-school approach to improving emotional wellbeing. Our analysis is borne out by a recent Association of Colleges survey, which found that only about a quarter of those colleges who responded were aware of the existence in their area of a local transformation plan. Of these, half said that their school or college had a role in implementing the plan and only 39 per cent said their school or college had contributed to the plan.
Governance
Local areas with a high score in the governance category inspire confidence that their objectives will be delivered. They include clear information on who will be responsible for overseeing the process, and how often they will monitor progress. For example, Herefordshire has developed separate action plans for the different phases of implementation. It has included a risk assessment and detailed key performance indicators. It has a dedicated steering group meeting bi-monthly with quarterly reports to the Health and Wellbeing Board (the most senior joint commissioning board between the NHS and the local authority). Good plans in this category also focus on better data collection, including outcomes measurement.
8 What good looks like in psychological services for children, young people and their families, Julia Faulconbridge, Duncan Law & Amanda Laffan, The Child & Family Clinical Psychology Review No 3 Summer 2015: https://www.bps.org.uk/system/files/user-files/DCPper cent-20Facultyper cent20forper cent20Children,per cent20Youngper cent20Peopleper cent20andper cent20theirper cent20Families/public/ cfcpr_3.pdf
Those which score less well do not include action plans or key performance indicators in the plan itself. They do not have any evidence of risk assessment and have confusing governance structures or a lack clarity on how frequently progress will be monitored.
Implementation process
Our analysis uncovered some wider themes about the implementation process. It showed that a great deal of work has been undertaken across the country to develop plans. This includes detailed local service assessments, engagement with stakeholders and young people, and extensive partnership working. One important success of the programme so far is the extent to which it has drawn together health clinical commissioning groups and local authorities to think collectively about how to redesign services that had often previously been commissioned in silos. This is evidenced in the way each plan has been created by a partnership between health and social care. It has also ensured that every area of the country has had to think seriously about their local services and understand the gaps which exist in their local provision. It is evident from many plans that local commissioners were only just becoming aware of how much needed to be done to improve their local offer.
An important benefit of the local transformation plan process is the transparency which has resulted about the current availability of services across the country. For example, plans contain information which has been collected nationally for the first time on local expenditure, workforce and access and waiting times. This will enable NHS England to have a much clearer picture of local service provision and variation than was possible before the transformation process began.
There were some inherent flaws within the implementation process. Local areas were driven to complete plans within two months of the publication of the guidance from NHS England. This was seven months after the publication of Future in Mind and so many areas had already begun the process and received support to do so before the guidance was published, but nonetheless it was a tight timetable to deliver radical improvement. It was challenging for areas to think strategically within this timescale about how to invest new funding in a sensible way, particularly in the first year of the transformation process. The short timescale also limited the extent to which young people could be involved in the design of local strategies. The more advanced plans were often those where local commissioners had already instigated a review of local services in advance of the national programme.
Another key stumbling block in the process is the paucity of up to date information on the level of need. Most plans use the Office of National Statistics prevalence study from 2004, so are basing decisions on prevalence data that is over ten years old10. Some areas have attempted to update this with local data
on hospital admissions for self-harm, wellbeing surveys and referral rates. Worryingly, however, even where plans include detailed analysis of local need, this is not often used to inform the key decisions within the strategy.
This paucity of data has meant many local health leaders have struggled to set effective key performance indicators for their plan, as they do not have data of sufficient quality about current services to set baselines for these indicators. The best plans overcome this problem by establishing interim objectives, with clear timetables for setting more rigorous KPIs when baselines have been established.
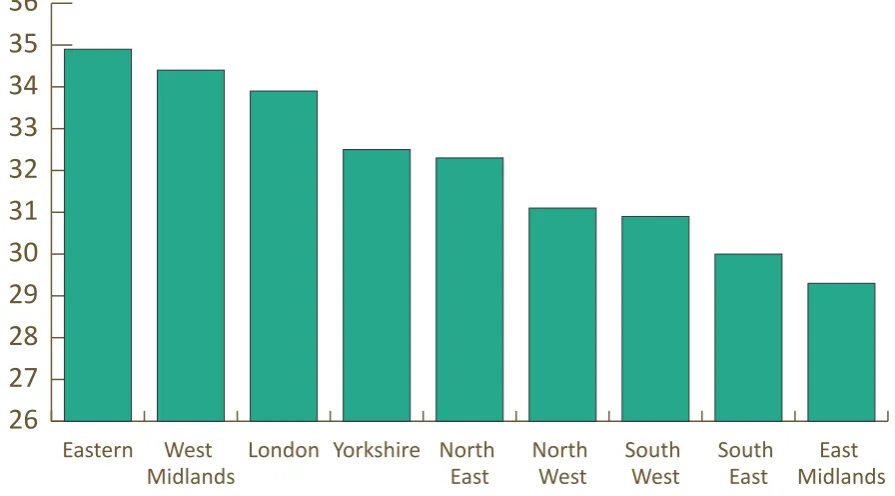
Scores by region
There are some regional differences, although these were tightly distributed. The East Midlands and the South East had the lowest average scores, and the Eastern region and the West Midlands had the highest. The mean score for the Eastern region was 34.9, while the mean score for the West Midlands was 34.4. Plans from the rest of the South East and the East Midlands had mean scores of 30 and 29.3 respectively.
Figure 4: Average scores for local transformation plans by region
26
27
28
29
30
31
32
33
34
35
36
East Midlands South
East South
West North
West North
East Yorkshire
London West
Midlands Eastern
The Education Policy Institute has identified six key barriers which could hinder the process of transformation. These are:
i. Workforce
ii. Funding
iii. Commissioning
iv. Data
v. Fragmentation
vi. Intervening too late
Barriers to Transformation: Workforce
It is impossible to deliver any plan to improve public services without considering the impact on the workforce and the capability of the workforce to deliver the transformation.
According to the Care Quality Commission, staff morale within CAMHS is already often reported as low, and there is evidence of recent reductions in staffing and difficulties in recruitment:
“A recurring theme in our inspections of CAMHS is the difficulty in recruiting nursing staff to cope with
the demand placed on services”11.
According to the Five Year Forward View for Mental Health12, between 2013-14 and 2014-15, referral
rates for CAMHS services increased five times faster than the CAMHS workforce. Some areas report one in ten appointments cancelled because of staff shortages; specialist CAMHS run by junior staff who lack the requisite skills; and too few therapists with the necessary training13.
The Education Policy Institute undertook a Freedom of Information request to explore the extent to which workforce difficulties could hinder the process of improving services. We sent the request to 61 trusts and received full responses from 41, a response rate of 67 per cent.
Results
83 per cent of trusts which responded stated that they had experienced recruitment difficulties. The same proportion had had to advertise posts on multiple occasions to fill roles14.
Trusts were asked to state how many applicants they had per post when they most recently advertised different staff positions. In total, the 41 trusts mentioned 51 instances of a post being advertised and receiving two or fewer applicants.
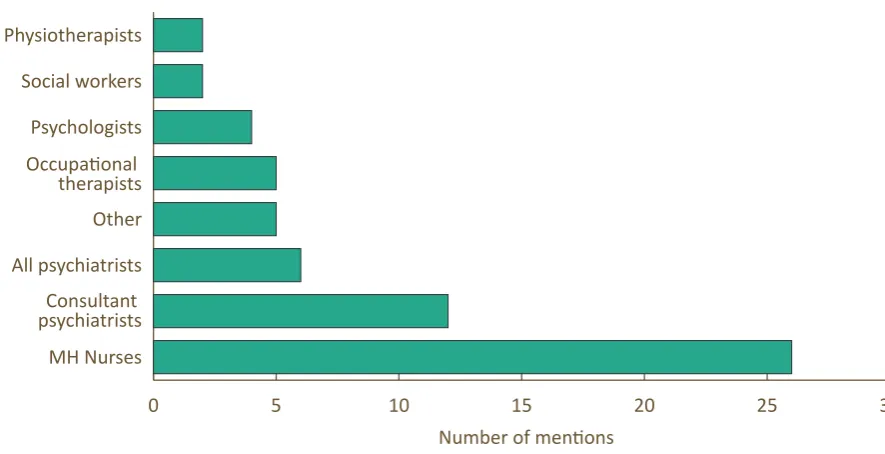
Nurses were the most difficult profession to recruit, followed by consultant psychiatrists.
11 Care Quality Commission submission to Education Policy Institute Call for Evidence 2016
12 Five Year Forward View for Mental Health, A report from the independent Mental Health Taskforce to the NHS in England, February 2016: https://www.england.nhs.uk/wp-content/uploads/2016/02/Mental-Health-Taskforce-FYFV-final.pdf
13 Five Year Forward View for Mental Health, A report from the independent Mental Health Taskforce to the NHS in England, February 2016: https://www.england.nhs.uk/wp-content/uploads/2016/02/Mental-Health-Taskforce-FYFV-final.pdf
14 Trusts were asked if they had had to advertise roles on ‘more than one occasion’.
Figure 12: Recruitment challenges by professional role as reported by provider trusts
0 5 10 15 20 25 30 MH Nurses
Consultant psychiatrists All psychiatrists Other
Occupational
therapists Psychologists Social workers Physiotherapists
Number of mentions
Note: Chart shows number of times the profession was mentioned by trusts as difficult to recruit. Trusts were allowed to mention more than one profession.
There was regional variation in recruitment difficulties, with six areas (15 per cent) not experiencing any problems, in particular trusts in the Midlands and some Northern trusts. Some trusts had specific recruitment difficulties because of their location. For example, Lancashire Care had particular difficulties recruiting in Fylde and Wyre, North Lancashire and West Lancashire.
“We are a fringe high cost area so have difficulties in attracting staff who are able to work within the inner or outer London areas which border our county”.
“Somerset Partnership NHS Foundation Trust is in a rural area with no university and this can limit the number of staff wanting to work in the area”.
Reasons for recruitment difficulties include the high level of speciality required and the stigma associated with this speciality:
“There is a shortage of doctors gaining their [specialism] in child
& adolescent psychiatry possibly because of the intensity of the work, the high stress levels known to be associated with the work, media coverage and bed shortages nationally”.
One respondent told us of the particular difficulties they had faced recruiting psychiatrists:
“Of the CAMHS consultant posts advertised in the last year one advert received no applications and the other advert received 1 application – the candidate declined the offer of appointment”.
As part of our research, the Education Policy Institute also spoke to the Chair of one CAMHS provider which had advertised for a consultant psychiatrist post four times with no success. The post remained vacant and was filled with locum staff, an expensive solution which undermined continuity of care15.
The government has introduced price capping on agency staffing, although evidence so far indicates that there has only been patchy success in enforcing these rules16. 85 per cent of acute trusts (hospital
trusts) that responded to a Nursing Times Freedom of Information request had exceeded the nursing cap since it was introduced. More than 20 trusts had gone over the cap for more than 100 shifts a week. A consultant psychiatrist is likely to work 48 hours per week and earn between £76,000 and £102,000 basic salary with additional pay for working unsociable hours17. A locum consultant psychiatrist could
expect to earn between £70 to £100 per hour for unsociable hours18. This equates to around £200,000
per year, or double the cost of a permanent member of staff. With the addition of the cost of the agency’s fees (around 10 per cent19), this could rise to £220,000 per year.
Temporary staffing
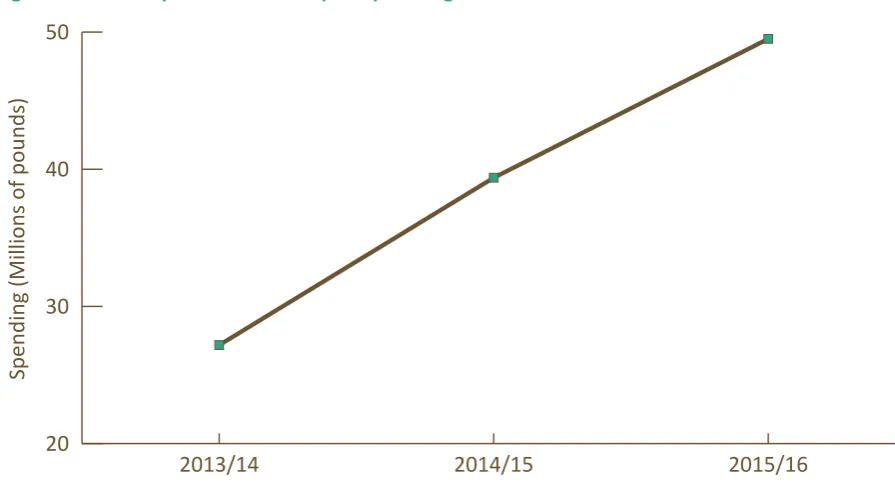
[image:22.595.73.521.336.584.2]32 trusts (78 per cent of those trusts which responded) were able to provide us with information on their spending on agency or locum staff over the last three years. The total expenditure by these trusts on temporary staffing increased from £27m in 2013-14 to nearly £50m in 2015-16, an 82 per cent increase.
Figure 13: Trust expenditure on temporary staffing
20 30 40 50
2015/16 2014/15
2013/14
Spending (Millions of pounds)
Reliance on agency staffing is expensive and can negatively impact on the quality and continuity of care. As one of our youth reference group members explained:
“They didn’t know what they were doing…giving out medication. Trust is such a huge thing. You open up at one appointment and then the next time it’s someone completely different”20.
16 What has the impact been of recent caps on NHS agency staff spend?, Phoebe Dunn, Kings Fund, March 2016: http://www.kingsfund.org. uk/blog/2016/03/nhs-agency-staff-spend and The use of temporary clinical staff in the NHS: An HSJ investigation, December 2015: http:// www.hsj.co.uk/download?ac=3002770
17 https://nationalcareersservice.direct.gov.uk/advice/planning/jobprofiles/Pages/psychiatrist.aspx
18 Taking the temperature: A review of NHS agency staff spending in 2014/15, Liaison, 2015: http://www.liaisonfs.com/assets/user-up-loads/downloads/Temperature-Annual-2014-15.pdf
19 Taking the temperature: A review of NHS agency staff spending in 2014/15, Liaison, 2015:
http://www.liaisonfs.com/assets/user-up-loads/downloads/Temperature-Annual-2014-15.pdf
While it acknowledges that many locum doctors provide excellent care, the GMC has raised concerns over quality standards. The GMC’s chief executive, Niall Dickson, told the BBC: “locum work is risky in the sense that the doctor may not know enough about the hospital where he or she is working. It is risky in the sense that they may be brought in when the team is under considerable pressure, and it is risky in the sense that there may be some locum doctors who find it more difficult to find a permanent job. 21” Future challenges?
There are signs that recruitment difficulties will continue for the foreseeable future. Statistics from Health Education England show that in the August 2015 intake over half (51 per cent) of ST4 (specialist training post) trainee Child and Adolescent psychiatry posts were unfilled22. This means that there
will continue to be significant shortages of consultant psychiatrists in future. According to Health Education England, providers’ plans for the mental health workforce “do not appear to represent the
additional focus and resources we might anticipate in light of the policy around parity of esteem”23.
This may reflect concerns over commissioning plans over the period, as described in the section on commissioning below.
Planned changes to the training of health professionals could impact on the numbers coming into the workforce and therefore make matters worse. The government has proposed that from 1 August 2017, all new nursing, midwifery and allied health professional students on pre-registration undergraduate and post-graduate courses will receive their tuition funding and financial support through the standard student support system, rather than NHS bursaries and tuition funded by Health Education England. According to the Government, under the loans system, students on nursing, midwifery and allied health courses will typically receive around 25 per cent more in the financial resources available to them for living costs than at present. This will, however, no longer be a grant but will be in the form of a loan which will need to be paid back after graduation in the same way as any other student loan24.
These changes are expected to increase the provision of training places by 10,00025 and therefore lead
to a similar increase in the numbers of these professionals working in the NHS. The risk, however, is that the change from a grant to a loan will lead to a reduction in applications for these posts, further undermining the ability of providers to recruit for mental health nursing and allied health professional posts. This approach may in future be extended to clinical and educational psychologists. This would, according to the British Psychological Society, have a “disastrous impact on the availability and diversity of the clinical psychology workforce as clinical psychology training is at postgraduate, doctorate level”26.
It will be important to monitor the impact of this policy carefully during implementation.
Universal services
The children and young people’s mental health ‘system’ is much broader than specialist CAMHS services, encompassing support offered by GPs, schools, community health centres and local hospitals. Thus any consideration of the CAMHS workforce needs to include an understanding of the appropriate role of universal staff such as teachers. All professionals who are in trusted roles of responsibility with young people require basic understanding of mental health needs and the local offer of support. This is currently not in place and many teachers, youth workers, GPs, social workers and NHS staff struggle to know how to identify and help the young people in their care with mental health needs. This leads to the high numbers of referrals into specialist services, many of which are considered by these services as ‘inappropriate’ and sent back to the referrer. There is often a disconnect between the attitudes of
21 http://www.bbc.co.uk/news/health-34702933
22 https://www.nwpgmd.nhs.uk/sites/default/files/ST4%20Fill%20Rate%20Competition%20Ratios%202015.pdf 23 https://hee.nhs.uk/sites/default/files/documents/HEE%20commissioning%20and%20investment%20plan.pdf
24 HEE commissioning and investment plan - 2016/17, Health Education England 2016: https://www.gov.uk/government/publications/ nhs-bursary-reform/nhs-bursary-reform
25 NHS bursary reform, Updated 7 April 2016: https://www.gov.uk/government/publications/nhs-bursary-reform/nhs-bursary-reform
staff within universal services and those within specialist CAMHS as to what constitutes an appropriate referral. This is due to the different languages, organisational cultures, training and perspectives of staff in these different parts of the system, (discussed in more detail in the fragmentation section below). Such barriers can get in the way of a smooth pathway for young people in need of support. Future in Mind called for joint training to be provided for teachers and CAMHS staff and this approach is being piloted in 22 areas. More widely, many local plans include ideas for training universal staff such as teachers in techniques such as mental health first aid. Nevertheless, this approach is not yet being adopted in every area.
Impact of 'Future in Mind'
Additional investment is fuelling recruitment pressures, as local areas compete to increase capacity and recruit CAMHS staff from the same limited pool. Several trusts commented in response to the EPI freedom of information request on the increased pressures caused by the expansion plans under
Future in Mind:
“We believe that this recruitment difficulty is due to all CAMHS services nationally having to recruit and there being a shortage of suitable staff available”.
Responses to our Call for Evidence indicate that recruitment and retention of staff will remain a challenge for delivery of local transformation plans27.
“With new monies being released in England and Wales, Trusts and Health Boards are struggling to fill posts. In addition, there
are recent concerns over recruitment into specialist training in
child and adolescent psychiatry”28.
This risk was also mentioned in a number of local transformation plans:
“The greatest risk to the delivery of the LTP will undoubtedly be the recruitment of staff. Historically Barnsley has struggled to both attract and retain skilled workforce and as neighbouring CCG’s and Local Authorities are likely to be recruiting similarly skilled workforce within the same timeframe this will compound the difficulties”29.
“Doncaster is one of more than 200 CCGs nationally that will all be looking to recruit staff to similar posts. This creates a real pull on an already under established workforce meaning that recruitment will be incredibly difficult. Doncaster due to its levels of deprivation, geography and social difficulties will face an even tougher challenge to recruit especially against the bigger city
CCGs”30.
27 Essex County Council submission to the Education Policy Institute Call for Evidence 2016
28 Royal College of Psychiatrists submission to the Education Policy Institute Call for Evidence 2016
29 Local Transformation Plan for Children and Young People’s Mental Health, Barnsley Clinical Commissioning Group, 2015 http://www. barnsleyccg.nhs.uk/local-transformation-plan-for-children-and-young-peoples-mental-health.htm
Training
Professionals currently employed within services are not always trained in the most up to date and evidence-based treatments. For example, the South Tyneside Local Transformation Plan states:
“The workforce analysis which has been undertaken by NHS England… highlighted concerns about the skill levels of staff who will deliver the therapies described in the NICE guidance. NHS England identified that this is a national issue and will take a number of years via a national training programme to enable the workforce to be appropriately skilled”31.
The Children and Young People’s Increasing Access to Psychological Therapies (CYP IAPT) programme32
has worked with services to improve this situation but a common frustration is that those that have been trained do not always remain within the service. There is, therefore, a mismatch between the supply of appropriately trained staff and the demands to increase capacity and adapt the services being provided.
Services need to be able to offer the right skill-mix to meet the needs of their redesigned services, including staff with the skills to engage young people, while retaining those with the specialist skills needed to deliver high quality, evidence-based interventions:
“Having the right mix of skills in the right places in CAMHS services is crucial to being able to meet the needs of children, young people and families. A mix of skilled professionals is required in order to meet different needs, and these will include (but is not limited to) clinical psychologists, mental health nurses, modality specific therapists, psychiatrists, child psychotherapists, etc. Services that do not include a mix of professional input may find it hard to meet the multitude of needs that children, young
people and their families can present”33.
A comprehensive CAMHS service requires a diverse range of interventions and skills to be available and this requires professionals with a range of competencies. NHS providers can feel limited to who they can appoint to a post because of the way that professionals are regulated by the Health and Care Professions Council. The workforce is currently very reliant on medical and nursing professionals; and qualified youth workers and counsellors are not always included in the workforce or offered good, well-remunerated positions, despite having suitable skills to offer early-intervention support so that young people may not need a medical intervention.
In some areas there are concerns that specialist posts are cut and replaced by generic mental health practitioner roles without the training or clinical governance oversight to deliver the necessary interventions. There is wide variation in the way in which services employ skilled professionals and how their time is allocated. For instance, employing a senior clinician ‘at the front door’ has been shown to help reduce referrals and improve the quality of care offered to young people and their families34 The
Education Policy Institute Commission will explore this further in our final report.
31 South Tyneside Transformation Plan for Children & Young People’s Mental Health and Wellbeing, 2015, http://www.southtynesideccg. nhs.uk/wp-content/uploads/2016/02/South-tyneside-Transformation-plan-CAMHS.pdf
32 The Children and Young People’s Increasing Access to Psychological Therapies Programme is an improvement programme run by NHS England which aims to increase access to evidence-based therapies and improve the quality of treatment offered through staff training
and other support: https://www.england.nhs.uk/mentalhealth/cyp/iapt/
33 The British Psychological Society submission to the Education Policy Institute Call for Evidence 2016
Barriers to Transformation: Funding
The publication of Future in Mind was accompanied by announced investment of £1.25bn of new funding for child and adolescent mental health. With the addition of previous announcements of investment for eating disorders, this means a total of £1.4bn over the five years from 2015-16.
2015-16 investment
While campaigners expected £250m to be made available in 2015-16, the Department of Health stated in August that only £143m would be spent, as providers did not have the capacity to spend any more. A department spokeswoman said the allocation was reduced to ensure the money was properly invested, but that they were fully committed to spending the whole £1.25bn over the course of the Parliament35.
In December 2015, during a debate in the House of Commons, Mental Health Minister Alastair Burt reiterated this commitment: “Will I commit to the £1.25 billion? Yes, I will”36.
Of the £143m for 2015-16, only £75m37 was transferred to local Clinical Commissioning Groups to invest
in frontline services. The rest was spent centrally on the following areas within child and adolescent mental health:
z £21m - Health Education England;
z £15m - Perinatal care (£11m underspend);
z £12m - Improving Access to Psychological Therapies programme;
z £10m - Hospital beds;
z £5m - Administrative costs for NHS England (£4m) and Department of Health (£1m);
z £2m - Improving care for young people in the justice system;
z £2m - Joint programme with Department for Education to improve services in schools;
z £1m - Support for children with learning disabilities in long-term care.
It is not yet clear how much of the £75m has reached service providers, or if any of the funding has been spent on other local priorities. According to the Mental Health Network of provider trusts some had seen “no significant investment” by March 201638. Stephen Dalton, the Network’s Chief Executive,
said:
“It doesn’t seem to have turned into posts on the front line. We are not hearing any reports of any significant investment at a local level around children’s services. Indeed, some services are still experiencing cuts in services.”
The Education Policy Institute’s analysis of local transformation plans uncovered that the funding for 2015-16 was marked as non-recurrent. This means that local areas knew they might only get the funding for one year. This prevented services from investing in new sustainable services in case the money was not there for those services to continue in the following year. This undermined the ability of services to plan effectively for future investment. As one plan stated:
“As we build our system capabilities, we will use the available
funding prior to recurrent commitment to support the delivery of programmes to redefine and integrate a range of primary
35 http://www.bbc.co.uk/news/uk-33740709
36 House of Commons adjournment debate, 3 December 2015, column 608
37 NHS England confirmed to Michael Buchanan, BBC News, 8 March 2016: http://www.bbc.co.uk/news/health-35747167
prevention activities into all our pathways”39.
Another problem was that the investment did not reach local areas until late in the financial year (November/December 2015). This created difficulties for commissioners in planning how it could be best invested and prevented transformative action:
“The ability to spend the full allocation of funding in 2015/16 is going to be difficult, due to the lateness in year that this will be received. In reality this means that we have approximately four to five months to spend a full year’s allocation. This forces us down a route of using existing providers on a short-term basis that may limit innovation.”40
Future funding
For 2016-17, £119m has been included in CCG baseline allocations as part of a total allocation to the Department of Health of £250m. A £30m fund for eating disorders will also be allocated41. NHS England
has also now announced the breakdown in expenditure for each year until 2020-21. In the final year, £214m will be in CCG base allocations, with an additional £30m for eating disorders42.
This investment has, however, been included in the Clinical Commissioning Groups’ baseline allocations. This means that there is no ring-fence and Clinical Commissioning Groups have the freedom to invest it in other local priorities. Given that CCGs expected this to be a separate funding stream, many had not allowed for this expenditure as part of forward planning for their baseline allocations, which puts this investment further at risk. NHS England are planning to seek assurance of the level of expenditure from each CCG but there are unlikely to be severe consequences for CCGs that do not invest it all in children’s mental health, so there is a risk that extra funding could be used to backfill cuts made to other parts of the CAMHS system, rather than providing additional capacity.
Wider funding risks
It is also important to consider this additional investment in the wider context of funding for the whole system.
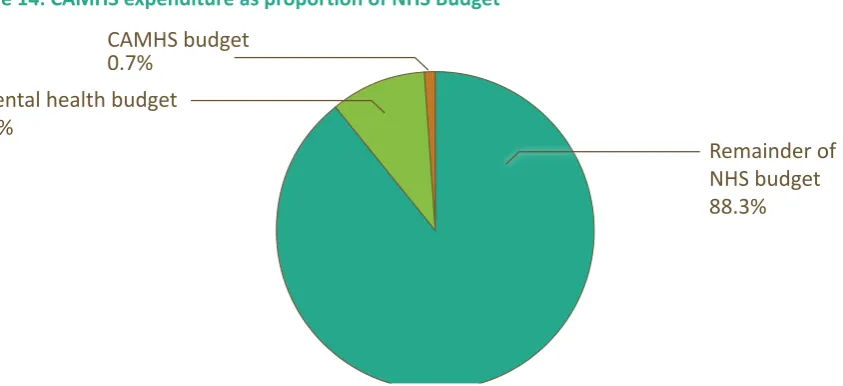
Children’s mental health services have been historically underfunded. In 2012-13 £704m was spent on CAMHS43, the equivalent of about 6 per cent of the total mental health budget, or around 0.7 per cent
of the total NHS budget44.
39 North Lincolnshire Local Transformation Plan: http://www.northlincolnshireccg.nhs.uk/data/uploads/north-lincolnshire-chil-dren-and-young-peoples-emotional-health-and-wellbeing-transformation-plan-master-031215-v3.pdf
40 Doncaster Local Transformation Plan For Children and Young People’s Mental Health and Wellbeing, October 2015:
http://www.doncast-erccg.nhs.uk/about-us/our-values-vision/five-year-commissioning-strategy/mental-health-and-well-being-local-transformation-plan/
41 House of Commons written answer 7 March 2016 http://www.parliament.uk/business/publications/written-questions-answers-state-ments/written-question/Commons/2016-02-23/28160/
42 Implementing the Five Year Forward View for Mental Health, NHS England, July 2016: https://www.england.nhs.uk/wp-content/up-loads/2016/07/fyfv-mh.pdf
43 NB this does not include all investment in children’s mental health, such as through public health or schools budgets. Due to the move to a new system of data collection, figures will not be made available for 2013/14. Figures for 2014/15 will be made available at a later date
44 NHS England evidence to the Health Select Committee enquiry into children’s mental health, 2014
Figure 14: CAMHS expenditure as proportion of NHS Budget
CAMHS budget 0.7%
Mental health budget 11%
Remainder of NHS budget 88.3%
It is very difficult to analyse trends in funding of CAMHS because there is no transparency in the way that data is collected. A parliamentary written answer appears to show a reduction in real terms funding from 2010-11 (£751m) to 2012-13 (£717m)45 but this does not cover all expenditure and is not directly
comparable across years. A freedom of information request by Young Minds in 2015 found that £35m had been cut from services over the previous year46.
There is also widespread concern that reductions in local authority budgets have led to cuts in community mental health services (tier 2). Such reductions are hard to measure as there is little data collected on the availability of these early intervention services. However, the Children’s Society and others found that between 2010-11 and 2015-16 spending by local authorities on early intervention services for children, young people and families has fallen by 31 per cent in real terms. They estimate that the early intervention grant will see a 71 per cent cut by the end of the decade47. Essex County
Council (ECC) has had to save over £520m in the last five years, and told us they anticipate needing to save at least another £300m by 202048. There have also been cuts to youth services, with severe cuts
in some areas49. These wider financial challenges facing local authorities, including specific pressures
and uncertainties about public health and social care budgets, will impact on child and adolescent mental health because these specialist NHS services sit within a wider framework of local authority funded early intervention support. The Care Quality Commission has found that reductions in funding, including to non-NHS services, has contributed to increased waiting times50.
Enfield’s Local Transformation Plan illustrates this risk:
“Finance Investment in CAMHS has been relatively static over recent years, but this is in contrast to many areas where disinvestment of the previously ring fenced LA area based grant and NHS CAMH services has been significant. This strategy is being written at a time of financial challenge for both LBE (London Borough of Enfield) and the CCG… No decision has
45 Real terms 2013/14 prices, House of Commons Written Answer, 16 December 2014 http://www.parliament.uk/business/publications/ written-questions-answers-statements/written-question/Commons/2014-12-16/218865/
46 Community Care Magazine, January 2015, http://www.communitycare.co.uk/2015/01/09/real-terms-funding-cut-childrens-mental-health-services-revealed/
47 Losing in the long run: Trends in early intervention funding, Children’s Society, Action for Children and the National Children’s Bureau, 2016 48 Essex County Council submission to the Education Policy Institute Call for Evidence 2016
49 Youth services in England: Changes and trends in the provision of services November 2014:
http://www.nya.org.uk/wp-content/up-loads/2015/01/Youth-services-in-England-changes-and-trends.pdf
been taken about possible LBE disinvestment in CAMHS but this cannot be discounted”51.
School based counselling is often funded from schools’ own budgets, including through the Pupil Premium. The decision not to increase school budgets in real terms per pupil over the next five years, coupled with additional employment costs, such as the cost of pension changes, means that this funding stream could also be subject to reductions, adding further pressure to the wider CAMHS system. An Education Policy Institute analysis has found that schools may be left with a funding gap of 10.7 per cent in 2020-21, or £4.8bn in 2015-16 prices52.
There have also been reductions in the availability of grant funding for the voluntary sector to address gaps in mainstream service provision. This further undermines the ability of services to support young people at an earlier stage. Given the pressures on budgets, there are often perverse incentives for commissioners to disinvest in early intervention support and adopt a risk-based approach with high thresholds for accessing care, as evidenced in our first report (see section below, on ‘Intervening too late’).
Payment mechanisms
The majority of CAMHS services are currently funded via block contracts. This has historically led to funding problems as block contracts are easy to top slice and often investment does not keep pace with demand. Locally, commissioners and providers have autonomy to decide on the most appropriate payment approaches. Providers and commissioners are gradually moving away from block contracts for adult mental health, and this move is likely to be extended to CAMHS services over the next few years. The development of new payment approaches in child and adolescent services has, however, lagged behind that in adult mental health and these approaches are now being tested over a two-year period53. Acute hospitals (those that deal with physical health problems) are funded by a system
of payment for results, where they are paid for the activity they undertake. There are no plans to introduce such a national pricing mechanism for mental health, and therefore concerns remain that in the context of a limited overall NHS budget and rising cost pressures, funding will continue to be drawn towards the acute hospital sector and away from mental health.
Rising demand
In our first report, the Education Policy Institute’s Commission found that referrals to specialist CAMHS services have risen by 64 per cent between 2012-13 and 2014-15. If this trend continues then commissioners will need to invest heavily simply to keep pace with rising demand unless the transformation process can release enough capacity to match the increased level of need. Local transformation activity to raise awareness and reduce stigma around mental health could further increase the pressure on services, at least in the short term. Local commissioners will need to use available data to track carefully how well investment is matched to local demand.
Barriers to Transformation: Commissioning
As funding for service transformation has been added to the baseline allocation for local CCGs, so