International Global Navigation Satellite Systems Society IGNSS Symposium 2009
Holiday Inn, Surfers Paradise, Qld, Australia 1 - 3 December, 2009
An accuracy assessment of a GPS- enabled
digital camera
Gabriel Scarmana
Spatial Science Officer
Department of Transport and Main Roads, Queensland Government, Australia. [email protected]
ABSTRACT
As the consumer market embraces digital imaging, digital cameras are becoming less expensive while producing higher resolution images. This explosion in camera architecture combined with GPS technology and consumer grade photogrammetric software can provide for noncontact, inexpensive, safe and practical measuring systems which can be used for direct geo-referencing of points of interest and 3D modelling.
This study investigates the accuracy of a measuring scheme based on a GPS-enabled digital camera (Ricoh 500SE) and photogrammetry software (PhotoModeler by Eos Systems Inc). The coordinate values of selected target points determined by this close-range photogrammetric system are compared to the coordinates of the same target points computed using a surveying total station. The target points were not chosen to satisfy the photogrammetry technique but were in fact natural targets part of a noise barrier located along a busy motorway.
The results of this study showed that measurements with the proposed system differed from the more precise surveying measurements by an overall positional accuracy in x, y and z of 0.5 m. This expected accuracy result was essentially a function of the accuracy of the GPS unit and when a more accurate version becomes available and is incorporated with the camera, the accuracy should reduce to that approaching a total station. The efficiency of the GPS-enabled camera system was the important point disclosed by this study.
KEYWORDS: GPS, digital cameras, photogrammetry.
1. INTRODUCTION
Mapping sensors are typically digital cameras, but may include additional sensors such as laser scanners, multi-spectral scanners, or radar.
Based on the measurements from the mapping sensors, the location of features of interest relative to the platform on which they are mounted can be estimated either by direct range measurements - when laser scanners are employed - or indirectly, by space intersection, where 3D coordinates of the points are established by the intersection of two ray paths using stereo images. If the carrying platform is, in turn, directly geo-referenced by the navigation component (i.e. GPS), then the absolute position of the mapped features can be determined (Novak, 1995).
In this context, this paper evaluates the capability of close-range terrestrial photogrammetry as an auxiliary measurement and mapping tool for routine noise barrier inspection and documentation. The proposed measuring scheme is also conceived to acquire 3D spatial information using stereo images taken with a GPS-enabled digital camera. The information obtained from these measurements can then be used in an office environment so as to interact within GIS, visualization or CAD programs thereby assisting data validation and documentation.
Controlled field experiments are described to demonstrate the potential of the system. These experiments are not intended to be exhaustive, but they give useful results that can be taken as indicators of the accuracy to be expected from the proposed methodology. This was ascertained by comparing statistically the coordinate values obtained from the two photogrammetric experimentations and the values of the coordinates for the same target points (located on the noise barrier structure) measured with what was considered to be more accurate land surveying techniques. The surveying techniques considered here made use of sophisticated electronic total stations with all measurements linked to stable and geo-referenced control points.
THE GPS-ENABLED DIGITAL CAMERA
The camera model that was used in the experiments was the Ricoh 500SE (Figure 1). This digital camera has a solid state CCD (Charged Coupled Device) image sensor of 8 megapixels. It automatically embeds GPS coordinates with captured images and can transfer pictures and data to a variety of mapping softwares. The 500SE has a large LCD screen and provides precise real-time WGS-84 position information derived from either the camera’s detachable GPS module (+/- 3m nominal positional accuracy) or from external GPS devices.
In addition to storing GPS data in image and video, the 500SE provides a user-defined data dictionary for tagging the media with workflow-related information. This data can be converted to attributes in any GIS system and may be automatically imprinted on the images. The Ricoh 500SE can also incorporate a compass module (SE-3 GPS, +/- 20 nominal accuracy). Once fitted to the 500SE, the SE-3D compass module provides direction (azimuth) information on the camera's LCD screen and embeds this data into images as they are captured thus indicating the direction the camera was facing at the time of taking an image. Additional information on this state-of-the-art camera and detailed specifications can be found in www.ricoh.com.
[image:2.612.215.399.570.697.2]
2. THE PHOTOGRAMMETRIC SOFTWARE
A photogrammetric software package may include some or all of the following basic characteristics: (1) handling of image display; (2) determination of orientation; (3) transformation of coordinates; (4) image processing functions; (5) measurement tools; and (6) ortho-image production and visualization. The theory of photogrammetry is not discussed in this paper but is available in Wolf and Dewitt (2000).
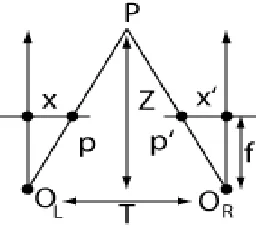
As a general overview it may be sufficient to say that in photogrammetry, depth (3D) measurements can be defined using a pair of camera sensors. The technology lies in the fact that a single point in 3D space projects to a pair of unique image locations when observed by at least two cameras. This can be seen in the diagram in Figure 2 where point P in space projects to a unique location OL in the left image and OR in the right image. If it is possible to locate these corresponding points in the camera images, then the 3D location of the physical point P can be computed by triangulation.
PhotoModeler is a Windows software package for measuring and modelling real world objects and scenes through the use of photographs. Developed by Eos Systems Inc. PhotoModeler is based on the science of photogrammetry, which means to measure from photographs. PhotoModeler Pro was selected for this research due to its user-friendliness, powerful modelling and measurement features, and inexpensive price. This low-cost software has been used in a broad range of engineering and non-engineering applications and provides non-photogrammetrists the means by which to accurately model and measure a physical object from digital images. The 3-D models can be exported in .DXF format to an AutoCAD or MapInfo environment.
[image:3.612.237.365.421.535.2]In PhotoModeler, a 3D object model consists primarily of a set of spatial points, edges, and/or curves. Surfaces and textures can later be added to the basic wire frame model to create a realistic solid model. Measurements of distances between two points, lines and points, points and surfaces, etc. can be made using the measurement tool. Another important feature of PhotoModeler is its capability to export ortho-photos. An ortho-photo or ortho-photograph is a photograph that has been geometrically corrected ("ortho-rectified") for scale and distortions.
Fig. 2: The stereo vision model.
3. CALIBRATION OF CAMERA-LENS SYSTEM
In order to triangulate the location of a point, accurate estimates of camera external geometry (position and orientation of each camera), and internal geometry (lens distortion, focal lengths, optical centres must be calculated. This is necessary to relate camera information expressed in pixels to the external world coordinate system expressed in metres. This process is referred to as camera calibration.
principal point coordinates (the intersection of the optical axis with the image sensor); principal distance (the distance from the centre of the lens to the principal point); lens distortion characteristics (radial and tangential); and sensor format size (pixel size and number).
The calibration process takes into consideration the actual extent and dimensions of the project and the results are saved and later used for photogrammetric analysis. Self-calibration of the camera could have also been performed in PhotoModeler, which would have provided for higher measurement accuracy. In a self-calibration, camera parameters are determined based on points measured on the actual object; however, self-calibration was not used in this proof-of-concept study given that many more artificial targets would have been required (Fryer, 1996).
4. NOISE BARRIER MEASUREMENT STUDY
Noise barriers are solid obstructions usually built between the highway and the homes along a highway. Noise barriers reduce the sound which enters a community from a busy highway by absorbing the sound, transmitting it, reflecting it back across the highway, or forcing it to take a longer path over and around the barrier. A noise barrier must be tall enough and long enough to block the view of a highway from the area that is to be protected, the “receiver”. Figure 3 illustrates the scheme of absorptive noise barrier (D.M.R., 2008).
[image:4.612.107.509.371.483.2]They can be constructed from earth, concrete, masonry, wood, metal, and other materials. To effectively reduce sound transmission through the barrier, the material chosen must be rigid and sufficiently dense (at least 20 kilograms/square meter). All noise barrier material types are equally effective acoustically if they have this density. They are usually limited to eight metres in height for structural and aesthetic reasons.
Fig.3: Diagram showing an absorptive metal noise barrier after D.M.R (2008).
Noise barriers require regular inspections during their service life where current structural conditions can be assessed, future problems anticipated, and needed maintenance or expansion identified. During a routine inspection, field measurements and visual observations are made by a qualified inspector to evaluate the physical condition of these structures (referred to as the condition rating). Barrier dimensions commonly measured by the inspectors and during as-built surveys include the maximum span length, overall structure length, and stability measurements.
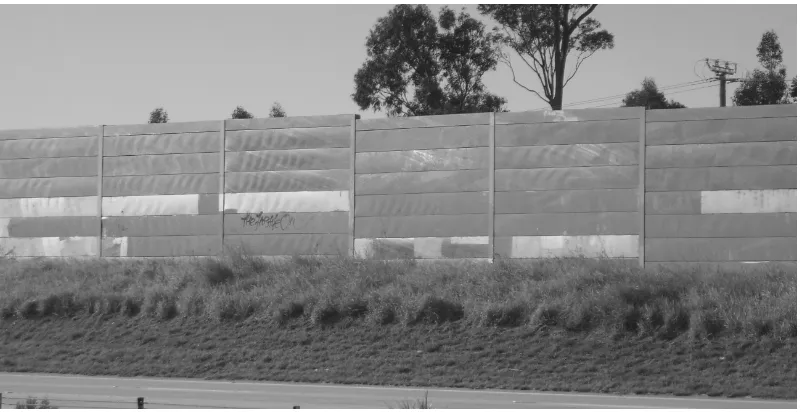
Fig. 4: A section of the NB12 noise barrier along the M1 Motorway.
5. FIELD TESTS
In a first test, 8 images were taken from ground level (60 meters away from the structure on the other side of the highway) along the west side of a section (approximately 100 metres long) with the camera zoomed to a focal length of 7.6mm. The images were taken so as to include seventy natural targets and 3 geo-referenced control points. Examples of natural targets that were utilized included the sharp corners on the noise barrier, intersections of the panels with supportive posts, contrasting and discoloured patches on the concrete surfaces and bolts on the guardrails located near the barrier.
The real dimensions of objects in the photographs cannot be determined without a real-world coordinate system with scale. To establish the measurement scale and also the correct orientation of the measuring scheme the three geo-referenced control target points were placed approximately 30 metres apart from each other along the section of the noise barrier being investigated.
The coordinates of these three control points and the natural targets were first computed from measurement taken with a precise surveying Total Station instrument. The total station used in this experiment was the Leica TC2002. This instrument is designed for work requiring a high angular accuracy (+/- 2 arc seconds) and a high distance measuring accuracy (+/- 5.0 mm in 300 m). The built-in laser system measures distance by emittbuilt-ing laser pulses that reflect off the targets and control points. As a result of the consistency of positional accuracy of the Leica TC2002, and for the purposes of this study, the coordinates values obtained from this precise instrument were considered as errorless and thereby used to quantify the accuracy of the results obtained from the photogrammetric process.
Note that in this initial test the entire measuring scheme, scaling and computations were carried out using only the camera in combination with the photogrammetric software. All measurements were linked to the three geo-referenced control points that were in turn related to stable and accurate Permanent Survey Marks (PSM) located in the vicinity of the noise barrier. For mapping and comparative purposes the x, y and z coordinates of the natural targets and the three control points were defined in the GDA94 (Geocentric Datum Australia 1994, zone 56) projection so as to be compatible with the mapping framework adopted by DMR (Department of Main Roads) within the Queensland South East Region.
into PhotoModeler and the images were re-processed to extract the coordinates of the 70 natural targets.
In this second experiment the camera position at each of the observing (or camera) stations was defined as the average of 20 GPS fixings from the GPS receiver unit using the signals from at least six satellites. This relatively time consuming procedure was adopted in this testing phase to improve positional accuracy of the camera/image location. In most cases statistical positional accuracies of approximately +/- 0.6 metres were achieved as compared with the nominal positional accuracy of the camera’s GPS receiver (+/- 3m, 68% confidence level).
6. COORDINATES MEASUREMENTS AND COMPARISON
[image:6.612.93.521.290.568.2]The identification of the 70 natural targets on the 6 overlapping images taken of the noise barrier was accomplished using the sub-pixel marking tool in PhotoModeler. The referencing tool was used to ensure that these target points were labeled consistently. Figure 5 illustrates the location and identification of some of these natural target points. Once all the targets and the three control points were marked and referenced in PhotoModeler it was necessary to supply some geometric information to allow the software to scale and orient the model to the required coordinate system.
Fig. 5: Natural targets points are referenced in two images with PhotoModeler.
As mentioned earlier, the scaling and orientation of the barrier was carried out using the 3D coordinates of the three references or control points computed via the Leica TC2002. The PhotoModeler “Control Points” facility allows the use of existing reference grid points to tie local measurements into a project’s global coordinate system. These control points function to scale and align the model created by PhotoModeler, so that the coordinate values can be directly compared with the coordinates determined by the TC2002. The differences between the PhotoModeler coordinates and the TC2002 coordinates for the first test are summarized in Table 1.
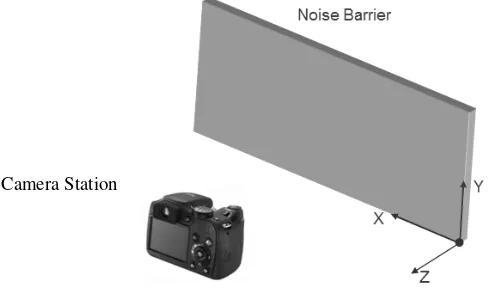
axis was generally perpendicular to the plane of the images. Although this was not thoroughly ascertained, the use of 6 camera stations, all at ground level, and with limited rotation most likely limited the accuracy obtainable by PhotoModeler (Fraser, 1996). If additional converging images were taken, the PhotoModeler coordinates would most likely be closer to the TC2002 coordinates.
Fig. 6: Diagram showing coordinate axes direction.
Table 2 gives the results obtained in the second test. The table summarises the R.M.S. (Root Mean Square) error of the differences of coordinates determined by the total station and those determined using only the parameters obtained from the Ricoh 500SE unit without using control points. Similar to the results of Table 1 the y coordinates generated weaker accuracies as compared with those generated in the x and z direction.
Direction Min. Diff. Max. Diff. Mean Diff. R.M.S.
x (along the barrier) 20 mm 25 mm 16 mm 17 mm
y (across the barrier) 29 mm 32 mm 28 mm 30 mm
z (vertical) 15 mm 24 mm 14 mm 19 mm
Tab. 1: Accuracy results for the first test using control target points.
Direction Min. Diff. Max. Diff. Mean Diff R.M.S.
x (along the barrier) 370 mm 430 mm 397 mm 400 mm y (across the barrier) 390 mm 630 mm 544 mm 550 mm
z (vertical) 387 mm 500 mm 391 mm 477 mm
Tab. 2: Accuracy results of the second test using the camera/GPS/compass combination.
The substantial deterioration in positional accuracy obtained from the results of this second test was expected as the results directly depended on the precision of the camera’s GPS receiver and the resolution of the camera. How each component precisely influences the final positional accuracy is a subject of ongoing research and improvements in this area are forthcoming.
7. CONCLUSIONS
Notable findings encountered in this study are:
x A digital camera and a set of target points distributed over a 3D structure can be used to create images that PhotoModeler can employ to determine 3D measurements of such structure. In a first test, which used geo-referenced control points to scale and orient all dimensions, the overall positional
[image:7.612.144.390.143.290.2]accuracy achieved by the proposed system was in the order of +/-30 mm which is suitable for many applications in architecture, building models and in some industrial measurement applications. Further studies with additional camera positions, increased resolution and improved camera angles would be useful to test the effect they may have on improving accuracy.
x The speed and convenience of the imaging process as compared with measuring coordinates with a Total Station are very attractive. As camera resolutions increase, the accuracy of low-cost photogrammetry will increase and be more widely utilized.
x The two studies carried out in this investigation showed that photogrammetry is capable of providing the measurement information associated with routine noise barrier inspection. Furthermore, photogrammetric measurements were completed by means of site photography with minimal contact with the specific sections of the barrier. All measurements and data processing were performed in an office environment using a personal computer and the PhotoModeler software. The total cost of the basic photogrammetric system used in this research, including the Ricoh 500SE and the non-industrial photogrammetric software, was less than AU$2500.
x There exist several technology issues that still challenge a more generalized utilization of the Ricoh 500SE GPS camera as a stand-alone measuring system for the purpose of measuring noise barriers. Ideally the imaging sensor should have a higher resolution and the GPS receiver should produce improved positional accuracies. However, the preliminary tests carried out until now demonstrated great potential as well as versatility. Indeed, the system could also be used to remotely geo-reference dynamic, static and/or difficult to reach vertical or occluded objects from vehicles such as cars, helicopters and boats.
REFERENCES
Blumer, J. P. 9 (2004). Tele-Photogrammetry: Providing Photogrammetric Services For Mobile Telecommunication Users. XXth ISPRS Congress, 12-23 July Istanbul, Turkey. Commission 5. D.M.R. (2008). Road Traffic Noise management: Code of Practice. Chapter 2. Description of Road Traffic Noise. Department of Main Roads. Queensland. Australia. January.
Fiani M. and Pistillo P. (2004). A Low-Cost MMS Integrating GPS, Digital Compass and a Camera to Direct Geo-referencing of Digital Images. The International Archives of the Photogrammetry, Remote sensing and Spatial Information Sciences, Vol. 34, Part XXX.
Fraser C. S. (1996). Network design. In: Close Range Photogrammetry and Machine Vision. Edited by K. B. Atkinson. Whittles Publishing. Caithness, KW5 6DW, Scotland, UK.
Fryer, J. G. (1996). Camera calibration. In: Close range Photogrammetry and machine Vision. Edited by K. B. Atkinson. Whittles Publishing. Caithness, KW5 6DW, Scotland, UK.
Ladetto Q. and Merminond B. (2002). In Step with INS – Navigation for the Blind, Tracking Emergency Crews. GPS World - October. www.gpsworld.com.
Novak, K. (1995). Mobile Mapping Technology for GIS Data. In : Collection. PE&RS, Vol. 61, N. 5, pp. N°. 493-501.