Traffic modelling in system boundary expansion of road
pavement life cycle assessment
Fabio Galatioto
a,⇑, Yue Huang
b, Tony Parry
c, Roger Bird
a, Margaret Bell
a aSchool of Civil Engineering and Geosciences, Newcastle University, Claremont Road, NE1 7RU Newcastle upon Tyne, United Kingdom b
School of the Built Environment, Liverpool John Moores University, Peter Jost Enterprise Centre, Byrom Street, L3 3AF Liverpool, United Kingdom c
Nottingham Transportation Engineering Centre, University of Nottingham, University Park, NG7 2RD Nottingham, United Kingdom
a r t i c l e
i n f o
Article history:
Available online 12 March 2015
Keywords:
Life cycle assessment System boundary expansion Road works
Microsimulation Pollutant emissions Sensitivity analysis
a b s t r a c t
This paper uses a case study of a UK inter-urban road, to explore the impact of extending the system boundary of road pavement life cycle assessment (LCA) to include increased traffic emissions due to delays during maintenance. Some previous studies have attempted this but have been limited to hypothetical scenarios or simplified traffic modelling, with no validation or sensitivity analysis. In this study, micro-simulation modelling of traffic was used to estimate emissions caused by delays at road works, for several traffic management options. The emissions were compared to those created by the maintenance operation, estimated using an LCA model. In this case study, the extra traffic emissions caused by delays at road works are relatively small, compared to those from the maintenance process, except for hydrocarbon emissions. However, they are generally close to, or above, the materiality threshold recommended in PAS2050 for estimating carbon footprints, and reach 5–10% when traffic flow levels are increased (hypothetically) or when traffic management is imposed outside times of lowest traffic flow. It is recommended, therefore, that emissions due to traffic disruption at road works should be included within the system boundary of road pavement LCA and carbon footprint studies and should be considered in developing guidelines for environmental product declarations of road pavement maintenance products and services.
Ó2015 The Authors. Published by Elsevier Ltd. This is an open access article under the CC BY license (http://creativecommons.org/licenses/by/4.0/).
Introduction
The life cycle assessment (LCA) of road pavements has been developing since the 1990s (Hakkinen and Makela, 1996; Stripple, 2001). The life cycle inventory of pavement materials has been researched thoroughly by material associations (Marceau et al., 2007; Eurobitume, 2011), compared to early studies of energy consumption only (Zapata and Gambatese, 2005). The work is strengthened by including recycled and secondary materials (Mroueh et al., 2001; Birgisdóttir et al., 2006), a growing practice in response to stakeholder calls for sustainable construction. More recent LCA research is focused on the methodological choices, for instance allocation (Chen et al., 2010; Sayagh et al., 2010; Huang et al., 2013), and comparison of design options (Cross et al., 2011; Santero et al., 2011a).
http://dx.doi.org/10.1016/j.trd.2015.02.007
1361-9209/Ó2015 The Authors. Published by Elsevier Ltd.
This is an open access article under the CC BY license (http://creativecommons.org/licenses/by/4.0/).
⇑Corresponding author at: Devonshire Building, Kensington Terrace – Newcastle University, NE1 7RU Newcastle upon Tyne, United Kingdom. Tel.: +44 0 191 208 6329; fax: +44 0 191 208 6502.
E-mail addresses:[email protected](F. Galatioto),[email protected](Y. Huang),[email protected](T. Parry),[email protected]
(R. Bird),[email protected](M. Bell).
Contents lists available atScienceDirect
Transportation Research Part D
It has been noted in the earliest of LCA research that traffic emissions in the use phase can account for the majority of emissions in the pavement life cycle (Piantanakulchai et al., 1999; Highways Agency, 2003). The proportion has been quan-tified by recent European research to be in the range of 93–99% (ECRPD, 2010) or even higher (Milachowski et al., 2011). Because vehicle fuel consumption is largely determined by many factors other than pavement performance (Hammarstrom et al., 2009; Lepert and Brillet, 2009), traffic emissions are typically excluded from pavement LCA. This is a limitation, in that pavement maintenance leads not only to additional construction activities, but queuing or diversion of traffic at road works. A few studies have investigated the additional emissions, but have been limited to simplified traffic modelling (Huang et al., 2009a) or hypothetical scenarios (Santero et al., 2011b), with no validation or sensitivity check on the traffic flow or traffic management (TM) options.
These problems are related to system boundary settings. Traffic emissions under the free flow state can be estimated by multiplying the length of journey with average emission factors (e.g., kg CO2per vehicle kilometre), typically tied to the age,
engine size and fuel type of the vehicles (DEFRA, 2011), or they can be derived from commercial databases (e.g., Ecoinvent) (Milachowski et al., 2011). Managed traffic flows are better modelled in micro-simulation coupled with an instantaneous emissions model, because this type of tool is able to relate the emission rates to vehicle operation (e.g., driving pattern, speed profile) during a series of short time steps (Barlow et al., 2007), representing the restricted flow or congestion that may be caused by road works. There remains a need to explore system boundary expansion of road pavement LCA to understand the importance of this part of the pavement lifecycle.
Using a case study of a UK inter-urban road, this research investigates the emissions from traffic disrupted during pave-ment maintenance, with various TM options, compared to those from the construction and maintenance activities.
Case study and LCA model
System boundary
The case study site is located in Lincolnshire on the A17 between Sutton Bridge and Kings Lynn, an inter-urban road in the UK Midlands; with length 720 m including 200 m dual (22 m width) and 520 m single (11 m width) carriageway. While the results of such studies will vary widely, due to the very wide range of traffic flows on different roads, this site was chosen due to the appropriate level of construction and traffic flow data available at a location representative of many similar roads, with a variety of potential TM options.
The system boundary of the pavement construction and maintenance LCA is illustrated inFig. 1. Construction data on pavement layout and thickness was provided by Lincolnshire County Council. The pavement consisted of 40 mm surface course, 60 mm binder course and 200 mm base, all courses being made with bitumen bound materials (asphalt). Material recipes for asphalt mixtures were based on UK asphalt material specification in compliance with BS EN 13108 (BSI, 2010). Blast furnace slag (BFS), a by-product from the iron making process, was used as aggregates in DBM base (200 mm thick) and binder (60 mm thick) courses, and as coarse aggregates (>2 mm) in HRA surface course (40 mm thick). Assumptions are made on the distance of transport and payload of the trucks. Quarry aggregates and BFS are transported for 50 km, and bitumen for 200 km, to the mixing plant using 20–28 t truck. New asphalt and milled recycled asphalt pavement (RAP) are transported for 80 km to site and stockpile, respectively, using 20–28 t truck. Allocation of environmental burdens of iron making to BFS has followed the zero impact route1recommended by a UK industry standard tool for asphalt carbon footprinting (Wayman et al., 2011). No processing energy and emissions were allocated to BFS before transport to the asphalt plant. The Eurobitume 2011 inventory, which is based on a mixed allocation by mass and economic value (Eurobitume, 2011) between oil refinery products, was used for bitumen. Asphalt production followed the ‘cut-off’ method for end-of-life (EOL) scenario,2 in compliance with a UK public specification for measuring greenhouse gas emissions of products (BSI, 2011). The impact of the above allocation methods on the LCA results has been reported (Spray et al., 2012) and thus was not investigated in this study. Functional unit
Original construction was undertaken in 1989. This case study starts in 2009, when a major rehabilitation was under-taken. Twenty years was selected as the analysis period to be consistent with the design life of the 2009 rehabilitation. In other LCA studies, justification of maintenance strategy will need to be provided. This rehabilitation involves milling out of 200 mm of the old asphalt pavement and replacing with inlay of new asphalt mixtures. The rehabilitation is modelled using real project data, except that the asphalt mix design uses BSI guide values, to eliminate the variables between suppliers. All removed materials are assumed stockpiled for reuse. The functional unit (FU) is defined as the carriageway pavement area of the rehabilitation site, i.e., 520 m single carriageway (11 m width) and 200 m dual carriageway (22 m width) bearing the design traffic for 20 years, which includes the rehabilitation at end of year 20. The modelling was carried out in SimaPro using sub-licensed databases, supported by data from contractors and UK specification. The
1
Alternatively, allocation can be made based on mass or economic value of the outputs. 2
FU after expansion of the system boundary includes the additional emissions from traffic which is affected by the road works.
During rehabilitation a reinforcement system was used, which is a mainly glass fibre textile (GlasGrid™) overlaid by 2 kg/m2of polymer modified bitumen emulsion, to reduce crack propagation from lower layers. This has additional benefits
of reducing the required asphalt thickness for future rehabilitation to 150 mm, and less excavation waste, at the expense of additional manufacture and installation of the reinforcement. The reduction of asphalt thickness for future maintenance was recommended based on an analytical pavement design. A LCA of this reinforcement system was, therefore, included as part of this case study.
GlasGrid
Primary data was obtained from the manufacturer. GlasGrid is made of 72.9% glass fibre, 2.1% polyester fibre, 25.0% acrylic coating and trace content (<0.1%) of carbon black. Raw materials are transported for an average distance of 2000 km using 32 t truck to a manufacturing plant in the USA, where natural gas (0.014 m3) and electricity (0.017 kW h)
are consumed in producing 1 m2of GlasGrid. The product is then shipped using ocean freighter for 5000 km to UK and
50 km using 32 t truck from port to site. The polymer modified bitumen emulsion was transported for 200 km using 32 t truck. The unit inventory results (CO2e per 1 m2 GlasGrid) calculated using manufacturer’s data, and data in the
[image:3.544.72.468.52.238.2]Ecoinvent database, are presented inTable 1for comparison.
Table 1indicates that the cradle-to-gate CO2e of GlasGrid provided by the manufacturer is 0.75 kg/m2, in other words
37.0% less than 1.19 kg/m2as calculated using Ecoinvent default data (shaded). The Ecoinvent data for relevant materials System boundary
T denotes transport A denotes allocation
A
A
Iron production
Petroleum refinery
T T
T T T T
Fine aggregates
BFS aggregates
Bitumen
Limestone filler
Hot mix asphalt production
GlasGrid installation PMB emulsion
production
T
Polyester fibre
Glass fibre Acrylic coating Carbon black
T T T T
Stockpile for reuse
T
Asphalt paving and rolling
Pavement milling
GlasGrid production
[image:3.544.37.514.516.678.2]Fig. 1.System boundary of A17 major rehabilitation with pavement reinforcement.
Table 1
was global average for year 2000; the data from materials supplier was obtained from recent literature and TEAMÒ
(commercial LCA software). Interestingly, the percentages that activity groups account for were similar between the two data sources, i.e., 84–88% for materials embodied, and 9–12% for transport and about 4% for manufacture.
Traffic modelling
Microscopic models are considered to be the most accurate and versatile analysis tools to simulate non-free flow traffic states (i.e., busy and congested). This is because micro-simulation can replicate individual vehicle movements along roads and through junctions in a network. Road maintenance, as in this A17 case study, is always carried out under TM suitable to the location and layout of the road. Off peak lane closures with traffic light control are often used in these circumstances. In some cases, diversion of traffic to adjacent roads is used instead, and the road completely closed. The micro-simulation model AIMSUN (Advanced Interactive Microscopic Simulator for Urban and Non-Urban Networks) was used in this study to evaluate the emissions generated by traffic under different TM measures. More specifically, to quantify the effect of adjusting the timing of lane closure and compare to the impact of diversion.
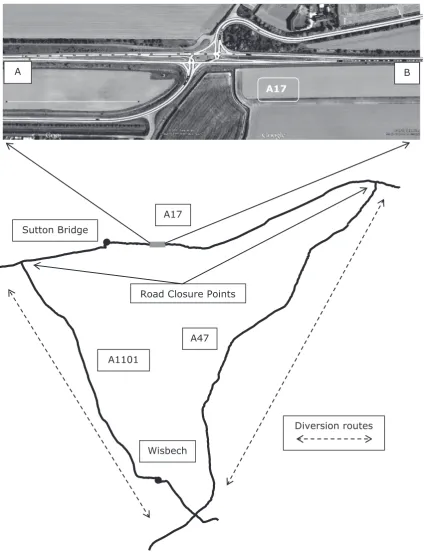
AIMSUN was selected because of its ability to model the road network geometry, the behaviour of individual vehicles in response to traffic and signal controls (pre-timed and actuated), and its easy-to-use graphical interface. Also, a particular feature of AIMSUN is its ability to capture the empirical evidence of changes in driver behaviour depending on local circumstances, e.g., acceptance of speed limits, influence of gradients, driver interaction while travelling in adjacent lanes. An AIMSUN micro-simulation model was built for both the site located in Lincolnshire on the A17, and the wider road net-work highlighted inFig. 2.
Base Case scenario
To model the Base Case scenario, with no TM, weekly data extracted from the automatic traffic count (ATC) by Lincolnshire County Council were used, specifically the hourly traffic flow data for the period between May and August 2010 including vehicle class and speed on a daily basis. The model was built to include road layouts, lane allocations, signal junctions, stop-lines, etc. Statistical analyses were used to produce typical flow profiles for each day of the week in order to identify the peak and inter-peak periods, thus to identify when is the best time and day to carry out the planned road works. Traffic emissions were calculated using the AIMSUN embedded instantaneous emissions model; four vehicle types have been simulated (i.e., car petrol; car diesel; Light Goods Vehicle (LGV) and Heavy Goods Vehicle (HGV)) according to the data available on fleet composition. The use of the four vehicle types is in line with the guidance fromNAEI (2013)which assumes a basic fleet split according to six national vehicle types namely Car, LGV, HGV (Rigid, Artic), Bus, Motorcycle and London Taxi and three different types of roads: urban, rural and motorway. Within the paper, emissions for rural road type have been considered and Bus, Motorcycle and London Taxi vehicle types were assumed to be zero or close to zero, such as for motorcycle (<0.5%). For the car type, the extra distinction in diesel and petrol was made to improve the quantification of the impact made by different pollutant emissions. In fact, diesel vehicles traditionally are higher emitters of oxides of nitrogen (NOx) and particulate matters (PMs), while petrol cars are higher emitters of hydrocarbons (HC) and carbon dioxide
(CO2). The origin–destination (O–D) matrix of trips into, within and outside the modelled area at an hourly resolution was
generated to be consistent with the traffic flows provided.
Road works scenario
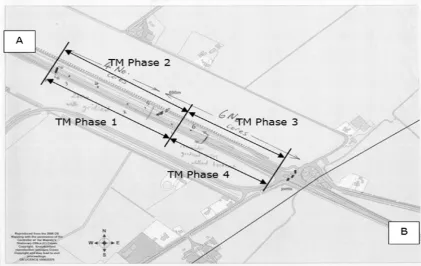
The overnight TM simulation consisted of four shifts (phases) in three nights with temporary speed limits on site, see
Fig. 3. In phases 1 and 2 (night 1), work was carried out on the 400 m single carriageway west of the scheme in both direc-tions. Phase 3 (night 2) dealt with the rest of the scheme (320 m) eastbound including the junction approach; Phase 4 (night 3) dealt with the rest of the scheme (320 m) westbound. The simulation was conducted with two times for the start of TM from 18:00 and from 19:30. The 19:30 TM start is believed to be more practical, as at this time the traffic flows have decreased substantially. The impact of the earlier closure with a traffic flow of about 600 veh/h associated with the 18:00–19:00 period, was estimated to explore the importance of this decision.
The 24 h TM proposal was the closure of the length of road between A and B with no access to non-work traffic (see
Fig. 2). Instead, closure points will be set up on the primary road as indicated inFig. 2with traffic diversion onto the adjacent road network. The rationale is to complete the work in a single shift when traffic along the ‘triangle’ will be least affected. In this case an analysis of the hourly traffic flow profile over the entire week has been performed and the best 12 h and 24 h time windows have been chosen appropriately (seeFig. 4), from 13:00 on Saturday afternoon for 24 h and from 19:00 on
A17
A17
A47
A1101
Sutton Bridge
Wisbech
Road Closure Points
Diversion routes
[image:5.544.58.483.51.605.2]A
B
Saturday evening for 12 h closure. The potential construction benefits include resource efficiency and staff safety.3 The impact on additional emissions is modelled and compared with multiple-phased lane closure shown diagrammatically inFig. 3. Finally, in order to assess the sensitivity to potential traffic flow variation over the closure period of the first scenario, namely the temporary traffic signals with overnight lane closure for three consecutive nights, the traffic flows along the A17 corridor have been increased by 10%, 20% and 30% of the Base Case hourly flows, limiting the maximum traffic flow on each link to a realistic level of 650 veh/h.
Results and discussion
Results of the pavement construction and maintenance LCA
Table 2presents the LCA results for (1) the 2009 rehabilitation, which replaced 200 mm old pavement with new asphalt and laid a Geogrid at a depth of 150 mm, and (2) future rehabilitation at year 20 where the Geogrid remained in place and only the 150 mm asphalt above it was replaced.
Results of CO2e are presented per m2pavement area and multiplied by the area to give the whole case study results, i.e., a
[image:6.544.64.486.55.321.2] [image:6.544.61.487.359.475.2]total pavement area of 10,120 m2. The results have not been presented broken down into different construction phases Fig. 3.Phased lane closure in A17 traffic management.
Fig. 4.Weekly traffic flow indicating 24 h and 12 h road closure times.
3
(materials production, paving, etc.), although this has been discussed by others (Huang et al., 2009b; Zapata and Gambatese, 2005).
Results of traffic simulation
Fig. 5(showing NOxemissions as an example) indicates that the timing of TM could have a significant effect on emissions
from disrupted traffic in all shifts (phases 1–4), assuming 2010 National fleet composition and the five emissions factors developed in a previous study (Galatioto et al., 2012) representing the five major pollutant emissions according to the National Atmospheric Emissions Inventory (NAEI). The graph clearly shows that the effect would be more pronounced (from 1.5 to 8 times higher) when the road work was carried out near the junction (phases 3 and 4). Also,Fig. 5suggests that for phases 3 and 4 TM implementation after 23:00 would be best, when traffic flows fall sharply, as opposed to 21:00 for phases 1 and 2. In practice however, the start of TM is likely to be earlier (as modelled in this case study from 19:30) because priority is given to ensure the completion of treatment and safety of the workforce is guaranteed within the night period.
Simulation of the different scenarios described in Sections ‘Base Case scenario and Road works scenario’ was carried out. A range of traffic and emission outputs have been generated from the AIMSUN model, including speed, queue length, number of stops, travel delay and emissions (CO2, CO, NOx, HC and PM). Selected outputs are presented inTable 3. The same five
pollutants are given from the rehabilitation LCA for comparison.
Table 3indicates that the additional traffic emissions due to road works:
1. With start at 19:30 and very low flows overnight, were negligible (i.e., <1% for NOx, PM and CO2) compared to the
rehabilitation emissions. While carbon monoxide was 1.2%, hydrocarbon was more significant at 3.7%.
2. With start of road works at 18:00, the additional traffic emissions rose to more than 3% of rehabilitation emissions with the exception of PM (1.2%); hydrocarbon increased to nearly 30%. This suggests that if a road closure is needed, the additional emissions will become significant when the traffic flow is high (e.g., 600 veh/h).
[image:7.544.36.503.77.135.2]3. When non-work traffic was diverted to adjacent roads allowing the road works to be carried out in one single shift, additional traffic emissions varied from 1.4% (PM) to 24.5% (hydrocarbon), but consistently higher than the overnight lane closure options.
Fig. 5.Vehicle NOxemission profiles in A17 traffic management. Table 2
Rehabilitation CO2e.
Life cycle stage Unit
kg CO2e per m2 t CO2e case study t CO2e per km
(1) 2009 Rehabilitation 42.5 430.1 597.4
(2) Year 20 rehabilitation 38.3 387.6 538.3
[image:7.544.84.454.479.676.2]Sensitivity to Flow Variation Analysis
In order to assess the sensitivity of the overnight lane closure to changes in flow, simulation of traffic flow at three dif-ferent additional increments (10%, 20% and 30%) of flows for each road closure (start 18:00 and 19:30) have been carried out.
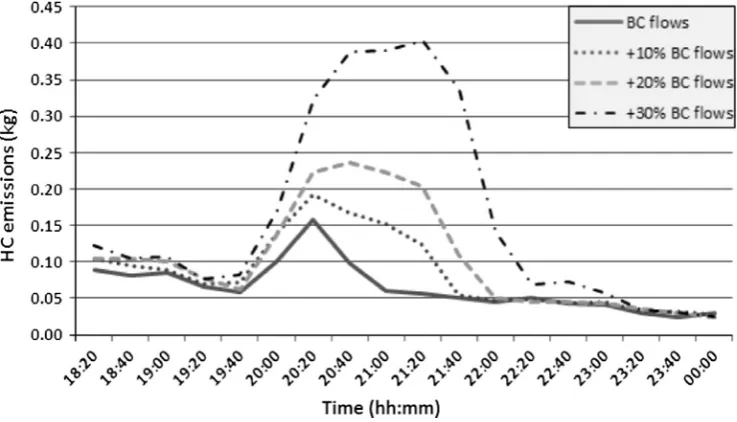
Fig. 6presents the impact on HC emissions in kg for closure starting at 19:30 and during the period 18:00–24:00, when the emissions are more significant. The increase in traffic flow produces an increase in emissions during the closure and the duration of the congestion in the network becomes extended.
The results of the sensitivity analysis are presented inTable 4where the emissions for each scenario have been compared with the rehabilitation emissions. The average extra travel time incurred traversing the diversion route to circumvent the roadwork section ranges from 10 to 25 min for the 10% and 30% traffic increase respectively. The travel time without road works along the longer route via Wisbech, without considering extra travel time due to urban traffic and local traffic lights, is 44 min for cars and 51 for HGVs, while following the A17 shorter route is 22 and 25 min respectively. This means that during the road works the maximum travel time for a 30% increase in traffic would be 47 (25 + 22) and 50 (25 + 25) min for cars and HGVs respectively, thus it is reasonable to suggest that no or a small percentage of drivers in the scenario with 30% additional traffic will opt for the longer diversionary route.
[image:8.544.39.519.77.213.2]Highlighted in bold inTable 4are those scenarios when pollutant emissions from traffic relative to rehabilitation are close to 10% or higher, while for carbon footprint the values above the 1% materiality threshold recommended in
Fig. 6.Vehicle HC emission profiles in A17 traffic management for the sensitivity analysis. Table 3
Additional traffic emissions due to temporary traffic-light and road closure options.
Additional emissions from traffic disruption.
Relative to 2009 rehabilitation emissions.
[image:8.544.90.459.464.675.2]PAS2050 (BSI, 2011) have been highlighted. In particular, relative to rehabilitation, HC emissions from traffic for a closure start at 18:00 are high, ranging between 28.7% and 116%. Similarly for CO with start time 18:00 emissions range from 9.7% to 39.1% as traffic flows increase between Base Case and 30% additional traffic. Other pollutants namely NOx and
CO2(not PM) also became significant for the earlier start of the closure (18:00) only at higher level of traffic flow namely
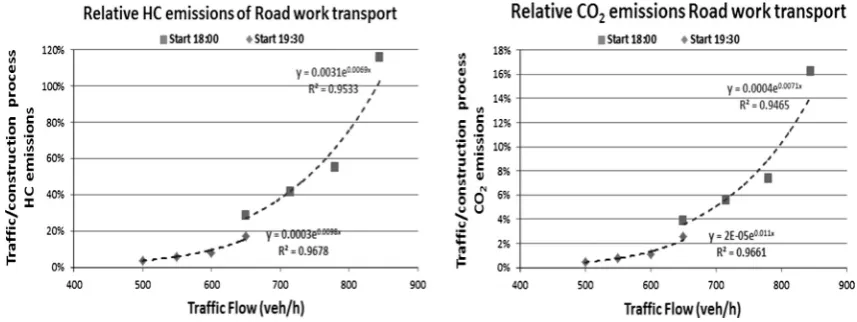
+20% and +30%. At a start time of 19:30 a significant increase in HC of 17.1% only occurred with flow increase of 30%. InFig. 7the exponential effect of increased traffic level on the overall emissions for HC (left) and CO2(right) is evident,
this is due to the increased congestion that builds up for each increment of traffic flow, which has a non-linear trend. This is likely to generally be the case for busier, strategic roads, although it is possible that where average speeds are enforced, which are below the Base Case speeds, overall emissions could be reduced (Patey et al., 2008). It is possible that for minor roads, traffic emissions during road works will be less significant, although it should be remembered that some-times, only much simpler maintenance operations, with lower emissions are required for these roads and so the relative impact could remain significant. This should be the subject of further study.
Conclusions and recommendations
[image:9.544.46.506.81.278.2]This study has explored the implication of extending the system boundary of road pavement LCA, to also include the impacts of traffic disruption at road works. This has been achieved for a case study, by conducting LCA of pavement
[image:9.544.54.483.313.474.2]Fig. 7.Relative increase in emissions for HC (left) and CO2(right).
Table 4
Traffic Emissions due to the overnight lane closures, for the Base Case and the three levels of traffic flows (a) and relative to the 2009 rehabilitation emissions (b).
CO (kg) HC (kg) NOx(kg) PM (kg) CO2(t)
(a)
Emissions by the construction process 614.00 36.40 1750.00 227.80 (<10lm) 430.00
Extra emissions from traffic Start 19:30 Base Case 7.11 1.33 13.31 0.35 1.94
Start 19:30 + 10% BC Flow 12.01 2.18 21.79 0.58 3.43
Start 19:30 + 20% BC Flow 16.37 2.91 29.06 0.79 4.67
Start 19:30 + 30% BC Flow 35.53 6.21 63.76 1.80 10.99
Start 18:00 Base Case 59.65 10.44 97.96 2.69 16.46
Start 18:00 + 10% BC Flow 85.83 15.12 143.62 3.95 23.93
Start 18:00 + 20% BC Flow 113.56 20.10 191.21 5.23 31.73
Start 18:00 + 30% BC Flow 240.29 42.16 408.62 11.38 69.59
CO (%) HC (%) NOx(%) PM (%) CO2(%)
(b)
Relative emissions of traffic vs. construction process Start 19:30 Base Case 1.2 3.6 0.8 0.2%a
0.5
Start 19:30 + 10% BC Flow 2.0 6.0 1.2 0.3a 0.8
Start 19:30 + 20% BC Flow 2.7 8.0 1.7 0.3a 1.1
Start 19:30 + 30% BC Flow 5.8 17.1 3.6 0.8a
2.6
Start 18:00 Base Case 9.7 28.7 5.6 1.2a
3.8
Start 18:00 + 10% BC Flow 14.0 41.5 8.2 1.7a
5.6 Start 18:00 + 20% BC Flow 18.5 55.2 10.9 2.3a
7.4 start 18:00 + 30% BC Flow 39.1 115.8 23.3 5.0a
16.2
rehabilitation, and using micro-simulation to estimate extra traffic emissions at road works (compared to a Base Case of traf-fic emissions without road works).
The modelling confirmed that the type, duration and timing of road works can significantly affect the traffic disruption and associated emissions. This suggests that LCA modelling of alternative TM arrangements might be used to reduce impacts during road works. For this case study, increases in traffic levels result in an exponential increase in emissions during road works due to the oversaturation and delay caused by reduced capacity after the lane closure. This highlights the importance of considering current traffic levels, and predictions of future traffic levels, in LCA of road pavements which include traffic disruption during maintenance.
Comparing emissions from traffic disruption and those due to rehabilitation, for this case study, shows that those from traffic disruption are relatively small, except for hydrocarbons (HC). However, they are generally close to or above the 1% materiality threshold recommended in PAS2050 for estimates of carbon footprints. Emissions due to traffic disruption at road works should, therefore, be included in road pavement LCA and carbon footprint studies along with the traffic modelling necessary to estimate them.
While this case study was chosen partly because its traffic levels are thought to be similar to many other inter-urban roads in England, the exponential relationship found between traffic levels and emissions during road works, means that even for less detailed LCA and carbon footprint assessments at early design stages, traffic emissions during road works should be included within the system boundary. Meanwhile the paper recognised that traffic management and modelling are specific to the location and nature of the road work. Work of this type should be undertaken for a range of case studies to better understand where it is most important to extend the system boundary of pavement LCA.
A limitation of this study, as with most road pavement LCA studies, is that the maintenance of the case study is planned in isolation from the network of which it forms a part. In reality, road maintenance strategies are developed at a network level, and road works at an individual site may be undertaken at a time which is optimum for the network condition, traffic flows and maintenance budget. However, this may not be the same time as if the site was considered in its immediate locality. A second limitation is that only one form of traffic modelling was undertaken. While micro-simulation is considered the most appropriate for this type of work, it could be that, for some circumstances a nested modelling approach should be used. This would consider the microscale modelling in the context of the wider more strategic impact using macro modelling con-sidering link traffic flows rather than individual vehicles, or based solely on queue lengths rather than potential diversion behaviour which may produce results accurate enough for LCA studies.
It is recommended that a wider range of LCA studies, including traffic disruption at road works, be undertaken at network level and including different levels of sophistication in traffic modelling. A more complete study of this sort would provide evidence on which to base requirements for system boundary expansion of road pavement LCA studies to include traffic disruption at road works. These requirements could form part of product category rules for LCA in this sector (BSI, 2012).
Acknowledgements
This study was funded by an Engineering and Physical Sciences Research Council (EPSRC, United Kingdom) Platform Grant in Pavement and Railtrack Engineering. The authors would like to thank staff at Lincolnshire County Council and Saint-Gobain Ltd. for providing data, and Virtus Ltd. and Aggregate Industries Ltd. for practical advice on traffic management.
References
Barlow, T.J., Boulter, P.G., Mccrae, I.S., 2007. Scoping Study on the Potential for Instantaneous Emission Modelling: Summary Report. Transport Research Laboratory.
Birgisdóttir, H., Pihl, K.A., Bhander, G., Hauschild, M.Z., Christensen, T.H., 2006. Environmental assessment of roads constructed with and without bottom ash from municipal solid waste incineration. Transport. Res. Part D: Transp. Environ. 11, 358–368.
BSI, 2010. PD 6691:2010. Guidance on the Use of BS EN 13108 Bituminous Mixtures – Material Specifications. BSI.
BSI, 2011. PAS2050: Specification for the Assessment of the Life Cycle Greenhouse Gas Emissions of Goods and Services. British Standards Institution. BSI, 2012. BSI 20BS EN 15804 2012. Sustainability of construction works - Environmental product declarations — Core rules for the product category of
construction products. British Standards Institution.
Chen, C., Habert, G., Bouzidi, Y., Jullien, A., Ventura, A., 2010. LCA allocation procedure used as an incitative method for waste recycling: an application to mineral additions in concrete. Resour. Conserv. Recycl. 54, 1231–1240.
Cross, S., Chesner, W., Justus, H., Kearney, E., 2011. Life-cycle environmental analysis for evaluation of pavement rehabilitation options. Transport. Res. Rec., 43–52, No 2227.
DEFRA, 2011. Guidelines to Defra/DECC’s GHG Conversion Factors for Company Reporting: Methodology Paper for Emission Factors. Department for Environment, Food and Rural Affairs.
ECRPD, 2010. Energy Conservation in Road Pavement Design, Maintenance and Utilisation. Grant Agreement: EIE/06/039/SI2.448265: Intelligent Energy – Europe.
EUROBITUME, 2011. Life Cycle Inventory: Bitumen. The European Bitumen Association.
Galatioto, F., Bell, M.C., Hill, G., Rose, P., Hodges, N. 2012. Evaluation of carbon reduction traffic measures employing a novel approach to micro-simulation modelling of real-world emissions. 19th Intelligent Transport Systems World Congress, Pages EU-00482.
Hakkinen, T., Makela, K., 1996. Environmental Adaption of Concrete – Environmental Impact of Concrete and Asphalt Pavements. Technical Research Centre of Finland (VTT).
Hammarstrom, U., Karlsson, R., Sorensen, H., 2009. Road surface effects on rolling resistance – coastdown measurements with uncertainty analysis in focus. Deliverable D5(a) of the Energy Conservation in Road Pavement Design, Maintenance and Utilisation (ECRPD). Swedish National Road and Transport Research Institute (VTI).
Huang, Y., Bird, R., Bell, M., 2009a. A comparative study of the emissions by road maintenance works and the disrupted traffic using life cycle assessment and micro-simulation. Transport. Res. Part D: Transp. Environ. 14, 197–204.
Huang, Y., Bird, R., Heidrich, O., 2009b. Development of a life cycle assessment tool for construction and maintenance of asphalt pavements. J. Clean. Prod. 17, 283–296.
Huang, Y., Spray, A., Parry, T., 2013. Sensitivity analysis of methodological choices in road pavement LCA. Int. J. Life Cycle Assess. 18, 93–101.
Lepert, P., Brillet, F., 2009. The overall effects of road works on global warming gas emissions. Transport. Res. Part D: Transp. Environ. 14, 576–584. Marceau, M.L., Nisbet, M.A., Vangeem, M.G., 2007. Life Cycle Inventory of Portland Cement Concrete – PCA R&D Serial No. 3011. Portland Cement
Association.
Milachowski, C., Stengel, T., Gehlen, C., 2011. Life Cycle Assessment for Road Construction and Use. EUPAVE – European Concrete Paving Association.
Mroueh, U.-M., Eskola, P., Laine-Ylijoki, J., 2001. Life-cycle impacts of the use of industrial by-products in road and earth construction. Waste Manage. 21, 271–277.
NAEI, 2013. <http://naei.defra.gov.uk/data/ef-transport> (accessed 09.01.15).
Patey, I., Conquest, J., Holt, A., 2008. Assessing ‘carbon balance’ of intelligent transport schemes. Proc. Inst. Civ. Eng.: Eng. Sustain. 161, 181–184.
Piantanakulchai, M., Inamura, H., Takeyama, Y., 1999. A life cycle inventory analysis of carbon-dioxide for a highway construction project using input– output scheme: a case study of the Tohoku expressway construction works. J. Infrastruct. Plann. Manage. Jpn. Soc. Civ. Eng. 16, 411–418.
Santero, N., Loijos, A., Akbarian, M., Ochsendorf, J., 2011a. Methods, Impacts, and Opportunities in the Concrete Pavement Life Cycle. Massachusetts Institute of Technology.
Santero, N.J., Harvey, J., Horvath, A., 2011b. Environmental policy for long-life pavements. Transport. Res. Part D: Transp. Environ. 16, 129–136.
Sayagh, S., Ventura, A., Hoang, T., François, D., Jullien, A., 2010. Sensitivity of the LCA allocation procedure for BFS recycled into pavement structures. Resour. Conserv. Recycl. 54, 348–358.
Spray, A., Huang, Y., Parry, T., 2012. Importance of some aspects of methodology in pavement life cycle assessment. The 5th Eurasphalt & Eurobitume Congress, Istanbul, Turkey.
Stripple, H., 2001. Life Cycle Assessment of Road – A Pilot Study for Inventory Analysis. Swedish Environmental Research Institute (IVL).
Wayman, M., Schiavi-Mellor, I., Cordell, B., 2011. Protocol for the Calculation of Whole Life Cycle Greenhouse Gas Emissions generated by Asphalt – Part of the Asphalt Pavement Embodied Carbon Tool (asPECT). Transport Research Laboratory.