Rochester Institute of Technology
RIT Scholar Works
Theses
Thesis/Dissertation Collections
6-1-1973
The Use of Thin Layer Chromatography (TLC) in
Qualitative and Quantitative Determinations of
Photographic Developing Agents (in Developer
Solution) Using a Scanning Densitometer
Michael Gilbert
Follow this and additional works at:
http://scholarworks.rit.edu/theses
This Thesis is brought to you for free and open access by the Thesis/Dissertation Collections at RIT Scholar Works. It has been accepted for inclusion
in Theses by an authorized administrator of RIT Scholar Works. For more information, please contact
Recommended Citation
AND
QUANTITATIVE
04
PHOTOORlPIiIC
DEVELOPING
AGENTS
(IN
DEVELOPER
SOLUTION)
USING
A
SCANNING
DENSITOMETER
by
Michael
B.
Gilbert
A
thesis
submitted,in
partialfulfillment
of
the
requirementsfor
the
degree
ofBachelor
ofScience
in
the
School
ofPhotograehy
in
the
College
ofGraphic
Arts
andPhotography
of
the
Rochester
Institute
ofTechnology
June,
1?73
mvjpg
i gAd_vi
ACKNOWLEDGEMENTS
The
author wouldlike
to
thank
Dr.
Schumann,
Dr.
Francis,
Professor
Carroll
andProfessor
Hill
ofthe
College
ofGraphic
Arts
andPhotography,
School
ofPhotography
atthe
Rochester
Institute
ofTechnology;
Dr.
Craven
Dr.
Sowir.ski
andDr.
Burns
ofthe
College
of
Science
atthe
Rochester
Institute
ofTechnology;
Elizabeth
.Solow,Assistant
Processor,
division
ofNeurological
Surgery,
Ind.iana
University
School
<XMedicine
at
Indianapolis;
Dr.
H.
Baden
oCthe
Eastman
Kodak
Company,
Photographic
Technology
Division
atRochester,
New
York;
Richard
Bilhartz
andBarbara
Roberts,
my
Xancae,
for
their
assistance with
the
research and preparation ofthis
thesis
Special
acknowled.genentis
d.ue
to
the
C.I. A.
for
TABLE
OF
CONTENTS
List
ofTables
iy
List
ofFigures
vList
ofGraphs
viiIntroduction
1
State
ofthe
Art
1
Theorv
1c-Objective
ofThesis
2k-Objective
I
2^
Procedure
25
Observations
27
Data
andCalculations
30
Conclusion
32
Objective
II
86
Procedure
3^
Observations
37
Data
andCalculations
4o
Conclusion
80
Obi
activeIII
li-2
Procedure
-i-2Observations
57
Data
andCalculations
9S
Conclusion
6o
Bibliography
70
A
prenylices
73
Appendix
A
7L
Table
I
Volume
of stock solutionsI
andII
usedto
form
ulate
developer
solutions1-4-1-8
^3
Table
II
Factorial
Experiment
for
runs1-X8
k-k
Table
III
Conversion
ofAbsorption
unitsto
Density
on.520
TLC
Platen
56
Table
IV
Density
Maxima
Dm(l),
Dm(2)
andDm(3)
for
runs1X-8
'
58
LIST
OF
FIGURES
Figure
1
Devices
usedfor
depositing
samplesfrom
prepared solution
k
Figure
2
Preparation
ofChramatoolates
5
Figure
3
Dimensions
ofPrecoated.
Chromaufcogra6
Figure
^-
Application
ofSamples
to
ThinL^yer
Chroma
-togram
7
Figure
5
Elution Apparatus
8
Figure
6
Application
ofVisualization
Reagent
with;atomizer
9
VltrilriO 1 P. ov,^ O irnlunr. 1^
i
'
v ~
-"-Figure
8
Two
Dimensional
Chromatography
12
Figure
9
Adsorption
isotherm of a subntan.ee underreal and
ideal
conditions18
Figure
10
'Dens
i
tome trie
Traces
19
Figure
11
Adsorption
isothermof
two
different
substances
21
Figure
12
TLC
of photographicdeveloping
age^t^18
prepared
in
aqueous solutionX_th
inactive
silica gel used, with n-butanol . aceti c acid:
water solvent svstem
2Q
Figure
13
Step-wise
IonizatX"0 ofHyd.roqniuone
to
aQu in
one32
Figure
Ik
Oxidation
ofHydroouinone
to
a prabenzo
.quinone
33
Figure
15
Formation
ofhydraauinone
monosulfonate33
j? i
rr-, -,ro
i_
8
T-.roDime
nzi
^1"1aI
T
LC
9Figure
18
Application
of streaker sampleto
the
Chro
ma,
togram
k7
Figure
19
Uneven
andEven
Solvent
Front
^8
Figure
20
Photovolt
TLC
Densitometer
520
50
Figure
21
Difference
in
visual appearance of chroma-togram
after visualization52
Figure
22
Illustration
ofhow,
density
maximaDm(l),
Dm(2) and.DX(
3 )
we"9 obtainedfor
speciesRf(l),
Rf(?J
^XlRf(3)
respectively
55
Figure
23
Visualization
reagent a.policatorfor
Thin
Layer
Chromatography
61
Figure
2k
5D-2000
Chromatogram
Analyzer
75
Figure
25
Schematic
diagram
of a modern splitbeam
TLC
scanner76
LIST
OF
GRAPHS
Graph
I
Log density
vs. concentration ofhydroquinone
for
runs1-8
6k
Graph
II
Log
density
vs. concentration ofhydroquinone
for
runs8-16
.65
Graph
III
Log
density
vs. concentration ofhydroquinone
for
runs17-28-"
66
Grph
IV
Log density
vs.log
concentration o^
hydro-quinoue
for
runs25-32
67
Graph
V
Log
density
vs. concentration ofhydroauinone
for
runs33-X)
" "
68
Graph
VI
Log
density
vs. concentration ofhydroquinone
for
runsLl-48
"
69
OF
PHOTOGRAPHIC
DEVELOPING
AGENTS
(IN
DEVELOPER
SOLUTION)
USING
A
SCANNING
DENSITOMETER
by
rticnaei
a.
Gilbert
An Abstract
TLC
was used,for
qualitative and quantitativeanalysis of photographic
d/eveloXag
agentshydroquinone,
metol phenidone para,
phenvlsned.iam.ine,
paraaminopheuol,
ascorbic acid and.
the
oxid.ized. species.Experimental
r-on-ditions
and proceduresfor
reporting
Rf
rallies ofthe
aqueous solutions of
the
developing
agent were standardized..Quantitative
TLC
w-apdone
fc"hydrocuinone
.
The
den-cifv nnca -vimo0^+-aT v)ar. -pr>^m
-f-Via "nannpTitr r.onc;T_+-r\'T1^itrir> hrq/.o
of
the
eluted
and visualized chromatogram was correlated,to
of .hydroquinone were prepared at
four
levels
of concentretion,
three
levels
of pH andtwo
levels
of sodium sulfiteRecently,
in
the
pasttwenty
years,
thin
layer
chromatography
has
played'^nimportant
roLein
au.alitativeand quantitative analysis of
many
tyoes
of substances.Substances
to
be
analyzed, were complex organic oomoound.soccurring
in
nature or synthesizedby
man.LLC's
rolein
biological
researchhas
been
immense
and.is
anindespensi-ble
tool
in
laboratories
in
maPorhospitals.
The
chief advantage ofTLC,
is
that
it
requlresvvery
'little
sample, usual ]v miaraarams .to
performthe
oualita-tive
analysis.In
the
pastten
years,
attentionin
researchhas
been
drawn
to
quantitative analysis of compounds usingTLC,
but
much more successhas
been
gainedin
the
field
ofgas chromatography.
Gas
chromatographicinstrumentation
is
complex and much more costly
than
TLC
instrnmeritsState
ofthe
Art
In
the
105Cs,
published papers appeareddescribing
qualitative
determinations
of photographicdeveloping
agents 'jsinm paper chrom-atc^ao^'v, ~
Mariari
's
and[8arti.nel.liLs a.rticle rave
the
best
description
opexperimental
la.
Russel
p/ip-tiMq1Mi
a lvol c; iy\ pv.nt,-m'",ini"-"
conditions
they
usedfor
paper chromatography.The
LuValle
and.Pannel
paperdid.
notdescribe
experimentalconditions.^
Conditions
of LuValle' s and. Pannel' s experimentation were not
explicitly
defined
and. madeit
difficult
to
repeattheir
results.The
author ofthis
paper
found
two
referencesto
published papersinvolved
with qualitative
determinations
of photo chemicalsusing
pacer
chromatography.
After
WoX
d
War
II,
agonStahl
did
Intense, researchin
establishing a neartype
of chromatography.It
wassimilar
to
the
older paperchromatography
but
had.
distinct
advantages.
Thin
layer
chromatography
was coming of agebut
did.
not achieve recognition until Stahl' stextbook
was ^k
m iVi1 . cViqH -.v. 1 OKI
"This
boo't
systematizesits
voluminousliterature
and applicable method.3 sothat
the
text
canbe
used as a laboratoryhaud.book.
TLC
canba
usedfor
organic a,rdinorganic
mixturesranging
from
10~^to
10--'gram and
has
been
appliedto
alarge
group of complex compounds:d_rums,
aminoacids,
natural and SE;rntheticproducts,
vitamins,
steroids,
dyes,
S11">-o-pq "8o
'3.
Mari.ani
qndp
#Martinelli,
Sci.
Ind
,Photon-.
(Fr.
)
,p.
276.
-*
J
.A
.Pannel
and. .T.S,LuValle
Analytical
Chamistry,
Vol.
2
5,
p.1566.
^Thin
Layen
Chromatography--A
Laboratory
Ha.nd.boo1',
Edited bvEg
onStahl
,
5"Thiu
Layer
Chromatography
, "photochemicals
In
a published paperby
J.
Eggers,
separation
and.detection
.conditionswere not reported
for
mixtures ofo,
m,
and. para aminophenols andN-methyl-p-aminophenol.7
Stahl
suggeststhat
TLC
ofphenols and
their
sulfonic acids shouldbe
selected withacidic
solvents,
ofhigh
polarity.Solvent
systemssug
gested
by
Dr.
Baden
ofthe
Eastman
Kodak
researchlabora
tories
in
Rochester,
New
York,
willbe
listed
in
Appendix
B.
In
qualitativedeterminations
of photographicdevelop
ing
agentsusing
TLC,
the
Rf
value ofthe
developing:
agentis
dependent
uponthe
quality
ofthe
solventsystem,
chromai, ogram and. activity,
Other
developing*agents
should not
have
anidentical
Rf
value.There
are complications;
:Foremost,
the
sample of -developing agent prepared,
in
aqueous solution requires a preservative or antioxidant
to
enableit
to
remain unoxidized and potent.For
this
reason,
sodium sulfiteis
usedin
developer
form
ulations. ,
Photographic
developer
solutionsthat
develop
silver
halide
emulsion require adjustmentin
a pH rangewhere
the
developing
agent.canionize.
It
is
good,sense
"Stahl,
oo. cit.k
("> J..1.,!v,r
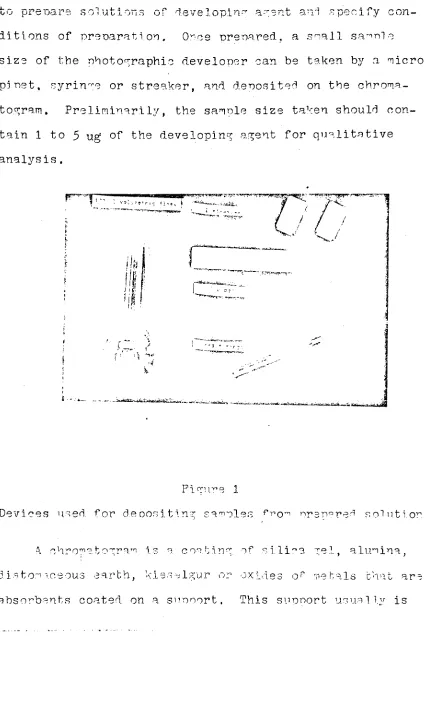
i/O prepare soiUoions or.
develop!
at andspecify
conditions
ofpreparation.
Once
prepared, a small samplesize of
the
Photographicdeveloper
canbe
taken
by
a micropi
pet,
syringe orstreaker,
and.d.eoosited
onthe
chroma-togram.
Preliminarily,
the
sample sizetaken
should contain
1
to
5
ug'of
the
developing
agentfor
qualitativeanalysis .
L-'
4T*--V
1
A- .--_-_i-___i*i ... ...
...
Figure
1
Devices
used,for
deoositinm
samples from prepared solutionsA
chromat
ora,mis
a coating of silica rel aluminad
iatom
i.ceousearth,
Xies-Xgur
or oxpies
of metalsthat
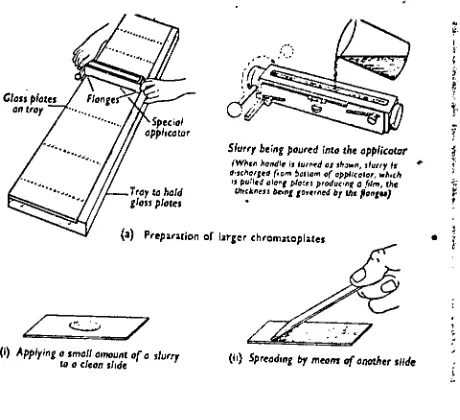
are [image:15.549.61.485.71.772.2]Traytohold g/osiplatts
Slurry beingpoured intothe applicator (Whenhandleit turnvdatitatwi, slurry it O'Kftoffed ftomitauom of eppticctor,which itpulledalonfplo-.ttproduc-ngafilm,the
Uiitkneiltteinfgownedbythtflam**)
(a) Preparationoflarger chromatoplatej
(I) Applyinga smallamountofaslurry
tooclean slide (ii)Spreadingbymeansofanother slide
[image:16.549.160.390.138.348.2]Figure
2"Preparation
ofChromatoplates
It-the
past,
coating wasdone
in
the
laboratory
to
a specified, quality of absorbent and coating
thickness.
This
is
ateddous
procedurehi.it
recentlvthe
advent of orecoated substrates of silica ^.Ip-iina aud pal
layers
have
eliminated,this
burden.
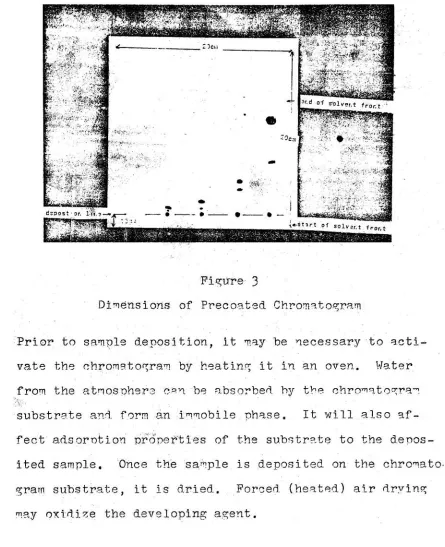
26.
Figure
3
Dimensions
ofPrecoated
Chromatogram
Prior
to
sampledeposition,
it
may
be
necessary
to
activate
the
chromatogramby heating
it
in
an oven.Water
from,
the
atmosphere canbe
absorbed,by
the
chromatogramsubstrate and.
form
animmobile
phase.It
will also affect
adsorption properties ofthe
substrateto
the
depos
ited
sample.Once
the
sampleis
deposited
onthe
chromatogram
substrate,
it
is
dried.
Forced,
(heated)
airdrying
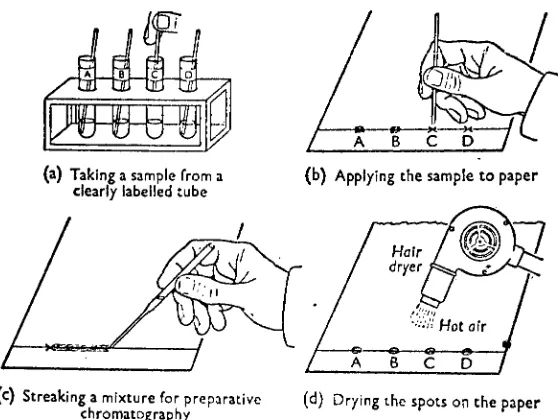
[image:17.550.47.492.122.669.2]uwwm
(a)
Taking
a samplefromaclearlylabelledtube
(b)
Applying
thesampletopaper(c)
Streaking
a mixtureforpreparative chromatography(d)
Drying
the spots onthepaper9
Figure
k
Application
ofSamples
to
Thin
Layer
Chromatogram
Elution
in
the
appropriate solvent systemis
the
nextstep.
The
chromatogramis
placedin
the
confine of a ves selthat
has
the
solvent.This
will ensure an atmosphere saturated, with solvent vapors.Otherwise
there
will notbe
an evenfront
travel.
[image:18.549.122.401.85.295.2]8
Solvent
Plateinthe courseof
development
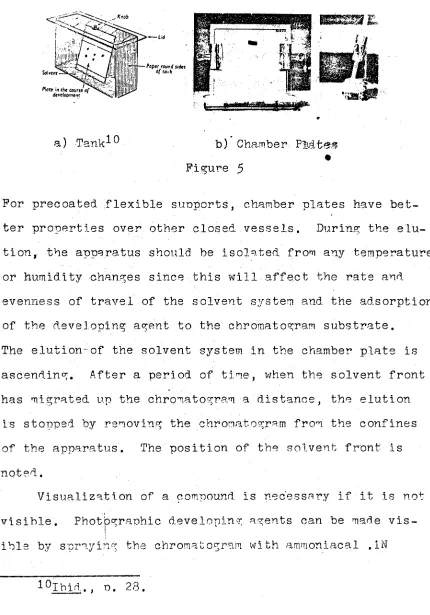
a)
Tank10b)
Chamber
PMtes
Figure
5
For
precoated .flexiblesupports,
chamber plateshave
bet
ter
properties over, other closed, vessels.During
the
elu-tlon,
the
apparatus shouldbe
isolated
from
any
temperature
or:
humidity
changes sincethis
will affectthe
rate andevenness of
travel
ofthe
solvent system andthe
ad.sorptionof
the
developing
agentto
the
chromatogram substrate.The
elution-ofthe
solvent systemin
the
chamber plateis
ascending.
After
a period oftime,
whenthe
solventfront
has
migratedup
the
chromatogram -a'distance,
the
elutionis
stoppedby
removing
the
chromatogramfrom
the
confinesof
the
apparatus.The
position ofthe
solventfront
is
noted.
Visualization
of a compoundis
necessary
if
it
is
not-visible'.
Photographic
developing
agents canbe
made visible
bv
sprayingthe
chromatogram with ammoniacal ,IN
[image:19.549.58.488.100.715.2]veloping
?_f
can
be
made.Application
ofthe
visualization reagentfor
qualitative purpose should,
be
sufficientto
makethe
substances visible.
If
too
much visualization reagentis
ap
plied,
the
sharpness willdecrease.
For
quantitativepur-#
poses,
little
is
found,
in
the
literature
aboutthe
amountof
visualizing
reagent needed.Spots
whichhave been located
Position;of
spots which
haveyet tobelocated
(b)
Weightto
keep
paperf.._4
Compressedoir orhandbellows
44
4JJ
Solution oflocating
reagentJI
Tip
-r-n ro8
'
Application
ofVisualization
Reagent
with AtomizerBefore
spraying with,the
visualization reagent and.taking
measurements,
the
ohromatogram shouldbe
aird.ried.
Cqye
*'.rastaken
whenmixing
and spravihTthe
silver nitrateSpravi.ng
wasdone
under ablower
hood..
When
finished,
the
ovcess oilirer nitrate wan
disposed
ofimmeai.ate.lv.
1 1
Ibid
10
n{>
vaivioo iw i cac! 'I.OVGJ.UMJ.Ui a^OHU O'.I--.1 k-/^ P..^ iy^1 iA-1
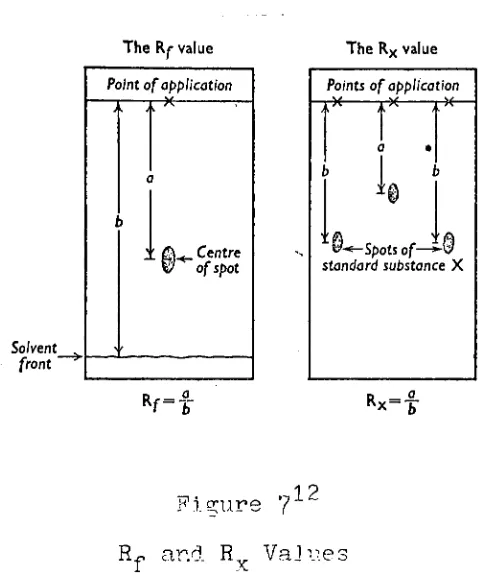
by measuring
the
ratio ofdistance
the
developing
agenttraveled
after eluti on andthe
distance
the
solventfront
traveled.
The
Rf
value Point ofapplication.. .. "
<i ,
.
'.
).<_
Centre / ofspotSo.vent '. front
<v=i
The
Rx
value Points ofapplicationap* ;.
*-Spots
of-standard substanceX
R*=
*-1
2
Figure
7
"Rf.
andR
Values
1 a
A
variety
of visualization reagents are available.Two
dimensional
TLC
canbe
usedto
improve
separationof
developing
agents preparedin.
one solution.Some
deveL
oping agents
may
have
similarR
values for a particular chromatogram substrate and solvent system.Two
dimension
al
TLC
is
done
by
allowing
the
chromatogram(with
sample12
rbid.,
p.17.
[image:21.549.159.398.184.476.2]spotted
in
the
lower
left
hand
corner)to
elutein
the
ascending
direction
for
a period, oftime.
Afterwards,
the
chromatogramis
removed,
dried
and. rotated90'
counter.
clockwise and placed
in
another solvent system.Elution
in
the
second solvent systemis
continuedfor
a period oftime
andthen
stooped.Two
Rf.values,
for
the
first
andsecond
elutlons,
are used,to
specify
the
v. andy
coordinates on
the
chromatogram wherethe
d.evelooing
agentssep
arated
to.
Steps
In
Two
Dimensional
Chromatography:
1.
sample preparation and.deposition.
2.
activation3.
first
elutionk.
drv
5.
rotate 90'counter-clockwise
6.
second elution7.
dry
STTPS
3+
51IP
SOLVEWT
SYSTEM
X
SOLVENT
STfttfT^X
ro1at
visua
taini
e rabl ardi z el iX4 ar^s curve pen en soot m a a^1:togra howe"
the
musing
prn nantrica
Figure
8
Two
Dimensional
Chromatography
"While
TLC
qualitative analysis areTvo 1V QimTilr^ to riry iio-ino*
T-l-o-nHomrio
.. .---__
'
/
lization
reagents andRf
Tralues, ob~
n^ quantitative
information
is
cons
id.
-v niored.jfficult.
. ,8acompletely
standing conditions of sample size and
TLC
on,
conditions and calibrationstand-can
be
usedto
provide calibrations of spot area versus anoint of corv
t.
The
amount ofthe
ma.teri.alin
a can alsobe
determined
an.th
a rl3i"ity
reman
t
obtained,by
photometric or aho-phic mc'a,na
The
most accurate results er arethose
obtainedby
extrncti on ofateria.l
in
the
spotfrom
th absorbent as solvent andthe
ndate
r^i
rprgthe
t
colorimetrica,lly or speetroohotome-1 1 nlVTLC
densitometry
has
been
advanced,by
introd.u.c.ti
on ofJj-i
i.fDevelopment,
k.
"Phiai
Laver Chromatography "'the split reference
beam.
This
has
overcomemany
ofthe
variables
leading
to
inaccuracies.
Determinations
canbe
made with relative standard
deviations
oftwo
to
three
percent.
Quantitative
evaluation ofthin
layer
chromatogramsby
conventional methods without extraction of separatedsubstances are
discussed
in
Stahl's
textbook,
Thin
Layer
Chromatography-
-ALaboratory Handbook.
Theory
ofThin
Layer
Chromatography
In'^TLC,
separation of compoundsis
obtained asit
travels
with amigrating
solventthrough
athin
layer
ofadsorbent material coated on a glass or
flexible
support.Separation
of compoundsis
due
to
adsorption,
partitionor reverse phase mechanisms.
The
most common mechanismIs
adsorption whichIs
useful
for
separation oflipophilic
organic compounds of medium or
low
polarity.Silica
gel and alumina oxide are usedfor
adsorption chromatography.The
materialbeing
separated
is
proportioned,between
the
migrating
solvent systemand
the
active adsorption sitesin
the
adsorbent.
Highly
polar compounds will
be
strongly
adsorbed..The
polarity
of organic
compounds,
such as photographicdeveloping
a-gents,
willbe
establishedby
the
type
and number offunc
tional
groupsthat
have
the
ability
offorming
bond.s
withhydrogen.
Ik
inorganic
compounds,,
Unactiva4ed
silicagel,
carrying
anadsobed phase of
water,
canbe
used,In
partitionTLC,
a proportion
is
established,between
the
migrating
solventsystem and
the
adsorbedstationary
mobile phase.Separa-tion
of substancesis
similarto
factors
governing
aseparatory
funnel
extraction,
where relative solubilities..,-. MP*
'
(hence,
the
partition'coefficient
)
ofthe
substancesde
termine
this
proportion.
.
Reverse
phaseTLC.
is
efficientin
separating
homol
ogous
lipophilic
compounds.
This
is
aless
frequently
used,
Theory
Consideration
ofthese
meahanismsis
necessary
in
selecting
the
rightmigrating
solvent(solvent
system),
chromatogram
substrate,
pretreatment(activation)
and.elution conditions
J
5
The
Rf
value of a substanceis
a number derivedfor
a compound.
Rf
distaaae
of centero"
snot from origin
"distance
of solventfront
from originRf
valuesin
adsorptionTLC
depend,
onfactors
which mustbe
controlled..1.
Quality
of adsorbent-Silica
gel,
alumina and1
5
kieselgur
are ofmany
substrtesto
choosefrom,"
2,
Thickness
of adsorbent layer- controlledby
the
coating
operation.3,
Degree
ofactivity
of adsorbent- pretreatment ofchromatogram
by
placing
In
dry
heated
oven or soaking
the
chromatogramin
a.treatment
solutionto
ad.
iust
pH orchemically
impregnating
the
chromatogram car,
be
done.
k.
Quality
and nature of solvents used- a.variety of
solvent systems with one or more solvent components
15"
Thin
Layer Chromatography withEastman
Chromagrarn
Sheet
and.Developing
Apparatus , "Kodak
Publications,
reprintv 1 Q7?
-$
-s
^Reiner
Lapp,
"Brinkman
3ibliograohy
for
TLC,"16
with
many
combinationsexist.
5.
Degree
of chamber saturation-There
aredifferent
vessels of
varying
size characteristics.Ideally
the
atmospheresurrounding
the
chromatogram shouldbe
saturated with solvent vapor.6.
Temperature-
This
will affectthe
adsorption of acompound as well as rate of
travel
ofthe
solventsystem.
7.
Running
distance-The
distance
the
solventsystem
travels
shouldbe
-kept-, constantby
recording
the
time
of elution andtravel
distance.
8.
Technique
of elution-There
is
a choice ofdevel
opment apparatus
for
ascending,
descending
orhor
izontal
development.
9.
Amount
of sample-1
to
5
ug
samples are recommended as.a
starting
point.Tailing
is
observed, withsamples of greater
concentration,
10.
Impurities
presentin
sample mixture-Water
is
animpurity
that
will affectthe
degree
ofactivity
of adsorption, sites.
11,
Visualization-This
is
done
to
render aninvisible
compound
visible.
Attention
is
drawn
to
the
problem
of .tailing.At
higher
concentrations,
tailing
-'Eastman
Organic
Chemical
Catalogue
frk6,pp.
391-392,
1971,
publishedby
the
Eastman
Kodak
Company,
is
a visual effect which was observedto
be
anunsharp
separation ofthe
compound afterelution.
Some
compounds are not visible after elution andneed
to
be
made visible.There
are avariety
ofvisualization reagents available
for
invisible
compounds.
They
react and.form
a coloredpro-1
8
duct.
As
mentionedin
the
"State
ofthe
Art,"application of
the
visualization reagent willhave
significant contributionto
the
sharpnessof
the
detected
compound, after elution.In
TLC
a substanceis
separated onthe
chromatogramas
it
is
being
transported
by
a mobile phase of a solventsystem.
TLC
canbring
about,
a separation,by
an absorptionAv -v-. <-%-t-,4-^ 4-4 y>-wi m^aUi-ivit T" ITIVi,-j
4-o"1 1 -5v\ ^,8f*
.^ a*
<... _, .71_. _._ .J_ -*** - --i- - .--/'> - -- --1' * -- - . -L. _
^ ._, _, .
j_
O'
1 <_**.auv>x Owx vu
TLC
canbe
explainedin
terms
of aLangmuir
amp)Freund.lich
3
dsorpti
onisotherm.
These
adsorptionisotherms
dictate
the
condition ofthe
amount of a substance adsorbedby
anadsorbent.
l""Eastman
TLC
Visualization
Reagents
andChromato
graphic
Solvents
" KodaV Publication?* .T.T_e; ,Tnlv 1Q7118
Adsorption
isotherm
of a substance underideal
and real conditions.Concentration
'C
on
the
adsorbenti
dealI
cd
Z
realII
*p4 rri1V>^ Q J. __. .^.. -.
y
Adsorption
isotherm
of a substance at-
different
levels
of concentrationFreuud.i
ich
and.L?.aTniuir
isotherms:
1)
M= aP(Freundlich)
2)
IX
dK?/(l+KP)
(Langmnir)
M-is
mass of ad.gorba.te/ mass of ad.sorpentP-eoui
librium
preosur-of ad.sorbate
a
b,
andk
are constants characteristic of particularadsorbents which are
particularly
temperature
depen
dent.19
l^Blae^el
anH^el
ocha81
"m.I'm
iimis secondedition,
a.XX,
in("'"-"r
Oijr>Viti t
t
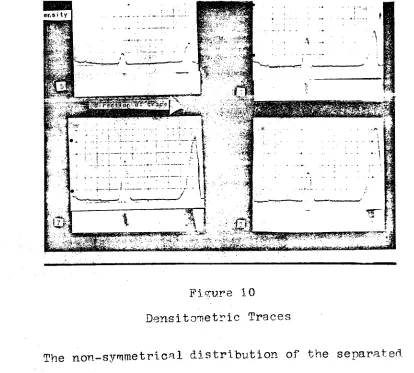
If
a substance weredeposited
on a chromatogram,eluted,
and visualized andthe
image
ofthe
visible substance was scanned with a
densitometer,
atrace
wouldbe
obtained.
Traces
5,
6,
7,
and8
(in
figure
9)
aretraces
of a chromatogram with samples of hydroquinone at .5,
1.0,
5?0
and10.0
g/1 concentration after elution and visualization with .IN ammoniacal si'ver
nitrate
/{see
figure
10).
Figure
10
Dens 1 tome
trie
Traces
The
non-symmetricaldistribution
ofthe
separated.substance at higher concentration on
the
[image:30.549.64.478.297.670.2]20
seen on
the
densitometer
trace
as a skewed gausiandis
tribution.
Also,
it
was noticed,that
the
maximumdensity
of
the
trace
wasincreasing
with greater concentration ofhydroquinone.
The
reasonfor
this,
as explainedin
terms
ofthe
adsorption
isotherm,
is
that
athigher
concentrationsthere
are not enough active adsorption centers
to
separate outthe
compound.Und.er
ideal
conditions wherethere
areenough adsorption
centers,
the
compound willbe
separatedout
sharoly,
However,
under realconditions,
there
is
adecreasing
linearity.
In
otherwords,
there
is
a maximum concentration of substance which
the
adsorption centers
can adsorb.Beyond
this
concentration,
tailing
will- -r "
-. J-8Alu>./ 9
In
the
partition mechanism ofseparation,
muchthe
same
is
true
for
the
tailing
effect.A.
partition mechanism
involves
two
phages;
one mobile andthe
otherImmobile,
If
the
substanceis
not saturatedir
the
mobile
phase,
there
willbe
asharp
separation.The
saturated, state ofa solute
in
a solventis
dictated
by
the
partition coefficient.
When
there
is
a saturated statefor
the
substance
in
the
mobilephase,
the
substance will separatefrom
the
rest ofthe
migrating
substance until equilibrium of
the
partition coefficientin
the
mobile chaseis
restored.
up i.rop.11
1 1
:. c or water etttra,cting particles.This
willaffect
the
equilibrium, of waterin
the
different
phases.Rf
values obtained underthese
conditions willbe
witherror
due
to
difficulty
of measurement xvithtailing
effects.
Two
d.ifferea.'-t-.--aes will separate out
to
dif-ferent
positions on-4 '44X.hromatogramduring
elutionif
there
is
difference
in
the
adsorption properties or partition
coefficient with a particular solvent system andchromatomram substrate.
AWofcfTM
\5oTHteft
Figure
11
Adsorption
isotherm
oftwo
different
substances [image:32.549.87.454.276.670.2]22
devised
by
choosing
the
appropriate mechanisms which willbring
aboutthe
separation.
In
TLC,
avariety
of mechanismsf
orReparation canbe
controlled
by*the
choice solventsystem,
quality
of adsorbent and
degree
ofactivation.
Activation
is
the
processof
heating
the
chromatogram
in
adry
ovenfor
a period of *time
to
dry
offthe
waterfrom
the
atmosphere which canbe
absorbed
by
the
silica gel.Water
willbetadsorbed
atthe
activation sites.
This
meansthe
degree
ofthe
activity
will
be
determined
by
the
amount of water presentin
the
atmosphere or
in
the
solvent system.For
photographicde
veloping
agents and. other non-polar, organic"compounds avariety
of non-polar solvents are usedfor
a solvent system.
If
the
mechanism of separationin
TLC
is
primarily
adsorption,
the
chromatogram willbe
activated andthe
solvent system will contain
little
or no water.There
areother substrates
besides
silicabut
'whenactivated,
do
notexhibit as much adsorptive properties.
By
notactivating
silica and. other chromatograms and
poisoning
the
solventsystem with more polar solvents such as
water,
the
sep
aration can.
be
shiftedto
a partitionmechanism.
"Generally,
hydrocarbons
are adsorbedslightly,
if
atall,
andthus,
migratefastest.
Unsa.tur.ated
hydrocarbons
are morestrongly
adsorbedthe
moredouble
bonds
they
contain.Hyd.rocarbons
containing
conjugated
double
bonds
arestrongly
adsorbedthan
those
having
a system ofisolated,
2k
OBJECTIVE
OF
THESIS
TLC
was used as a qualitative and quantitativeanalysis of photographic
developing
agents preparedin
aqueous
solution
with specifiedlevels
of sodium sulfiteconcentration
and pH.There
werethree
specific objectivesI.
R:^
values ofdeveloping
agents.-B-f
values weretab
ulated
for
aqueous solution ofdeveloping
agentsmetol,
hydroquinone,
hydroquinone
monosulfonate,
phenidone,
ascorbicacid,
CD-3,
paraaminophenol,
para phenylenediamine
HCL
andamidol.
Two
different,
solvent systems were
used.
IT.
Two
dimensional
TLC-Hyd.roquin.one,
phenidone,
metoland
CD-3 developing
agents were mixedinto
one solution
'and
two
dimensional
TLC
was used,to
separatethe
developing
agentsfrom
oneanother.
III.
Quantitative
TLC-TLC
was usedfor
quantitativeaual-vsis of
hyd.roquinone
prepared, atfour
levels
ofcon-.c-entration,
three
levels
of oH and.two
levels
of sodium
sulfite concentration.The
density
maximaDm(#)
obtained after visualization and
d.ensitometric
scanning
was correlatedto
the
concentration ofOBJECTIVE
I
Procedure
1.
Two
per centsolutions'
of
metol,
hydroquinone
mono-sulfonate,
hydroquinone
J
phenidone,
ascorbicacid,
CD-3,
para aminophenolHCL,
para phenylenedi amineHCL
and amidol were preparedby
adding
.2g
of eachdeveloping
agentto
a100
ml volumetricflask
whichcontained
5,g
of sodium sulfite and.approximately
80
mlof water.
The
CD-3
solution contained ,2g o.f sodiumsulfite.
A
phenidone/ ascorbic acid solution wasprepared.
2.
The
pH ofthe
solution was ad-justedto
10.0
with6N
sodium
hyd/roxide.
The
amidol solution was adjustedto
a pH. of7.0.
3.
The
volumetricflasks
werebrought
up
to
volumeby
adding
a solution of water and sodium sulfite atlg/l.
Afterwards
the
solutions were stoppered.k.
5
ul samples of each solution wasdrawn
up
by
a'
streaker
and.
deposited,
on an unactivated silica gel chromatogram.
The
chromatogramMwas precoated and. manufactured.by
Eastman
Kodak.
The
samples were placed1.5
mmfrom
26
This
accomodated eight samplesdeposited
onthe
20
cmwide
thin
layer
chromatogram.
5.
The
sample wasplaced
in
the
chamber plate andin
serted
into
afish
tank
that
contained a reservoir ofthe
solventsystem.
The
solvent system contained n- 'butanol;
acetic acid and waterin
relationship
of80:5:15
partsby
volume(v/v).
150
ml ofthe
solventsystem was present
in
the
reservoir.
6.
After
elution ofthe
chromatogramcommenced,
it
wasstopped
five
and ahalf
hours
later.
Temperature
dur
ing
the
elution and replications wasbetween
70' and78*
F.
with a relativehumidity
between
30
and50
%,
7.
The
chromatogram was withdrawnfrom
the
chamber plateapparatus and
dried,
in
an"ov^zn at room
temperature.
8.
Visualization
ofthe
invisible
developing
agentsthat
were separated
during
the
elution wasdone
by
spray
ing
with a .IN ammoniacal silver nitratesolution.
This
visualizing
reagent was preparedby
adding
,75mlof concentrated ammonium
hydroxide
to
30ml
of .INsilver nitrate.
The
chromatogram was sprayed under ablower
hood
in
arepeating
pattern with an atomizerhooked
up
to
afive
pound pressureline.
Afterwards,
the
visualizing
reagent wasdiluted,
anddumped
because
of
the
danger
ofinstability
of ammoniacal silver nitrate,
with a metric rule after
the
chromatogramhad
dried.
and
before
turning
an over-allbrown.
This
browning
occured about
twenty-four
hours
after visualization.10.
Steps
four
through
nine were repeated with solutionsone
through
eightto
obtain an estimate of experimental
error.
11.
Solutions
one'through
eight were saved and50ml
ofthe
photographicdeveloping
agent solutions wereplaced
in
an open100ml
beaker
for
overtwenty-four
hours.
This
wasdone
to
encourage aerial oxidationof
the
photographicdeveloping
agent.12.
TLC
ofthe
photographicdeveloping
agents
onethrough
eight and
their
oxidized species wasdone
by
repeating
13.
A
benzene
:methanol solvent system(90:10)
v/v wasprepared
to
replacethe
n-butanbl:acetic acid.:watensolvent system
(80:5:15).
Prior
to
deposition
offresh
samples of photographicdeveloping
agents onethrough
eight,
the
silica gel chromatogram was activated.
Activation,
was achievedby
placingthe
silicagel chromatogram
in
ad.ry
oven at100"
C.
for
fif
teen
minutes.Observations
1.
The
phenidone,
amidol and sodiumhydroquinone
28
deliberately
oxidized.
Also
an additional speciewas
formed
and. an additionalR*.
value was calculatedfor
each specieformed.
2.
The
benzene:
methanol solvent systemtook
onehour
to
-lute
10
cmup
the
chromatogram.The
Rf
values weregenerally
lower
than
the*-n-buta-nol:
acetic acid: watersolvent system and were
'much
sharper visually.3.
The
pH of n-butanol'.acetic'acid-.water solvent systemwas
2.32
andthe
pH ofthe
benzene
method solvent sys0^,
3
4
5
6
~7
9
[**
som*
J^S
CD"5
f*"t!0L
^
h*M-X'%8fe|i
'SKgP.4
fail
-*$
':%4
<:C 1.1. r__
. -. o
-'t> i- a o%1
e pa.r
-i.
Figure
12
TLC
Of ngotpgrnphp C ^-iyal";a ... .- -.
aqueous solution
fo-with
inactive
silica gel30
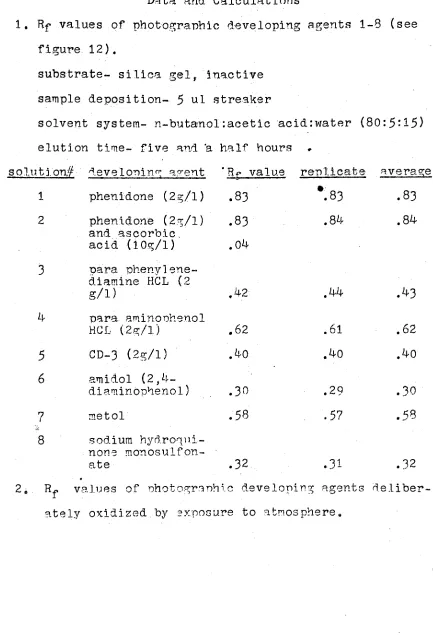
Data
and.Calculations
1.
Rf
values of photographicdeveloping
agents1-8
(see
figure
12)
.substrate- silica
gel,
inactive
sample
deposition-
5
ul streakersolvent system- n-butanol:acetic '-acid:water
(80:5:15)
elution time-
five
and'a
half
hours
solution//
developing
agent'
Rf
value replicate average1
phenidone(2g/l)
.83*.83
.832
phenidone(2g/l)
.83 .8k .8k
and ascorbic.
acid
(lOg/l)
,0k3
para phenylene-diamine
HCL
(2
g/1)
>2
.kk .kj>k
para amin.oohe.nol5
6
7
8
sodiumhydroqui
none monosulfon-ate .32 .31 .32
20.
Rf
values of photographicdeveloping
agentsdeliber
ately
oxidizedby
exposureto
atmosphere.HCL
(2g/l)
.62CD-3
(2g/l)
.koamidol
(2,4-diaminophenol
)
..30
metol .58
.61 .62
.ko .ko
.29 .30
[image:41.549.54.487.69.704.2]solutg on
ff
deyel
ooi eg a-ontR-p
values oxidized aceoi eg ~'i" ' - _-__-,. ,.-..
1
phenidone(2^4)
.87 ,27
2
phenidone(2g/l)
.84and
ascorbic
acid .08
3
paraphenylene-diamine
HCL
-43k
para aminoohenolHCL
.715
CD-3
M
6
amidol7
metol .638
sodium>
ivdrooui-.21
.04
.34
none
monculfon-ate ,34 .01
3.
Rf
values of photographicdeveloping
agents1-8
sui jsXt r-.1/ a- :->
I
j. .. a., .-i,
. i,
i
vh l, .>sample deposition-
5
ul streakersolvent system-
benzene
:methanol(904
0)
\Xve.1 ut
i
ontime- one
h
oursolution developing .^gent
R^
value replicate a,rora.ge1
phenidone(2g/l)
2
-ng-enldcre(2sr/l)
and. ascorbicacid.
3
para nhenvieuediamine
HCL
k
para, a.minophenolHCL
5
amidol6
CD-3
7
metol-45 .46 .46
. iik. .46
.45
.00 .01 .01
.34
.35 .35
.32
.33 Q-7
.07 .07 .07
.81. .42 .42
T7
32
Conclusion
1.
The
n-butanol :acetic acid:water solvent system(80:5X5),
took
five
and ahalf
hours
to
migrat*>>p
the
chromatogram.
This
wasfour
and ahalf
hours
longer
than
the
benzene
: methanol(90:10)
solvent system.
The
advantage ofthe
butanol
solvent svstem wasthat
Rf
values were obtainedfor
oxidized species ofhydroquinone,
metol,
amidol,
CD-3
an(l phenidone whenprepared,
in
aqueous solutionform
in
the
presence ofsulfite.
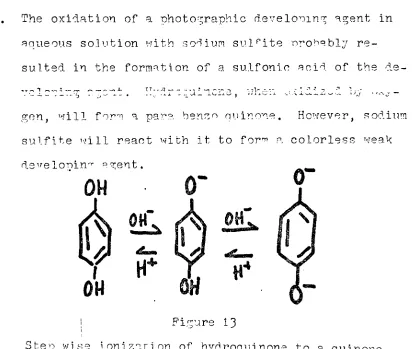
The
oxidation of a photographicdeveloping
agentin
aoueous solution with sodium sulfite
probably
resulted
in
the
formation
of a sulfonic acid ofthe
d.e-2.
gen will
form
a para benzo quinane.
However,
sod.iumsulfite will react with,
it
to
form a colorless weakdeveloping a^ent.
H"
Figure
13
[image:43.549.71.486.298.647.2]+
Ofc
Figure
14
Oxidation
ofhydroquinone
to
a parabenzo
quinone^
Figure
15
Formation
ofhydroquinone
monosulf onate3.
A
similar mechanismis
possiblefor
phenidone,
amidoland
CD-3.
The
phenld.one/ascorhi c aciddeveloper did.
not
for;!
any
additional species as compared,to
the
aheuid one/sad
i
u.m sulfite solution.This
indicates
that
ascorbicaci.d
is
a moreeffective
anti-oxidant
than
sodium [image:44.549.68.484.12.571.2]34
4.
The
sodium,hydroquinone
monosulf onateformed,
anotherspecie*,
whenoxidized.
The
authorhas
notbee.n
ableto
attribute
the
quality
ofthe
specie^
ofthe
hyd^-#uinone
monosulf
onate.
It
is
possiblethat
it
is
hydroquinone
di
sulfonate.
5.
The
benzene
:methanol solvent system gave adifferent
set of
R^
valuesfor
developing
agents1-8.
Indepen
dent
testing
of oxidized species ofthose
developing
agents did not reveal
the
oxidized speciesby
separating
themfrom
the
unoxidized species ofdeveloping
agents.
This
wasprobably
clueto
the
fact
that
the
benzena
: methanol solvent system was at a.higher
pHthan
the
otherbutanol:acetic
acid:water solventsys-6.
This
confirms Stahl' s statementthat
more acidic polarsolvent svstemg could,
be
more successfulin
separating
sulfonic acids of
developing
agents.1
It
is
for
this
reason
that
the
n-butanol solvent system was superiorto
the
less nolar andless
acidicbenzene
: methanolsol u
t i
on..7.
The
Eastman
Kodak
Company
prepared ? publication on"Separation
ofPhotographic
DevelopingAgents
Using
the
Eastman
Chromagram
System."They
reportedap^rcx-i
imate
R^
valuesfor
the
following
developing
agentsusing an activated silica gel chromatogram and a
21
Ibid.
benzene/methanol
(90:10
v/v)
solvent system.developing
agenta.
2,4-diaminopheuol
sulfateb.
hydroquinone
c.
N-methyl-p-aminophenol
sulfate(metol)
d
.l-Phenyl-3pyrazolid.one
(phenidone)
e. 4,4' -d.imethyl-1 -phenyl_3_pyrazolid
one*
The
elutiontime
wasthirty
minutes whichprobably
accounted
for
the
difference
in
Rf
values.Also,
th.
silica, sheet used,
in
Obiective
1
was not activated.Rf
value.08
*
.15
.25
.30
36
OBJECTIVE
II
Procedure
1.
Two.
per cent solutions ofmetol,
hydroquinone,
pheni-done
andCD-3
were preparedin
a manner similarto
the
proceeding
procedurein
part1,
stction1.
2.
2
5
ml of eachdeveloper
solution was placedinto
a100
ml volumetricflask
and mixedtogether.
3.
5
ul ofthe
solution, wasdrawn
by
a micro-pipet andthe
spot was placed on an activated silica chromatogram
20
mmfrom
the
bottom
edge and60
mmfrom
the
left
edge.The
5
ul sample wasdeposited
onthe
chromatogram
twenty
minutes afterthe
chromatogramhad
been
activated.4.
A
benzeue/meth.anol
(90:10)
v/v solvent system was prepared and
1.50
ml ofthe
solvent system was Placedin
the
reservoir.5.
The
spotted- chromatogram was placedin
the
chamberplate and. e
luted,
for
onehour
in
the
first
solvent system.6,
After
ejlution,
the
distance
the
even solventfront
.4traveled,
was measured.8.
Following
the
90* counter-clockwise rotation ofthe
chromatogram,
the
chromatogram was placedin
the
second solvent system
(n-butanol:acetic
acid:water; andeluted
for
one and ahalf
hours.
The
distance
solvent system
two
traveled
was measured.9.
The
chromatogram wasdried
for
twenty
minutes andvisualized with
the
ammoniacal silver nitratevis-ualization
reagent.
10,
After
the
chromatogram wasdry,
two
dimensional
Rf
values were measured.
Observations
1,
The
separations ofthe
developing
agent aresharp
py-ir! saparcite frpm pne
another^
mvionc. mcici little problem
in
recognizing
them
since each was separatedfrom
one another.
2.
There
was a slight uneven solventfront
travel
during
the
second, elutionin
both
trials.
3.
Before
performing
the
two
dimensional
TLC,
it
washelpful
in
spotting
-u additional sample of substanceson a margin of
the
chromatogram..This
was notto
be
run with
the
other sampleduring
the
second,elution.
By
removing
the
margin samplefrom
the
rest ofthe
chromatogram. after
first
elution andvisualizing
it
before
the
second elution ofthe
otherhalf
ofthe
38
of
the
separation ofsubstances
during
the
first
e-lution.
4.
Figure
1'6
showsthe
chromatogramin
two
parts.
Part
a
is
the
chromatogram
that
had
the
solution offour
developing
agents spottedin
the
lower
left
hand,
corner,
elutedin
the
verticledirection
withthe
ben-zene/methanol solvent
system,
rotated 90' counterclockwise and
eluted"
in
the
second sodvent systemwith
the
n-butanol:acetic acid:watersolven.tsystem,
and
then
visualized.
Part
b
wasthe
chromatogramthat
had
four
separate samples of eachdeveloping
agent
deposited.
20
mmfrom
the
bottom
edge and eluted
vertically
withthe
benzene
/methanol
solvent sys [image:49.549.64.492.73.450.2]a)
b)
Figure
16
[image:50.549.96.374.154.712.2]40
Data
ar-1Calculations
Rf
coordinatesfor
developing
agents:(l)
replicateaverage.
(1)
replicate averageRf(x)
Rf(x)
Rf(x)
Hf(y)
Hf(y)
Rf(y)
1.
.28.29 .29 .74 .76 .75
2.
.38.39 .39 .50 .52 .51
3.
-43 .44 .44 .69*
.73 .71
4.
.36 .40 .33 .34 .35 .351.
hyd.roqu
i
none,
2.
metol3.
phenidone4.
CD-'5,
Conclusion
1,
Two
dimensional
TLC
canimprove
the
separation ofphotographic
developing
agents preparedin
a solutionand.
deposited
on a chromatogram.2.
Elution
time
withthe
t'^o
solvent systems requiredonly
three
hours.
3.
Reversing
orchanging
the
order of elution will alsochange
the
Rf
coordinates.Prior
to
the
first
elution,
the
chromatogram was .activated.After
the
first
elution.the
chromatogram was not cmtiimt4.but
air
dried,
in
preparationfor
the
second, elution.It
v/qg possible
that
there
was a stationary methanolphage
during
the
second, elution.It
appeared,that
benzene
or methanolleft
over fromthe
first
elutiondid
not effectthe
separation ofthe
developing
In
other words,if
the
second elution was continued.to
five
and ahalf
hours
withthe
n-butanol :a.aoticacid: water solvent
system,
the
Rf
values would*o
approximately
the
same(as
Objective
I).
4.
Providing
there
is
good even solventfront
travel
during
both
elutions,
experimental error should,be
42
OBJECTIVE
III
Procedure
1,
A
silica gelchromatogram,
20X20
cm,
*was usedfor
de-positing
eight samples ofthe
hydroquinoTre'd:eve4oper
solution,
2.5
cm apartfrom
one another and2.0
cmfrom
the
bottom,
edge ofthe
chromatogram.2.
Solutions
ofhydroquinone
for
quantitativeTLC
wereprepared,
from
stock solutions ofhydroquinone
and sodium
sulfite.By add.ing
proper volume of eachstock solution the concentration of
yivd^oouincro
,-*cset at one of
the
four
levels.
3.
The
four
levels
ofhydEroquinone
were set at .5,1.0,
5.0
and10.0
g/1.The
sodium sulfite concentrationwas set at
10
g/1 and100
g/1. pH was ad.iu.sted.to
9,
11,
or13
with6N
sodiumhydroxide
afterthe
solutionwas
brought
up
to
90%
ofthe
final
volume.A
1%
a_queous solution of sodium sulfite was used,
to
bring
the
developer
solutionup
to
final
volume.
4,
The
hyd.roauinone
stock solution was prepared,in
the
following
manner:a
500
mldistilled
water at125*
F.
c
20
g
bydrnnuiuone
d
10
g
sodium sulfitee bring
level
to
11
volume with ,1%
aque-
&
sodium sulfite solution
f
stopper and. recorddate
of preparation5.
The
sodium sulfite stock solution was preparedin
the
f
ollowi.p.
g manner: *a
750
mldistilled
water at75'
F.
b
200
g of sodium sulfitec
bring
level
to
11
volume6.
Table
I
was constructedto
indicate
the
proper volumeof stock solutions of
hydroquinone
(I)
and sodium sulfite
(II)
to
be
used,to
formulate
developer
solutions-*
Table
I
run stock
2.50
pit
i
opI
ml
S
t
OC'.' s0'
4.75
j
\^t,i
on.II
ml
ad
ius
t pHto
1,5
02,6
5.00
ml4.
=,0
mi6
3,7
25.00
ml2.50
ml Qk
,
8
50.00
ml0.00
ml9
13
2.
$ mlko
,7 4 ml0
10
)
14
5!o
mlkq.
--.o n.9
11,15
25x0
m.l47.50
r-i1
9
1
2,16
50.00
ml45.00
ml.9
17,21
2.5
ml^-75
ml11
13,22
5.0
ml4.50
ml11
19,2-3
254)
ml2.50
ml11
20,24
50.O0
ml.0.OQ
ml11
25
,?9
2.5
ml49.75
ml
11
26,30
5.0
ml LiO tqp
ml11
op 01
^ i , ^-1-
25.00
ml87.40
ml.11
44
run33,37
34,38
35,39
36,4o
4l,44
42,45
43,46
44
,47
Table
I
(cont'd).
stock solution
I
stocksolution
II
2.5
ml5.0
ml25.0
ml50..00ml
2.5
ml5.0
ml25.0
ml50.0
ml4.75
ml4.5
ml2.5
ml0.0
ml49.75
"149.5
ml47.5
ml45.0
mlad
iust
pHto
13
13
13
13
13
13
13
13
The
volume of stock solutionsI
and.II
addedby
buret
for
runs1-48.
7.
Table
II
wasthe
plannedfactorial
experiment whichlisted,
each factor andlevel
ophydroquinone,
sodiumsulfite and pH.
In.
addition,
it
also listed what orderthe
experimental runs wereto
be
made.H
Y
D
R
0
Q
u
I
N
0
N
E
Factorial
Experiment
Table
II
10.0
100.
00
Q
1
1
n a1 1
5 ~.5
T
1
';
023
^'*-L 4 aA< a7 1 a2
9
45
1.0
e 18
34
102
6
42
_
22
oQ
14
op''-6
5.0
a 1 0 7411
27
'
g
7
90 co45
"314?
10.0
u
80
a8
12
28
'!4
a
24
4.0
1.6
n 't.C.run
1
71
2
?
[image:55.549.54.491.53.701.2]8,
For
eachday,
sixteen runs weredone.
There
weretwo
chamber plate
apparatuses.
The
first
chamber platewas
confined
to do
runsthat
had
10
g/l concentrationof sodium
sulfite.
The
second chamber plate was confined
to do
runsthat
had
100
g/1 of sodium sulfiteconcentration.
A
chromatogram placedi