421 2014 by The University of Chicago. All rights reserved. 0192-3234/2014/0043-0006$10.00
Tseloni
Why the Crime Drop?
A B S T R A C T
The “crime drop” is the most important criminological phenomenon of modern times. In North America, Europe, and Australasia, many common crimes have fallen by half or more since the early 1990s, albeit with varia-tion in the specifics. Seventeen explanavaria-tions are examined here including demographics, policing, imprisonment, drug markets, and lead poisoning. Pioneering research relevant only to the United States now appears, with the benefit of hindsight, somewhat parochial. Sixteen of the 17 hypotheses fail one or more of four evidence-based standardized tests on which they are assessed. The one that passes is the security hypothesis, underpinned by crime opportunity theories. Here there is strong evidence that vehicle theft fell because of more and better security, and mounting evidence that improved security was critical in reducing burglary and other acquisitive crime. Many crime types are interrelated, while most criminal careers are dominated by property crime, so removing these volume crimes might be expected to reduce violence.
I. Introduction
Truth is stranger than fiction. Twenty-five years ago, had anyone the audacity to suggest that crime would soon embark on a steep and pro-longed decline in most advanced countries, he or she would have been laughed out of the room. It was unthinkable! Hence while it is popular
Electronically published October 1, 2014
to start essays such as this by pillorying those criminologists who pre-dicted crime’s incessant rise, it is rarely acknowledged that such views were almost universally held. This essay will not make predictions. It will, however, provide theory and evidence to help explain why crime has declined and conclude with policy recommendations for sustaining the crime decline and extending it to crimes that are currently increas-ing, such as Internet-related crime, smartphone theft, and other iCrime.1
Has crime really declined? Where, by how much, and with what variation? This is the topic of Section II that follows. There is emerg-ing scientific consensus regardemerg-ing the existence of an international crime drop, with remaining debate focusing on the specifics. The most reliable sources of information are victim surveys, particularly the na-tional surveys of England and Wales, France, the Netherlands, and the United States, all of which find many types of common or street crimes, such as assault, burglary, and car crimes, to have declined dra-matically since the 1990s. National sources are buttressed by the In-ternational Crime Victims Survey, the only methodologically standard-ized general victim survey, and it indicates the international nature of crime’s decline. While supplementary sources including police-recorded crime data, health data, and insurance data are each individ-ually less reliable, the extent of supporting evidence they provide is rather overwhelming: the likelihood that so many different sources in different places point in the same direction by chance is infinitesimally small. There is variation in when, by how much, and which crime types have fallen, but such variation around the mean is to be expected in the real world and adds to overall credibility. An overview of this evi-dence is given in the first section of this essay, but there is no real diversion from the general theme: crime has declined in many ad-vanced countries, though sometimes with considerable variation in the timing and trajectory.
Why has crime declined? This is the subject of Section III of this essay. Seventeen hypotheses are examined. Much of the pioneering research focused on declining violence in the United States, exem-plified by the landmark collection of studies edited by Blumstein and Wallman (2000). This seems to form a natural “phase 1” of research
1Roman and Chalfin (2007) use the term “iCrime” to refer to theft of attractive
that was highly innovative and informative but that has been rather superseded by the emergence of what is here characterized as phase 2 crime drop research: growing recognition of the international nature of the crime drop and the importance of declining property crime. Explanations proposing that crime fell because of particular character-istics of the United States now appear somewhat parochial. The clear-est evidence for this comes from Canada, which has similar crime trends and strong socioeconomic and cultural links but significantly different policies in many of the areas where explanation has been sought. The suggestions that crime fell because of legalized abortion or a decline in lead poisoning of children appear unable to account for the fact that offending rates fell among other age groups, not just those born in the 1970s who reached peak offending ages in the early 1990s. The demographics hypothesis suggests that crime rates fell because of an aging population. This and many other hypotheses suggest that crime fell because of a decline or relative decline in either the number or motivation of offenders, and such hypotheses seem unable to explain why some crime types, such as phone theft and e-crimes, have in-creased when others have fallen.
be-cause much violence would likely be linked with acquisitive crime in some way.
This essay concludes that the security hypothesis, nested in the the-oretical framework of crime opportunity theory, rational choice, and routine activities, offers the most likely explanation for why crime has declined in many countries. On the basis of this conclusion, the main policy implication is that designing-out crime should be given far greater prominence: Government and police should seek to encourage both the public and private sectors to reduce the emission of crime opportunities. This is likely to require a mix of regulation and market-based incentives and policing to reemphasize crime prevention as its primary mission and to give a far greater emphasis to problem-solving approaches.
Here is a summary of the structure of this essay. Section II examines the extent and nature of the crime drop. Section III assesses 17 hy-potheses that have been offered to explain the crime drop and finds 16 largely wanting. Section IV focuses on the the security hypothesis. It reviews strong evidence from independent research in multiple coun-tries that greatly improved security-caused property crime and acquis-itive crime to fall and that, since they are so prominent, it is possible that they triggered the fall in violence by various routes. Section V offers conclusions and recommendations.
The term “crime drop” is used in this essay in the same sense that it is used in much of the literature. It is a portmanteau term that iden-tifies broad similarities in downward crime trends since the early 1990s while acknowledging significant variation in their timing, extent, and nature. Global or international crime trends remain rather elusive be-cause of data limitations. Reasonable generalizations can nonetheless be made. Just as local crime patterns vary within countries’ broad gen-eral national trends, so too can individual countries’ patterns be ex-pected to vary within broad international trends.
II. Extent and Nature of the Crime Drop
This section gives an overview of key trends and data sources. The importance of this section is that the evidence it provides underpins the assessment of the various explanations for the crime drop that have been offered that are the subject of Section III that follows.
FIG. 1.—National Crime Victimization Survey crime rates 1976–2012 indexed to 100 in 1976. Source: Bureau of Justice Statistics.
independent sources and methodologies that indicates that crime has fallen substantially in many countries in recent years. It thereby dem-onstrates that the crime drop is not an artifact of statistics or method.
A. The United States
FIG. 2.—UCR violent crime (including homicide) and motor vehicle theft rates per 100,000
population, United States, 1960–2012. Source: Uniform Crime Reports.
relationship between car theft rates and rates of violence with a 2-year lag.2
B. Canada
There is a remarkable similarity between the UCR of Canada and those of the United States. These are held to be the best comparative source for present purposes. The reason is that while Canada conducts a national victimization survey every 5 years, its findings relating to crime trends have been significantly questioned and contradict the findings of all other sources that crime has been declining in a fashion similar to the United States. The Canadian national crime survey is conducted as part of a more general social survey by one part of Sta-tistics Canada while its findings seem to have been openly contradicted by the Canadian Centre for Justice Statistics that is also part of Sta-tistics Canada (see Farrell and Brantingham [2013] for further details;
2The Pearson correlation coefficient between auto theft and violent crime rates
see also Greenspan and Doob 2011), and so Canada’s UCR data are preferred here.
Figure 3 shows a panel of comparative crime trends for the United States and Canada for roughly similar crime types. Each chart is in-dexed to 100 in 1962 to facilitate comparison of the trends. This shows that trends in the homicide rates are very similar over time even though the per capita homicide rate in the United States is significantly higher. A visual inspection of figure 3 suggests, and as others including Oui-met (2002), Zimring (2006), and Mishra and Lalumiere (2009) have concluded, that there is a strong relationship between crime trends in Canada and the United States. Burglary in the United States appears to fall earlier than in Canada. Car theft in Canada falls rather later than in the United States, and this seems likely to reflect differences in the timing of the introduction of improved vehicle security, an issue discussed at length later in this essay. Yet it is despite these differences that the strong similarities in crime trends in the two countries are apparent.3
C. England and Wales
The United Kingdom has data of good quality. The Crime Survey for England and Wales (CSEW; formerly the British Crime Survey) has been conducted since 1982. It identifies a crime drop with timing similar to that of the United States. Again following around three de-cades of increasing crime in the post–World War II period, the house-hold crime rate peaked in 1993 and the personal crime rate in 1995 (fig. 4).4By 2012, relative to those peaks, all household crime had fallen 64 percent and all violent crime by 56 percent.5 Figure 4, panel
B, shows the rates indexed to 100 at the first survey sweep of 1981 to allow a clearer comparison of change. It demonstrates the similarity in
3Owing to a definitional difference, the comparison of rates of rape in the United
States to sexual assault in Canada is not included here, but the chart was broadly similar in nature to the others with a correlation coefficient of .81.
4The CSEW category of “all household crime” covers vandalism, burglary,
vehicle-related theft, and bicycle theft, and “all personal crime” covers theft from the person, other theft of personal property, assault (wounding, assaults with and without injury), and robbery. Unfortunately, the CSEW does not cover 1994, so the year in which crime peaked in England and Wales remains undetermined.
5From 2001 the CSEW coverage changes from a calendar year to be more akin to
428
429
the “crime drop” with the fall in household crimes including motor vehicle crime slightly preceding that of personal crime. The homicide rate is an anomaly in England and Wales. Unlike most other crime types, it continued to rise through the 1990s to a peak in 2002, after which it fell by half over the subsequent decade (Office of National Statistics 2014).
D. Australia and New Zealand
Australia and New Zealand have conducted national victimization surveys infrequently, so that information is supplemented from other sources, particularly police-recorded crime, to derive trends. Mayhew (2012) provides the authoritative review of the range of data sources and previous studies of crime trends in these countries. She concludes in relation to property crime that “the pattern of falling property crime in many industrialized countries in the last two decades or so is mir-rored, then, in Australia and New Zealand. The timing of the ‘turn’ in property crime seemed to be around 2001 in Australia according to police figures. In New Zealand, it was about a decade before—more in line with other countries” (p. 98). In relation to violent crime, “in other countries, the picture for violent crime has been more mixed, although there is evidence of some stabilization in some countries. This seems to apply to Australia in the last decade and to New Zealand at least in the previous one” (p. 98).
Among prior studies, Morgan and Clare (2007) focused on house-hold burglary in Western Australia while suggesting that trends were generally similar for other states. Following national burglary rate in-creases of 150 percent between 1973/74 and 1991/92, Western Aus-tralia experienced further increases of a quarter from 1993 to 1995 then fell by half between 1995 and 2005. This meant that the overall rate emerged a third lower in 2005, with Morgan and Clare suggesting that the decline was similar elsewhere in Australia.
be expected when newer cars are more difficult to steal (see also Lay-cock [2004] and Webb [2005] in relation to the United Kingdom).
E. The International Crime Victimization Survey
The International Crime Victimization Survey (ICVS) is the only cross-national methodologically standardized general victim survey. It has smaller national sample sizes and hence larger standard errors than most national surveys. It has been conducted in 1988, 1992, 1996, 2000, 2004–5, and for six countries for 2010 (with the 2010 data sup-plemented by some complementary studies based on the ICVS method; see van Dijk 2013). This gives a spread covering more than two decades but for a maximum of six data points, making short-term variation less easy to specify. The ICVS reveals a crime drop that is broadly similar to what has been discussed so far but for a far wider set of countries. As an independent source, it further buttresses the evidence of widespread crime declines.
Aebi and Linde (2012) suggest that there is no “general” crime drop in Europe because of a variation between countries. Few would dis-agree that there is variation between countries or that there is variation within countries and across crime types. Whether or not that means it can be termed a general crime drop is a different issue. Their analysis uses police records of crime, police records of suspects, and court con-viction statistics; while the multiple sources are useful, these data sources are not as appropriate for cross-national and over-time com-parisons as the multiple survey sources examined by van Dijk and Tse-loni (2012). Killias and Lanfranconi (2012) suggest, mainly with data from police and insurers, that Switzerland is the exception to the crime drop rule, though that conclusion is not borne out by the ICVS, which shows declines in most crime types in Switzerland (van Dijk et al. 2007). Overall, the preponderance of evidence seems to suggest that it is reasonable to refer to a general crime drop in Europe.
F. Evidence Relating to Violence against Women and Children
The nation-state has been the main unit of analysis so far, with par-ticular crime types and groups discussed in that context. This subsec-tion highlights key crime types or studies that tend to be excluded from such analysis or are often less comprehensively measured by some of the large-scale victim surveys.
Marshall (2012) review data sources and measurement issues relating to trends in different countries. The methodological issues are myriad because of the hidden nature of violence against women. Despite those issues, they conclude that “[there are] some similarities in the violence against women trends: in all surveyed Western countries, partner vio-lence is decreasing. Also, homicides against women are decreasing in nearly all countries, with the exception of Finland where the trend is stable” (p. 126). These positive findings were tempered by far more negative findings for violence against women in non-Western countries in particular. In a brief discussion of explanations, the authors suggest that declining violence against women in Western societies could be due to greater gender equality, improved resource availability, and changing relational lifestyles (p. 128). This hypothesis may warrant further close examination but is not discussed in detail elsewhere in this essay because there are not, to our knowledge, any existing at-tempts at empirical evaluation.
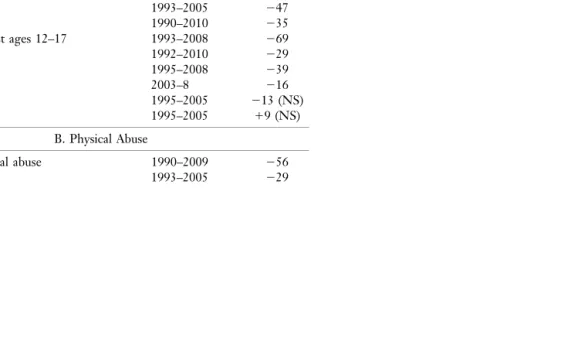
Finkelhor and Jones (2012) review evidence from different sources relating to trends in sexual abuse and physical abuse of children in the United States. The study was conducted because official sources, par-ticularly the child protection system data, had been questioned, and so this review compared such sources to self-report surveys. Our summary of their findings, shown as table 1, gives very brief coverage of a lot of information and methodological issues that are covered in detail in the original studies and by Finkelhor and Jones (2004, 2006). The conclusion of Finkelhor and Jones is worth repeating at length:
434
Abuse of Children, United States: Summary of Change in Crime Rates
Source Definition Period
Rate Change (%) A. Sexual Abuse
National Child Abuse and Neglect Data System Substantiated sexual abuse 1990–2010 ⫺62 National Incident Study Sexual abuse 1993–2005 ⫺47 Federal Bureau of Investigation Forcible rape 1990–2010 ⫺35 National Crime Victimization Survey Sexual assault against ages 12–17 1993–2008 ⫺69 Minnesota School Survey Sexual abuse 1992–2010 ⫺29 National Survey of Family Growth Statutory rape 1995–2008 ⫺39 National Survey of Children Exposed to Violence Sexual victimization 2003–8 ⫺16 National Survey of Adolescents Sexual assault—girls
Sexual assault—boys
1995–2005 1995–2005
⫺13 (NS)
⫹9 (NS) B. Physical Abuse
[image:14.612.298.584.180.354.2]435
are neglect and not physical abuse”) Federal Bureau of Investigation Homicide—children 0–17
Homicide—children 0–5
1997–2007 1997–2007
⫺43
⫺26 Acute-care hospital admissions Children!age 1
Children 1–18 admissions
1997–2009 1997–2009
⫹10.9
⫺9.1 Admissions to 38-hospital sample Children age!6
Children!age 1 (brain injury)
2000–2009 2000–2009
⫹.79
⫹3 National Survey of Children Exposed to Violence Physical abuse by caregivers 2003–8
National Survey of Adolescents Physical abuse 1995–2005 ⫺6 (NS) Minnesota School Survey Physical abuse 1992–2010 ⫺20 National Crime Victimization Survey Ages 12–17—simple assault 1992–2010 ⫺59 Ages 12–17—aggravated assault 1992–2010 ⫺69 SOURCE.—Finklehor and Jones (2012).
less clear and sometimes conflicting. (Finkelhor and Jones 2012, p. 3)
Finkelhor and Jones (2012, p. 3) conclude that the evidence of a decline in sexual abuse of children “is about as well established as crime trends can be in contemporary social science,” which means that the evidence is compelling. Their review of trends in the physical abuse of children is slightly less conclusive, finding greater variation in the trends identified by different data sources (panel B of table 1). How-ever, they conclude that the preponderance of evidence suggests that physical abuse of children has also declined, with the most methodo-logically rigorous evidence coming from the NIS: “The strongest evi-dence that overall physical abuse has declined is the evievi-dence from the NIS. This study was specifically designed to monitor rates and it is unique in its use of exactly consistent criteria across time points” (p. 5).
G. Conclusion
This section painted a broad-brush picture of the nature of recent crime trends. It suggests that there is compelling evidence for the fol-lowing conclusions:
• There has been a significant and prolonged “crime drop” in many industrialized nations.
• The extent and nature of the crime drop appear to be more sim-ilar between more simsim-ilar countries (in Canada and the United States, e.g., there are marked similarities).
• The extent of the evidence means that the likelihood that crime drops in different countries are a coincidence is vanishingly small, which implies a causal link.
• These crime drops were generally preceded by several decades of rapidly rising crime.
III. Proposed Explanations
This section examines the competing explanations for the crime drop. The focus is those hypotheses that have been given some attention in the academic literature. The extent of supporting evidence varies by hypothesis, and some attempt is made to address this in what follows. Each hypothesis is subjected to four evidence-based tests founded on the conclusions of the preceding section. It is proposed that each test must be passed for a hypothesis to be considered potentially viable. However, passing the four tests is considered a necessary but not a sufficient condition for a viable explanation of why crime has declined. The tests are straightforward, and variations on existing evaluation cri-teria. Part of their value lies in sidestepping many of the methodolog-ical dogfights in which some hypotheses appeared to be mired.
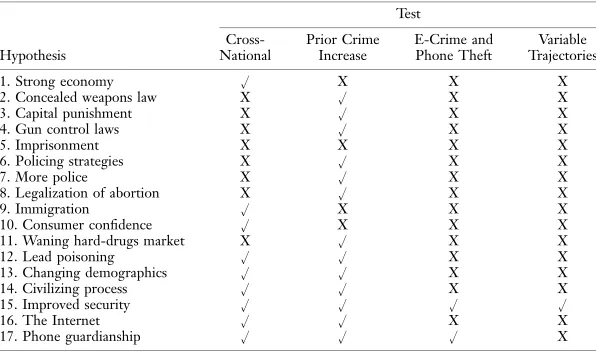
The assessment that follows finds that 16 of the 17 hypotheses fail one or more of the four tests. This is often in addition to other crit-icisms that have been leveled against them. The hypothesis that passes the tests is the security hypothesis. That hypothesis is covered only briefly in this section because it is the focus of Section IV of this essay. A summary of the results of applying the four tests to the hypotheses is given in table 3 below, but it is discussed at the end of this section.
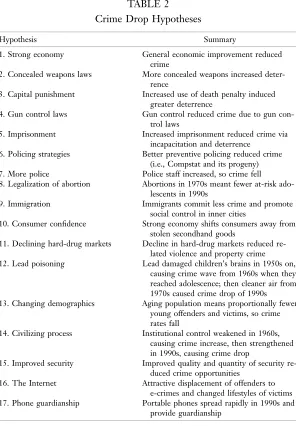
A. The Identification of Crime Drop Hypotheses
The literature does not uniformly refer to a “crime drop” by that or a similar term and so, while it is hoped that the list of hypotheses in table 2 is comprehensive, others may exist. However, the four tests outlined here can be applied elsewhere.
TABLE 2 Crime Drop Hypotheses
Hypothesis Summary
1. Strong economy General economic improvement reduced
crime
2. Concealed weapons laws More concealed weapons increased deter-rence
3. Capital punishment Increased use of death penalty induced greater deterrence
4. Gun control laws Gun control reduced crime due to gun
con-trol laws
5. Imprisonment Increased imprisonment reduced crime via
incapacitation and deterrence 6. Policing strategies Better preventive policing reduced crime
(i.e., Compstat and its progeny)
7. More police Police staff increased, so crime fell
8. Legalization of abortion Abortions in 1970s meant fewer at-risk ado-lescents in 1990s
9. Immigration Immigrants commit less crime and promote
social control in inner cities
10. Consumer confidence Strong economy shifts consumers away from stolen secondhand goods
11. Declining hard-drug markets Decline in hard-drug markets reduced re-lated violence and property crime
12. Lead poisoning Lead damaged children’s brains in 1950s on,
causing crime wave from 1960s when they reached adolescence; then cleaner air from 1970s caused crime drop of 1990s 13. Changing demographics Aging population means proportionally fewer
young offenders and victims, so crime rates fall
14. Civilizing process Institutional control weakened in 1960s, causing crime increase, then strengthened in 1990s, causing crime drop
15. Improved security Improved quality and quantity of security re-duced crime opportunities
16. The Internet Attractive displacement of offenders to
e-crimes and changed lifestyles of victims 17. Phone guardianship Portable phones spread rapidly in 1990s and
provide guardianship
hypothesis. Similarly, studies showing that the crime decline is dispro-portionately concentrated in high-crime areas relative to others (Weis-burd et al. 2004; Curman, Andresen, and Brantingham 2014; Ignatans and Pease, forthcoming) and the fact that crime declines are dispro-portionately experienced for repeat victimization against the same tar-gets (Thorpe 2007; Britton et al. 2012; Farrell and Pease 2014) are not explanations per se. In each of these cases, however, it would be ex-pected that a viable hypothesis should be consistent with these findings, and while this is not included here as a separate requirement or “test,” each warrants consideration in that respect. The ordering and termi-nology of the table are based on that of Farrell (2013). For simplicity in cross-referencing, the sections below use the numberings assigned in table 2.
B. Four Tests for a Theory of the Crime Drop
The four tests are first outlined here. Clarification of the origins and specifics of each test should emerge from what follows. The tests, with brief justification for each that should become clearer as the tests are applied to the hypotheses, are described briefly here.
1. The Cross-National Test. Can the hypothesis be applied to differ-ent countries (e.g., to Canada for hypotheses developed for the United States)?
The basis for this test is the earlier conclusions that a crime drop has occurred in multiple countries and that this cannot be a coinci-dence. Marc Ouimet’s comparative studies of crime in Canada and the United States identified not only strong correlations between the crime rates in these two counties but also key implications for crime drop research. He observes that
Zimring, shortly before publication of his bookThe Great American Crime Decline, declared his epiphany as follows:
Closer inspection showed that the timing of the Canadian decline (1991–2000) fit perfectly with the timing of the declining in the United States. The extraordinary similarity of these trends in breadth, magnitude, and timing suggested that whatever was driv-ing the decline in the United States was also operatdriv-ing in Canada. . . . But . . . Canada in the 1990s didn’t increase its imprisonment, didn’t hire more police per 100,000 population, and didn’t have anything close to the economic boom we enjoyed south of the border. (2006, p. 619)
Others have made similar observations outside of North America. Van Dijk et al. (2007) and Rosenfeld and Messner (2009), for example, both observed that crime drops in Europe cannot be due to policy or legislation in the United States. Dills, Miron, and Summers (2008) similarly conclude that we “know little about the empirically relevant determinants of crime. This conclusion applies both to policy variables like arrest rates or capital punishment and to indirect factors such as abortion or gun laws. The reason is that even hypotheses that find some support in U.S. data for recent decades are inconsistent with data over longer horizons or across countries. Thus, these hypotheses are less persuasive than a focus on recent U.S. evidence might suggest” (p. 3).
Hindsight is 20/20, and the preference here is to celebrate the pi-oneering nature of crime drop research focused on the United States while noting the general dearth of research elsewhere until rather later (Ouimet being among the honorable exceptions). However, the key point is that the evidence suggests that a hypothesis should be appli-cable in different countries to warrant serious consideration, and any that does not, without appropriate justification, should be considered suspect. This is the basis for what is here termed the cross-national test.
2. The Prior Crime Increase Test. Is the hypothesis consistent, or at least not in contradiction, with the fact that crime was previously gen-erally increasing for several decades?
issue. The extent and duration of crime increases varied, as with crime’s more recent decline, and some evidence relating to some of the prior crime increase was touched on earlier in this essay. In short, any ex-planation for why crime has declined should not be in contradiction with the fact that crime was previously rapidly increasing. This may sound rather obvious and straightforward, but as the discussion of hy-potheses below suggests, it is a test that is failed surprisingly often.
3. The e-Crimes and Phone Theft Test. Is the hypothesis consistent, or at least not in contradiction, with the fact that some crime types have been increasing while many have fallen?
The basis for this test is the fact that some types or subtypes of crime have increased during the “crime drop” when many crime types have decreased. The United Kingdom appears to have been ahead of the game in collating national crime survey data on phone theft since the 1990s and police data, at least for metropolitan London, since the early 2000s after the establishment of the National Mobile Phone Crime Unit. Mayhew and Harrington’s (2001) landmark study shows how phone theft increased in the 1990s in Britain. Yet it is now in-creasingly recognized that phone theft and robbery, and theft of similar portable electronic products including laptops and tablet computers, have been increasing in many countries. It was observed that “in 2013, 3.1 million people [in the United States] reported their smartphones stolen, up from 1.6 in 2012. More people are misplacing their smart-phones, too; last year, 1.4 million Americans lost their smartsmart-phones, up from 1.2 million in 2012” (Lowe 2014; reporting information from Consumer Reports [2014]) and “mobile device theft costs consumers $30,000,000,000 [$30 billion] each year according to the Federal Com-munications Commission” (Smartphone Theft Prevention Act of 2014 [HR 4065]). There is also strong evidence that e-crimes of various sorts relating to the Internet have increased in recent years. Clarke and Newman (2006), for example, examined e-commerce crime.
the number or motivation of offenders, then it might reasonably be expected that this would reduce all types of crime similarly. This is particularly true when it comes to phone thefts and robbery, which have increased. Theft and robbery have declined overall, but, because of phone thefts and robbery, perhaps less than other types of crime.
4. The Variable Trajectories Test. Is the hypothesis compatible, or at least not in contradiction, with variation in the timing, trajectory, and composition of crime falls both between countries and between crime types?
The basis for this test is the earlier evidence-based conclusion that there has been significant variation between and within countries in the nature of the crime drop. While the cross-national test implied an emphasis on the broad similarity in the fact that crime has declined significantly in different countries, the present test emphasizes differ-ences within that picture. For instance, homicide in the United King-dom did not begin its steep decline until considerably after the drop in most other crime types examined here. Likewise, in the United States, the NCVS identifies burglary and theft as having been in de-cline for around two decades before the major dede-cline in auto theft and violence began. Similarly, there were significant differences in the timing of the crime drop in Australia and between the trends in prop-erty and violent crime in both Australia and New Zealand. Hence within the overall “crime drop,” there are a range of significant differ-ences. The variable trajectories test proposes that any explanation of the crime drop must be compatible with, or at least not in contradiction of, this evidence.
C. Review of Hypotheses
This subsection examines the 17 hypotheses in turn. Its sequence follows that of the listing of hypotheses in tables 2 and 3.
Hypotheses 1–4: Strong Economy, Concealed Weapons Laws, Capital Pun-ishment, and Gun Control Laws. It has been suggested that crime fell because economies in the 1990s were growing rapidly, that laws allow-ing concealed weapons generated deterrence and guardianship, that the application of the death penalty deterred crime, and that stricter gun control laws meant that weapons were less freely available for use in crime.
research, being either formally discarded on the basis of the evidence offered in Levitt (2004) or implicitly dismissed by their absence from consideration in the review of Blumstein and Rosenfeld (2008).
For symmetry these hypotheses will be considered in relation to the other four tests, though it is not coincidental that they largely fail them. Many advanced countries had strong economies in the 1990s, and so that hypothesis is taken to pass the cross-national test. However, concealed weapons laws, increased use of the death penalty, and weak gun control laws are largely particular to the United States among advanced countries. They fail the cross-national test because legislation specific to that country is not responsible for reducing crime in the range of other countries experiencing the crime drop.
The basis for the original proposals that concealed weapons laws, capital punishment, and gun control laws may have caused the crime drop was that there appeared to be some fit in their timing. That is, although they may have subsequently been proved otherwise, they ap-peared to have some initial fit with the prior crime increase test. How-ever, they do not appear consistent with the fact that some crime types have increased and fail the e-crime and phone theft test. Likewise, they all offer little by means of explaining differences in the timing of the crime drop between crime types or in the timing and trajectories be-tween countries, and so they fail the variable trajectories test.
Hypothesis 5: Imprisonment. The possibility that increased impris-onment caused the crime drop is a hypothesis developed in relation to the United States. However, a recent National Research Council report notes that “over the four decades when incarceration rates steadily rose, U.S. crime rates showed no clear trend: the rate of violent crime rose, then fell, rose again, then declined sharply” (2014, p. 3). It concludes that “the increase in incarceration may have caused a decrease in crime, but the magnitude of the reduction is highly uncertain and the results of most studies suggest it was unlikely to have been large” (p. 4). This differs from some earlier findings, perhaps most notably the work of Spelman (2000), which suggested that a quarter of the crime drop in the United States was due to increased use of imprisonment.
Prison populations have since the early nineties gone up in many EU countries but not consistently so. Between 1995 and 2000 rates went down, for example, in Sweden, France, Poland and Fin-land (European Sourcebook, 2003). Sentencing policies in Europe as a whole are considerably less punitive than in the USA (Far-rington, Langan, and Tonry, 2004) and yet crime is falling just as steeply in Europe as it is in the USA. No relationship between the severity of sentencing of countries and trends in national levels of crime is therefore in evidence. (Van Dijk et al. 2007, p. 23)
Rosenfeld and Messner (2009) add weight to this conclusion with their comparative analysis of European and American imprisonment rates, finding no significant relationship. Hence, it is fair to conclude that the imprisonment hypothesis fails the cross-national comparative test and thereby, via comparison with Canada in particular, also further impugns the hypothesis in relation to the United States. Further, the major increases in imprisonment that occurred in the United States before the crime drop occurred suggest that the imprisonment hy-pothesis fails what is here termed the prior crime increase test. Like-wise, if imprisonment caused crime to drop, it is not apparent why phone theft or e-crimes would increase when other crimes fell, or how it might account for variation in the timing and trajectory of crime trends in different countries, and so it fails the third and fourth tests. Overall, there is little evidence that imprisonment played much, if any, role in the crime drop even in the United States, and no evidence that it played a role in most other countries experiencing a crime drop.
mean that policing strategies cannot affect crime. There is clear evi-dence that they can in some instances, particularly when resources are focused where crime is concentrated, and especially by use of problem-oriented policing focused on repeat victimization (Grove et al. 2012) or target crime hot spots (Braga, Papachristos, and Hureau 2012). Sim-ilarly, there is also evidence that increased police numbers may reduce the crime rate (Lin 2009). However, this is a different issue and does not overcome the timing problem noted above.
Both policing hypotheses also fail the cross-national test because other countries did not experience the increases in police numbers, or changes in strategies, that were proposed as causal for the United States. Similarly, if policing had induced the drop in many types of street crime, this could reasonably be expected to similarly have an impact on phone theft, and so it fails the fourth test. Neither policing hypothesis appears compatible with the variations in the timing and trajectory of declines in crime exhibited between countries and crime types, and so they fail the fourth test.
Hypothesis 8: Legalization of Abortion. Donohue and Levitt (2001) proposed that the legalization of abortion in the United States in 1973 was a cause of the crime drop. They argued that legalized abortion reduced the number of births of children who would otherwise be most at risk of becoming offenders in their teenage years. The evidence and methodology of this work have been revised and updated and remain significantly disputed, most notably by Joyce (2009, 2011). In partic-ular, it is not clear that Cook and Laub’s (2002, p. 23) criticism has been addressed. They concluded that “the timing of the downturn is simply wrong for legalized abortion to be the driving force” of the crime drop. They argue that the age cohorts that would experience reduced offending do not coincide with the timing of the crime drop. Thus Cook and Laub suggest that the crime drop must be due to period effects, that is, something changed at around the time that crime dropped rather than many years earlier. This is a significant criticism that also applies to the lead poisoning hypothesis addressed later in this essay. The point is reiterated by Blumstein and Rosenfeld (2008) in their review for the National Research Council. They conclude that “the important omitted variables in the initial analysis and the repli-cations showing no significant effect suggest that any such effect [of this hypothesis] is likely to be quite small” (p. 27).
fur-ther light on the validity of this hypothesis. An in-depth analysis of abortion rates and crime in the United Kingdom (Kahane, Paton, and Simmons 2008) could identify no evidence to support the hypothesis in that country, and Zimring (2007) suggests that this is true elsewhere. Dills, Miron, and Summers (2008) compare homicide rate trends from around 20 countries to the timing of abortion legalization laws. They conclude that “while the data from some countries are consistent with the [abortion legalization] hypothesis (e.g. Canada, France, Italy), several countries’ data show the opposite correlation (e.g. Denmark, Finland, Hungary, Poland). In other cases crime was falling before legalization and does not decline any more quickly (20 years) after legalization (e.g. Japan, Norway)” (p. 17). Hence the hypothesis ap-pears to fail the cross-national test. It can be taken to pass the prior crime increase test for present purposes since the purported fit with the timing of the crime drop is its key feature. However, it fails the phone theft and e-crimes test because, if abortion reduced crime across such a wide range of crime types, it is unclear why it would not also affect these crime types (phone theft in particular). Similarly, the tim-ing of its effect would be expected to be somewhat uniform, and so it cannot account for the variations detailed in relation to the variable trajectories test even within the United States, where burglary and theft had been declining for significantly longer than violent crime. Overall, the preponderance of evidence suggests that the abortion hypothesis contributes little, if anything, to explanations of crime’s decline.
Hypothesis 9: Immigration. The notion that immigration might have induced the crime drop appears to have been floated in a news article by Sampson (2006) and furthered in Sampson (2008). In a more ex-tensive empirical examination of the immigration hypothesis, Stowell et al. (2009) claim that it accounts for 6 percent of the crime drop.
FIG. 5.—Number of persons naturalized annually in the United States (plus exponential trend line withR2p.88). Source: Department of Homeland Security,Yearbook of Immigration Statistics
2013, table 20.
States, the relationship with rapidly decreasing crime may be somewhat spurious. At the very least this issue may warrant further examination. Aspects of two other key studies seem to lend weight to this suspicion: perhaps tellingly, Sampson’s analysis (2008; see chart on p. 29) begins in 1990 and uses a 3-year average to iron out the large annual variation in immigration, while Stowell et al.’s (2009) pooled time-series analysis appears to consider the crime and immigration relationship only after 1994.
If immigration caused the crime drop, then it is unclear why it would affect differentially phone theft or e-crime, and so it fails the phone theft and e-crimes test. Similarly, it does not appear to accommodate the variable trajectories of crime in different countries and for different crime types, and so it fails the fourth test. Hence while we despise the xenophobia that immigration seems to bring out in some sections of society, immigration seems unlikely to underpin much, if any, of the crime drop.
FIG. 6.—Annual inflation rate, United States, 1960–2013. Source: US inflation calculator, http://www.usinflationcalculator.com/inflation/historical-inflation-rates, accessed June 4, 2014.
offer an explanation for why some crimes increased when many de-creased or for the variation in the crime drop between countries and crime types, and so it fails the third and fourth tests.
In addition to the trend in inflation, two vertical lines have been added to figure 6. The first indicates 1982, which is the start date for the analysis underpinning the inflation hypothesis. The second indi-cates 1991, which is when the violent crime drop is typically identified as beginning in the United States. The inflation rate does appear to be higher, on average, between 1982 and 1990 than it was after 1990. However, the annual inflation rate before 1982 is telling. The chart suggests that, for the United States at least, a possible correlation be-tween inflation and crime that may exist in recent years is likely spu-rious: inflation fell dramatically from 1980, which was a decade or more before violent crime fell. By this analysis the “crime and inflation” hypothesis appears to fail the prior crime increase test, and the impli-cation is that, as with the consumer confidence hypothesis, it may be founded on a somewhat selective analysis.
Hypothesis 11: Waning Illicit Drug Markets. The waning crack mar-ket hypothesis appeared a strong contender in the United States (e.g., Blumstein and Wallman 2006; Blumstein and Rosenfeld 2008). A wan-ing illicit heroin market has been suggested to account for a quarter or more of the crime drop in Europe (Morgan 2014). Use of these drugs increased in the 1980s, then declined in the 1990s, and so cannot account for the similar crime trends before and after. If improved se-curity (discussed below) made acquisitive crimes harder to commit, this may have induced declines in the hard-drug markets. It is also unclear why phone theft and e-crimes would increase if most other types of crime fell as a result of the waning illicit drug market, and so it fails the third test. In addition, it is unclear how a declining crack market could explain variable trajectories in different countries and crime types, and so it fails the variable trajectories test.
recent statement examining only lead compared to assault rates sum-marizes the lead hypothesis as holding “that present period rates of adult violence are associated with spatial and temporal variation in childhood [lead] exposure, linked together by the behavioral and cog-nitive mechanisms of impulsivity, aggressivity, and depressed IQ” (Mielke and Zahran 2012, p. 49). Nevin (2007) extended the analysis to a series of developed countries where lead appeared to correlate with crime many years later, such that the hypothesis can be said to pass the cross-national test.
As with abortion legalization, Cook and Laub (2002) define the lead poisoning hypothesis as a “cohort explanation” for the crime drop. Its effect should be produced primarily on the cohort that reaches ado-lescence at the time when crime begins to fall. They offer evidence showing that the crime drop was not experienced solely as the product of a single cohort, but that the range of age cohorts of offenders, in-cluding older offenders, experienced a reduction in offending rates at this time. Similarly, in their review for the National Research Council, Blumstein and Rosenfeld (2008) also seem to dismiss the lead poison-ing hypothesis, suggestpoison-ing that “there is a clear similarity between time trends in environmental lead levels and violent crime rates lagged by 23 years. But demographic trends—the arrival and waning of the baby boom generation from the high crime ages—coincided roughly with the arrival and departure of leaded gasoline, and so the apparent effect of exposure to lead on crime rates may be confounded with demo-graphic change” (p. 27).
Dills, Miron, and Summers (2008) apply a longer-term version of what is here termed the prior crime increase test. They identify mul-tiple measures of lead exposure for the United States dating from 1910 and conclude that “all proxies for lead increased dramatically from around 1910 through 1970. If the lead hypothesis is correct, then crime should have displayed a measurable increase between 1925 and 1985. The U.S. murder rate, however, decreased between the 1930s and 1950s. The murder rate does rise from the 1960s through the mid-1970s, but much unexplained variation remains between the mid-1970s and mid-1980s” (p. 16).
the last 50 years or so. In so doing it implies that routine activity theory does not offer the compelling explanation for the post–World War II crime increases, as most convincingly argued by Cohen and Felson (1979).
The lead poisoning hypothesis also appears incompatible with recent increases in phone thefts and robbery as well as Internet-related crime. Why would they experience such large increases at a time when the hypothesis suggests that the number of motivated offenders is sharply declining? Hence the hypothesis seems to fail the phone theft and e-crimes test. In addition, the lead poisoning hypothesis appears to fail the variable trajectories test. It is unclear how it would explain some within-country variations. Violent and property crimes fall simulta-neously in some countries but at different times or at different rates in others. If the cause of both really is lead poisoning, then the patterns ought to be similar. Yet if the lead hypothesis applies only to violent crime, as implied by the omission of property crime by some studies, then how would it explain the drop in property crime? As a specific example, why would auto theft in the United States fall before violent crime? And why would homicide in England and Wales begin to plum-met only several years after the decline in many other types of common crime including other types of violence? Hence while some of the cor-relations between levels of lead in the air and some crime rates a couple of decades later are quite compelling, the overall evidence implies that these may be spurious and that while lead is clearly a nasty poison, it does not seem to explain the crime drop.
Hypothesis 13: Changing Demographics. It is well known that most advanced countries are experiencing an aging population. Hence the fact that it is easily understood may be the basis for a popular belief that demographic change induced the crime drop. If the population is aging, then the proportion of younger people who constitute those most at risk as both victims and offenders will decline and so too will per capita crime rates.
demographic change accounted for perhaps 10–15 percent of the crime drop. Hence the demographics hypothesis is included here but is likely to account for a small proportion of the crime drop at most. It passes the cross-national test since aging is occurring in many advanced coun-tries and for present purposes is assumed to pass the prior crime in-crease test, though the turning point and rate of change in crime seem too sharp to be due to demographics.
If demographic change caused rates of crime to change, then it would not be expected that rates of some particular types of theft, notably phone theft, as well as fraud and other crime conducted via the Internet, would increase, and so it fails the phone theft and e-crimes test. In addition, since demographic change might be expected to affect crime types somewhat uniformly within a country, it does not appear to account for within-country variations across crime types and so fails the fourth test.
Hypothesis 14: The Civilizing Process. The “civilizing process hy-pothesis” is derived from the work of Norbert Elias ([1939] 2000). Elias’s study is not about crime as we are discussing it here. The book’s focus is largely feudalism and medievalism. Its 45 chapters cover, among other things, developments in each of going to the bathroom, blowing one’s nose, spitting, and behavior in the bedroom. A nine-page chapter on “Changes in Aggressiveness” is mainly about the joys of battle and hunting and is closely followed by “The Life of a Knight.” The index notes two references to violence: “The civilizing process does not follow a straight line. . . . But if we consider the movement over large time spans, we see clearly how the compulsions arising di-rectly from the threat of weapons and physical force have gradually diminished, and how those forms of dependency which lead to the regulation of the affects in the form of self-control, gradually in-creased” (p. 157). The reference to “large time spans” is telling. It refers to a very gradual change over the centuries rather than to rapid change over the course of a few years, which is our focus here. More specifically, there is no identified mechanism in Elias’s work that could explain the recent changes in crime.
perspective could be moved beyond the level of speculation and be subjected to more rigorous empirical tests” (p. 312).
LaFree (1999), Rosenfeld (2000), and Ouimet (2002) have suggested that the civilizing process may have a role to play in explaining the current crime drop. More recently, and drawing on Eisner’s studies of violence trends over the centuries, Pinker (2011) addresses the issue. Pinker’s focus is on violence but also primarily the multiple-century time spans that concern Elias and Eisner. However, the book does discuss the recent crime drop, focusing on the United States, and pro-poses mechanisms of change similar to those suggested by LaFree: “It is possible that the recent declines in crime were related to the renewed legitimacy of three traditional, and the growing support for three newer, social institutions during the last decade of the twentieth cen-tury. Declining crime rates in the 1990s may have been produced by increasing trust in political institutions, increasing economic well-being, and growing institutionalization of alternatives to the traditional two parent American family. Increasing support for criminal justice, welfare, and educational institutions in the 1990s has also put down-ward pressure on crime rates” (1998, p. 1367).
in line with Eisner’s suggestion as quoted above, the inclusion of this as a hypothesis here is generous.
The civilizing process could be assumed to have occurred cross-nationally, though the specifics of the human rights issues were likely different in the United States than in Europe and elsewhere. Similarly, in the absence of evidence to the contrary, the timing of improvements in institutional trust and support by offenders cannot be said not to coincide with prior increases in crime. However, this hypothesis fails both the e-crime and phone theft test and the variable trajectories test. If society has civilized so rapidly that homicide fell by half in a decade or so in some instances, then this is seriously contradicted by increased theft and robbery of mobile phones and the range of Internet-related crime. Similarly, if a civilizing process has occurred so rapidly and broadly, then why are there some quite significant anomalies both within countries and between countries? These are the primary reasons why this review concludes that the civilizing process offers little pros-pect of explaining the recent crime drops. In a 2000 study on US homicide rates, Rosenfeld is unable to identify an explanation and re-verts to the civilizing process as a potential catchall hypothesis. Yet his skepticism is evident, and he brilliantly captures its vagueness: “If church is the last refuge of scoundrels, ‘culture’ is the final recourse of social scientists in search of explanations when existing economic, so-cial and political theories have been exhausted” (2000, p. 157).
The security hypothesis is located within the crime opportunity the-oretical framework, which suggests that the opportunities are crime specific. This framework means that it is theoretically compatible for some crime types to increase (as opportunities for those crimes in-crease) at the same time as other crimes decrease (as opportunities for those crimes decrease). Hence since valuable phones and the Internet offered new and enticing crime opportunities, those crimes increased, and this is compatible with the fact that security improvements induced declines in other types of crime. Hence, unlike most other hypotheses, this passes the phone theft and e-crimes test. In a similar vein, since opportunities and the spread of security occurred at different times in different places and in relation to different crime types, this hypothesis is compatible with the fact that there is variation in the timing and trajectory of the crime drop between countries and with the fact that there is variation between crime types within countries. Hence the hypothesis passes the variable trajectory test.
This hypothesis passes each of the four tests and is the only one that does so. It is examined in more detail in Section IV.
Hypothesis 16: The Internet-Induced Changes in Lifestyles. “The In-ternet” is included because although there have been few studies, there is some prima facie reason to suggest that its rapid increase coincides with the rapid decrease in crime, such that “the rise in the use of the internet has very roughly coincided with falls in crime (in 1995 use of the internet was not widespread). As it became more popular, it may have helped to occupy young people’s time when they may otherwise have turned to crime. It also provides more opportunity for online crime which is not as easily quantifiable at present as traditional crime types” (Office of National Statistics 2013, p. 7). There is also the sug-gestion that “lifestyle and routine activity changes, plus perceptions, may have a larger explanatory role in relation to other crime types. The rise of the Internet has roughly coincided with the declines in crimes that get measured in traditional victimisation surveys, and took place sooner in the US. Coincidence? Perhaps the huge criminal op-portunities presented by the Internet sucked some offenders away from traditional street crimes into online offending that is less routinely or easily recorded” (Farrell et al. 2008, p. 21).
few years. This makes it implausible that the Internet caused the crime drop. Further, the spread of the Internet was most tardy in the least affluent areas and comprised dial-up connections (remember the screech?) and often pay-per-minute connections for many years. Any significant effect on the lifestyles of potential offenders and victims could have taken effect significantly only after the precipitous crime declines began. This review has not been able to identify a peer-reviewed study of the role of the Internet in the crime drop, but its importance is such that it receives attention in relation to most things and so is deemed worthy of brief discussion. At most, it is conceivable that the Internet has induced lifestyle changes for both potential of-fenders and potential victims (with consequent impacts on guardianship if everyone stayed home more) that have had a subsequent consolida-tion effect significantly after the crime drop began.
Hypothesis 17: Phone Guardianship. The final hypothesis included here is that the rapid spread of mobile cell phones occurred around the time that crime was falling, which may have a causal connection if phones enhanced personal guardianship (Farrell et al. 2010; Klick, MacDonald, and Stratmann 2012; Orrick and Piquero 2013). Orrick and Piquero examine the correlation between mobile cell phone own-ership and both property and violent crime in the United States. They conclude, “In sum, the relationship of cell phone ownership to the property crime rate between 1984 and 2009 indicates a negative, sig-nificant association . . . but virtually no relationship between cell phone ownership and violent crime” (p. 8). This seems counterintuitive in-sofar as, if mobile phones reduce crime via guardianship, we might expect any effect to be mainly on personal crime because phones are carried on the person. Hence while Orrick and Piquero acknowledge that an association does not identify causation, the nature and existence of that causation remains to be established. This suggests that the research to date does not really provide supporting evidence other than some correlation and some general argument, while it also reveals some inconsistencies. Overall this tends to suggest that phone guardianship is unlikely to prove to be a major contributor to the crime drop and that the supporting evidence to date is somewhat less than compelling.
D. Discussion and Conclusions
TABLE 3
Findings from Four Tests
Test
Hypothesis
Cross-National
Prior Crime Increase
E-Crime and Phone Theft
Variable Trajectories
1. Strong economy X X X
2. Concealed weapons law X X X
3. Capital punishment X X X
4. Gun control laws X X X
5. Imprisonment X X X X
6. Policing strategies X X X
7. More police X X X
8. Legalization of abortion X X X
9. Immigration X X X
10. Consumer confidence X X X
11. Waning hard-drugs market X X X
12. Lead poisoning X X
13. Changing demographics X X
14. Civilizing process X X
15. Improved security
16. The Internet X X
17. Phone guardianship X
NOTE.—ppass; Xpfail.
respect to key issues. Each relates to evaluation issues more generally, and many published assessments include elements of some of the tests. Nevertheless, the tests add value through facilitating some standardi-zation of assessment criteria and allowing the wood to be seen from the trees.
As summarized in table 3, one hypothesis fails all four tests, 10 hy-potheses fail three, four fail two, and one fails only one but lacked basic evidence (phone guardianship). Most of the failures were accom-panied by a range of other criticisms, some rather damaging. One hy-pothesis passes the four tests, and that is the security hyhy-pothesis. While the tests are proposed as necessary criteria for a valid theory of the crime drop, they are not deemed sufficient, and so the security hy-pothesis is examined in the next section.
IV. The Security Hypothesis
relat-ing to how reductions in property crime, which accounts for most crime and the bulk of crime in criminal careers, may have also caused reductions in violent crimes of various types.
A. The Security Hypothesis
The security hypothesis proposes that change in the quantity and quality of security was a significant driver of declining crime:
• Security improvements, including specific security devices, vary for different crimes but have been widely implemented.
• Different security measures work in different ways to reduce the crimes to which they are applied: they increase actual or perceived risk to the offender, and/or they reduce actual or perceived re-ward for the offender, and/or they increase actual or perceived effort for the offender.
• The different ways in which security measures work produce var-iations in expected changes in crime patterns associated with crime drops. These include expected security device crime change “signatures.”
• The specific falls in crime produced by improvements in security alongside their associated diffusions of benefit (preventive effects spilling out beyond the operational range of measures; see Guer-ette and Bowers 2009) to other targets and methods of commit-ting crime are not matched by equivalent displacement.
et al. 2007, p. 23). In the context of the existing criminological liter-ature, the security hypothesis applied to the crime drop can be viewed as simply a specific version of the more general notion that situational crime prevention can be effective. In what follows, key empirical find-ings relating to the relationship between security and the crime drop are examined.
B. Vehicle Theft
With crime close to its apex in many countries, Clarke and Harris (1992) cited a study of 56 new cars that found that “the ease with which locked cars can be broken into would be laughable if it weren’t so serious. Our security tester has got into nearly all cars he has checked in a matter of seconds, using the unsophisticated tools of the car thief’s trade” (Which? 1988, p. 118; cited in Clarke and Harris 1992, p. 37). Key studies of auto theft spanning Australia, England and Wales, the Netherlands, and the United States lend support to the security hy-pothesis, suggesting that more and better vehicle security reduced ve-hicle crime and, thereby, may also have contributed to the collapse in other crime types. The following subsections describe key data signa-tures that indicate both how and why improved vehicle security was a determinant of declining vehicle theft. Eck and Madensen (2009) link such data signatures to the broader evaluation literature.
engine, transmission and 12 major body parts. The legislation also al-lowed for exemption from parts marking on some of the manufac-turer’s models if anti-theft devices were installed as standard equip-ment. It appears that these ‘anti-theft’ devices commonly consisted of electronic immobilisers” (Brown 2013, p. 12).
While the European Union formally mandated electronic immobi-lizers in new cars from 1998, the underpinning legislation had been passed in 1995, and the writing was on the wall for some time. In the United Kingdom, for instance, a car theft index had been published in 1992 (Houghton 1992), and government pressure brought to bear on vehicle manufacturers to tackle the car crime problem. Laycock (2004) identifies the car theft index and government leverage as instrumental in inducing the drop in UK car theft, and to the extent that both the introduction of immobilizers and the subsequent decline in car theft occurred in advance of other European countries, we might reasonably deduce that she is correct.
Figure 7 contains two panels. Panel A shows trends in vehicle in-security (those without in-security) for immobilizers and central locking alongside the trend in theft of and from vehicles, for England and Wales 1991–2007. The CSEW did not distinguish between electronic and other vehicle immobilizers until the late 1990s, and so panel B extrapolates backward for the trend in electronic immobilizers prior to 1999. The exponential regression line fits the known data almost per-fectly (R2p.9988), and assuming the extrapolation is correct, the tim-ing of the introduction of electronic immobilizers since 1993 fits pre-cisely with the initiation of the crime drop—just as Fujita and Maxfield (2012) found it did for the United States—and squares with Laycock’s (2004) assessment. Van Ours and Vollard (2013) similarly link the in-troduction of immobilizers in the Netherlands directly to the timing of the major drop in car theft that occurred in that country and esti-mate the theft risks of cars with immobilizers at around half that of those without.
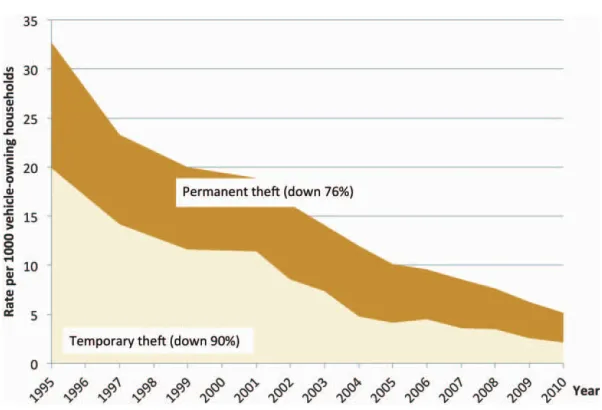
FIG. 8.—Temporary and permanent vehicle thefts per 1,000 vehicle-owning households, England and Wales, 1995–2010/11. Source: Office of National Statistics, Crime Survey for England and Wales.
immobilizers were introduced in the state of Western Australia ahead of elsewhere (Farrell et al. 2011). Consistent with electronic immobi-lizers being instrumental, the decline in vehicle theft in Western Aus-tralia began in 1998 (immobilizers had been subsidized from 1997 and were mandated in 1999), whereas immobilizers were mandated else-where for new cars in Australia in 2001, after which national car theft rates fell rapidly.
[image:43.612.65.366.209.414.2]or early-career thieves and those who are more professional or working with an organized crime group.
Temporary theft declined more rapidly and to a greater extent than permanent theft in the first decade of decline. Between 1995 and 2001, temporary theft declined by 76 percent and permanent theft by “only” 44 percent. This conforms with expectation if improved vehicle secu-rity is more likely to disrupt thefts by less experienced adolescent car thieves.
Between 2005 and 2010, however, the decline in permanent and temporary thefts was similar (50 and 48 percent, respectively). This, we conjecture, may be due to the more recent spread in tracking de-vices, which prove a highly effective deterrent. The suggestion is based on the expectation that tracking devices are unusually disruptive of the work of professional thieves. This is consistent with results of Ayres and Levitt (1998) and with detailed analyses of CSEW data to 2007 by Farrell et al. (2011) and Farrell, Tseloni, and Tilley (2011), who concluded that tracking devices were highly effective but had not pen-etrated the vehicle fleet to a sufficient extent to have played a major role in prior crime drops. From the perspective of the security hy-pothesis, the fact that permanent theft also declined dramatically is notable because it suggests that security can be highly effective against professional and organized crime.
The findings reviewed here for England and Wales are largely rep-licated in Australia (Kriven and Ziersch 2007; Farrell et al. 2011). The decline in vehicle theft in Australia began around 2001, when elec-tronic immobilizers were mandated, with overall vehicle theft declining by around half in the 6 years to 2007. Here, temporary theft declined 58 percent compared to a 13 percent reduction in permanent thefts, though the proportion of permanent thefts was always significantly lower than in England and Wales.
FIG. 9.—Means of entry for vehicle theft in England and Wales, 1995–2011. Source: Office of National Statistics, Crime Survey for England and Wales.
means of entry to vehicles in 1995 was window breaking. Yet there was no decline in the prevalence of window breaking as a means of entry between 1995 and 1997, and it subsequently declined less rapidly than door and lock forcing. Likewise, other means of entry also declined but can be interpreted as likely a diffusion of benefits: even if they could enter a vehicle, offenders had learned that they probably could not steal it because of the spread of immobilizers. Hence the general decline in most means of entry, driven by the decline in door and lock forcing, appears consistent with the expected impact of improved ve-hicle security.
The analysis of means of entry to vehicles was also conducted for Australian vehicle thefts for the period 2001–7 by Farrell, Tseloni, and Tilley (2011), extending the work of Kriven and Ziersch (2007), which covered 2001–4. The data cover a shorter period, but the findings are similar to those for England and Wales: lock forcing was the dominant means of entry prior to 2001 and accounted for the bulk of the decline in means of entry, falling disproportionately relative to other means of entry that fell later and less dramatically.
if newer vehicles were more difficult to steal. Brown and Thomas (2003) and Brown (2004) found that the average age of stolen vehicles in England and Wales increased significantly as vehicle theft declined. Likewise, Kriven and Ziersch (2007) identified significant aging of sto-len vehicles in Australia after 2001 when electronic immobilizers be-came mandatory on new vehicles. Van Ours and Vollaard (2013) pro-duce similar findings for the Netherlands.
5. Horses for Courses. The Security Impact Assessment Tool (SIAT) was developed to assist in identifying the different crime reduction effects of individual security devices (Farrell, Tseloni, and Tilley 2011). It is also described later in relation to household security devices. It produced a metric that gauges the effectiveness of devices relative to the absence of security, termed the security protection factor (SPF). There is a useful parallel with sun protection factor (SPF) used for sunscreen cream, because each states the amount of time units, relative to the absence of protection, after which the owner is burned.
The analysis found considerable variation in the effectiveness of in-dividual vehicle security devices. Tracking devices produced the largest effects, but mostly too recent to account for the drop in vehicle thefts of the early 1990s. Electronic immobilizers were found highly effective. Moreover, as might be expected, newer vehicles often included com-binations of devices including built-in immobilizers, central locking, and alarms, and these produced positive interaction effects that im-proved overall security.
The best-ranked security combinations were found to reduce theft risk by a factor of 25 compared to a vehicle without security devices. The impact of devices and combinations worked better for some crime types than for others, and the patterns squared with theoretical expec-tation based on assessment of the preventive mechanism. For example, electronic immobilizers have an impact more on theft of vehicles than on theft from vehicles, while central locking systems affected both theft of and theft from vehicles. Alarms had a more modest effect generally, but this was greater against theft from vehicles than theft of vehicles. While the study acknowledges that the findings may conflate some effects of vehicle age and security quality, the strength of the findings is sufficient to conclude that, at minimum, security devices can have a considerable impact on crime and that the effect of individual devices and their combination varies by crime type.