ISSN 0256-6141
IN EUROPE
Energy policies and trends in the European Community
Number 6 December 1986
Commission of the European Communities
Directorate-General for Energy
ENERGY
IN EUROPE
Energy policies and trends in the European Community
Manuscript completed on 22. 12. 1986.
Luxembourg: Office for Official Publications of the European Communities, 1987
Catalogue Number: CB-BI-86-003-EN-C
Reproduction of contents is subject to acknowledgement of the source.
Contents
Farewell message — C. J. Audiand 5
Mr C. Maniatopoulos - the Commission's new
Director-General for Energy 9
The new 1995 Community energy objectives 10
Oil and energy prospects in the European Community:
possible pressure points in 1995 13
The Energy Council Statement on energy efficiency 18
The rational use of energy in road, rail and inland
waterway transport 19
The Chernobyl nuclear power station accident 24
Natural gas in the Community — prospects to 2000 and beyond 28
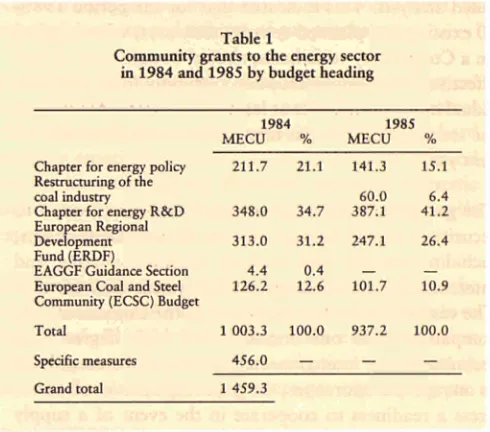
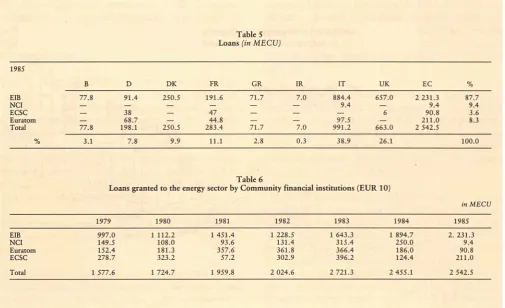
Energy financing in the European Community in 1985 32
Industrial energy investment survey in Europe 37
Short-term energy outlook 1986-87 39
Community news 53
Energy Council Environment Council European Parliament
ECSC Consultative Committee Community participation in the IAEA Non-nuclear R&D programmes New European photovoltaic newsletter Programme Valoren
EC/GCC meeting — September 1986
Commission mission to Kuwait and Iraq — December 1986 Oil import/refining developments
Energy technology projects
Hydrocarbon projects — Results of 1986 decisions Demonstration projects — Call for tender 1987 Third-party financing conference — October 1987
Conference on developments in energy saving — Berlin, October 1987
Technology focus 64
Wind energy survey
Enhanced oil recovery — Ponte Duilio project Geothermal workshop
Abbreviations and symbols
: no data available
nil
0 figure less than half the unit used
kg oe kilogram of oil equivalent (41 860 kjoules NCV/kg)
M million (IO6)
t tonne (metric ton)
t = t tonne for tonne
toe tonne of oil equivalent (41 860 kjoules NCV/kg)
MW megawatt = 103 kWh
kWh kilowatt hour
GWh gigawatthour = 106kWh
J joule
kJ kilojoule
TJ terajoule = 10' kJ
NCV net calorific value
GCV gross calorific value
ECU European currency unit. The ECU is a composite monetary unit consisting of a basket of the following amounts of each Community currency:
BFR 3.71 HFL 0.256
DKR 0.219 IRL 0.00871 DM 0.719 LIT 140
DR 1.15 LFR 0.14 FF 1.31 UKL 0.0878
EUR 10 Total of member countries of the EC before accession of Spain and Portugal in 1986
EUR 12 Total of member countries of the EC I or — discontinuity in series
of which the words 'of which' indicate the presence of all the subdivisions of the total
Farewell message from C. J. Audland
When I retired on 1 October 1986,1 had spent 13 years in the service of
the Commission, first as Deputy Secretary General and then from 1981
as Director-General for Energy. Moreover, before joining the
Commis-sion, I had, as a United Kingdom diplomat been closely concerned with
the process of European integration for some 25 years. So when the
editor of
Energy in Europe
asked me for some valedictory thoughts I felt
I would like to devote some space not only to energy but also to the
de-É
velopment of the European Community,
^ f o ^ It is difficult to form a balanced view of the Community's progress. The
Æ
M
media tend to focus on the controversies, and to pay less attention to the
**& ^^^^^^
advances. Often over the years people have asked me why the
Commun-ity appears to be permanently stuck. The answer of course is that, even
if it gives this impression to some, it is in fact constantly developing.
Perhaps I can best illustrate this by simply listing a few of the main developments in Community life
since I started working in the Commission at the time of British entry in 1973:
• Three successive enlargements. I have seen the Community move from the six original Member
States to a family of 12 nations with a population of 320 million. I doubt whether the Founding
Fathers, even at an optimistic level, would have prophesied this.
• The position of the European Parliament has been substantially improved. It was given
signifi-cant new powers in relation to budget-making by a Treaty of 1975. More important, it has been
directly elected since 1979. This has led to a qualitative change. The MEPs are now elected
specifically to deal with European Community affairs. They are mostly full time on the job. And
there are more of them. Nowadays, the ratio of MEPs to citizens is about the same as that
be-tween US Congressmen and American citizens.
• It has become a rule that our Heads of Government should meet every six months to discuss
European affairs. This is important because it means that these affairs are regularly considered at
the very highest level of government.
• The Community institutions have been given many new and important tasks. These flow for
ex-ample from:
— the establishment of the European Monetary System;
— the massive development of the Community system of borrowing and loans, especially to
promote industrial growth;
— the progressive development of a very large programme of Community support for research,
development and demonstration which now spans a huge number of industrial sectors;
— the development of a Community regional policy, underpinned by the Regional Development
Fund;
— the development of a Community programme of measures to enhance the environment;
— the development of a common fisheries policy.
• Alongside the Community's established by the ECSC, Euratom and ECSC Treaties, there has
progressively developed during the last 15 years, a vast area of purely governmental cooperation
between the 12 Member States which we call political cooperation.
This year our Heads of Government signed a treaty of substantial importance, known as the 'Single
European Act', for the further development both of the Community and of political cooperation. In
so doing they said that these two institutional arrangements had a single aim, and that they should
be seen as steps towards the still wider concept of European union.
This list illustrates some of the new developments, and is not exhaustive. Of course, these new
ac-tivities are additional to those which were already operating before 1973 — such as the common
ag-ricultural policy and the customs union.
A convinced European like myself always wants to see faster progress towards this goal of European
union than naturally occurs. Yet even so, when one looks back, and when one compares this process
of 'pre-federation' with the terrible discordances which have rent the European continent asunder so
often in the past, we can surely take a good deal of satisfaction about the point we have reached. It is
all the more remarkable when one considers that in moving towards union, we start, on the one
hand, from a large common cultural heritage and yet, on the other, from enormous disparities in
terms of language and economic and social development.
Let me now offer you some thoughts on how energy matters have progressed in the European
Com-munity during my tenure.
I became the Commission's Director-General for Energy in 1981. When I came to DG XVII it had a
good reputation both within the Commission itself and in the energy world at large.
On the administrative front
I set myself three targets. Firstly to improve the cost-effectiveness of the
organization, secondly to supplement its analytical capabilities and thirdly to disseminate
informa-tion on energy technology more widely and provide a better service to the public. I believe
sub-stantial progress has been made on all three fronts. A massive injection of electronics into DG XVII
has helped in every case both to digest, analyse and disseminate a wealth of information about the
Community's energy markets in an efficient and imaginative way.
Energy in Europe
itself is an
ex-ample of this. Likewise, much effort has been made to disseminate knowledge of our energy
techno-logy projects - particularly using the Sesame data base, which is now progressively going public. I am
delighted that Sesame now covers not only Community funded projects but also those funded by the
different Member States.
On the energy policy front
it was clear five years ago, as it is clear now, that the Community as a
major importer and user of oil for the foreseeable future would be very vulnerable to turbulent world
oil markets. Indeed when I took over the job in 1981, the price of imported crude oil was over 35
ECU/barrel and the Community was stuttering into the worst economic recession since the 1930s.
generation and support the peaceful use of nuclear energy for which the Community has unique
competence under the Treaties.
How has the Community responded to these energy policy imperatives since 1981? Although the
going has been rough at times, we have made real progress. We have set ourselves qualitative energy
objectives and attained them. We have managed to get various energy technology projects
multi-annually funded. We are maintaining a substantial energy research programme. We are prime
movers in many international energy forums (for example the IEA, the IAEA) and have greatly
ex-tended our energy relations with the oil producers, LDCs, China and other parts of the world. And
we are better prepared, today, to deal with energy crises in general. Recently the Community has set
itself new energy objectives for 1995 — among which is the objective to improve energy efficiency in
the Community by 20% by 1995 (see first article in this issue). This is a bold step and spells out the
European Community's political commitment to continue its long-term energy restructuring.
But most important I believe these energy policies are working. The Community energy balance
to-day has been radically and favourably restructured — perhaps irreversibly. For example, nuclear
en-ergy is now worth 3 M b / d of oil equivalent to the Community and today, compared to 1979, we
need 15% less energy to produce one unit of Community GDP. Substantial achievements yes, but
the end of the story, no.
Take developments in 1986 as an example. Within the space of the first five months of 1986, oil
prices had halved and the world witnessed the worst civil nuclear accident in its history at
Cher-nobyl. These two events provide new challenges to international energy policy makers. For example,
could oil demand surge again and how can international cooperation improve mechanisms for
dealing with nuclear accidents?
Energy is a vital, strategic industry and there are plenty of new challenges ahead. For example, the
challenge to complete the progress already made towards the completely free movement of goods in
a unified market. Of course, energy will have an important place. Energy is also big business which
will always produce argument, controversy and sensitive problems. There will always be issues for
the international policy-maker and the European to deal with.
Let me summarize with four policy conclusions that I derive from my five-year European energy
ex-perience. These are:
— that continuous, strong energy policies in the European Community are working and should be
maintained;
— that our energy policies should be guided by the long term, just like the thinking of the Founding
Fathers of the European Community were. We should not allow ourselves to be blown off course
by short-term disruptions;
— that the energy world is interdependent; all countries, rich and poor alike, must make efforts to
use a finite resource, sparingly;
— that we should retain enough flexibility in our energy systems to cope with unpredictable
situa-tions.
I am happy to have been able in the last few years to play a modest part in its construction. The task
is often difficult but I have found it both enriching and rewarding. I have been helped throughout by
marvellous support from Commission officials who worked for me, and I close by expressing my
warm gratitude to them.
C
J m((ftA*sJ
The Commission's new Director-General
for Energy, Mr Constantinos S. Maniatopoulos
The Commission's new Director-General for Energy is
Mr Constantinos S. Maniatopoulos
from
Greece. Mr Maniatopoulos took up his post on 17 November 1986, replacing Mr Christopher
J. Audland who has retired.
Mr Maniatopoulos was born in Patras in 1941 and is married with one son. He has degrees in
Mechanical and Electrical Engineering from the Technical University of Athens, in Business
Admi-nistration from the Graduate School of Economics and Business Sciences, and in Operations
Re-search and Statistics from the Institut Statistique de l'Université de Paris, France and is trilingual
(Greek, French, English). Mr Maniatopoulos taught at the Technical University of Athens from
1971 to 1978 and was nominated Professor of Operations Research at the Postgraduate Centre
bet-ween 1973 and 1978.
Mr Maniatopoulos has extensive industrial and energy experience. He has worked for oil
com-panies (in Paris for 1 year and Greece for 12 years) and was appointed Special Adviser to the Greek
Minister for Energy on oil matters between August 1982 and March 1984.
In March 1984 Mr Maniatopoulos was nominated Chairman and Managing Director of the EKO
group of companies — the company set up after the purchase of ESSO by the Greek State. The EKO
Group has extensive interests in investment, refining, chemicals, oil marketing and industry and it is
one of Greece's largest companies with over 1 300 employees. Mr Maniatopoulos leaves the EKO
group to join the Commission of the European Communitites.
During his working career Mr Maniatopoulos has also been General Secretary of the Technical
Chamber of Greece, Chairman of the Board of the Greek School Buildings Organization and
Mem-ber of the Boards of the Hellenic Society for Operations Research, the Hellenic Organization for
Standardization and other organizations. He was also the Secretary of the Greek Committee of the
World Energy Conference between 1978 and 1982.
New Community energy policy objectives
for 1995
A detailed review was given in
Energy in Europe No 2
of the Commission's proposal concerning
new Community energy policy objectives for 1995 and the philosophy and approach underlying the
proposal. After more than a year of negotiations the Council adopted the new 1995 objectives on
16 September in a unanimous Resolution.
The fact that the Council adopted the new energy objectives unanimously is an impressive
confirma-tion of its determinaconfirma-tion to continue to pursue an efficient energy policy.
The present situation on
the energy market, characterized in particular by the fall in oil prices and the Chernobyl accident,
has not called into question the long-term objectives of the Community's energy policy such as
oil-substitution and energy efficiency. Nevertheless, it was necessary for the Community to frame the
energy objectives for 1995 flexibly, so that long-term structural changes in the energy situation can
be allowed for.
The Commission will continue to review national energy policies in order to monitor progress
to-wards the new energy objectives. (
]) All the Community Member States are called upon in the
Re-solution to make comparable efforts to achieve these new objectives, so as to ensure that in 1995 the
Community's energy situation is secure. The objectives adopted were:
General energy objectives
• Security of supplyTo maximize security of supply and reduce the risks of sudden fluctuations in energy prices through:
— the development of the Community's own en-ergy resources under satisfactory economic conditions,
— geographical diversification of the Community's external sources of supply,
— appropriate flexibility of energy systems and,
inter alia, the development, as necessary, of network link-ups,
— effective crisis measures, particularly in the oil sector,
— a vigorous policy for energy-saving and the ra-tional use of energy,
— diversification between the different forms of energy.
Specific energy objectives
• Energy efficiencyTo achieve even greater energy efficiency in all sectors and act to highlight specific energy-saving possibilities.
The efficiency of final energy demand (2) should be
New energy policy objectives
• Cost efficiency OU
Cost efficiency in the implementation of energy policy measures.
To keep net oil imports from third countries within reasonable proportions by maintaining a policy of oil substitution and by continuing and, if need be, stepping up oil exploration and production in the Community, particularly in promising areas not yet exploited.
Oil consumption should be kept down to around 40% of energy consumption and net oil imports thus maintained at less than one-third of total en-ergy consumption in the Community in 1995.
Energy pricing Natural gas
The application, in all consumption sectors and to all forms of energy of the Community's energy pricing principles approved by the Council.
To maintain the share of natural gas in the energy balance on the basis of a policy aimed at ensuring stable and diversified supplies and continuing and, if need be, stepping up, natural gas exploration and production in the Community.
Internal energy market Solid fuels
Greater integration, free from barriers to trade, of the internal energy market with a view to ing security of supply, reducing costs and improv-ing economic competitiveness.
To pursue efforts to promote consumption of solid fuels and improve the competitiveness of their production capacities in the Community, taking into account the new possibilities opening up on the market for uses of solid fuels with greater added value.
The share of solid fuels in energy consumption should be increased.
• Environment Electricity generation
A search for balanced solutions as regards energy and the environment, by making use of the best available and economically justified technologies and by improving energy efficiency, as well as taking account of the desire to limit distortions of competition in the energy markets by a more coordinated approach in environmental affairs in the Community.
To continue with, and step up, the measures taken to reduce as much as possible the share of hydro-carbons in the production of electricity.
The proportion of electricity generated from hydrocarbons should be reduced to less than 15% in 1995.
Energy in Europe 6/1986
* Regional development
must ensure that all aspects of planning, construc tion and operation of nuclear installations fulfil optimal safety conditions;
• Renewable energy sources
The implementation, in appropriate frameworks, for those regions which are less-favoured, includ ing those less-favoured from the point of view of energy infrastructure, of measures designed to improve the Community's energy balance.
To maintain the development of new and re newable energy sources, including conventional
hydroelectricity, in particular by continuing with
the effort made by placing greater emphasis on ar rangements for disseminating results and reproduc ing successful projects.
* Technological innovation
The continuous and reasonably diversified promo tion of technological innovations through research, development and demonstration and by rapid and appropriate dissemination of the results throughout the Community.
External relations
The development of the Community's external re lations in the energy sector by virtue of a co ordinated approach, in particular on the basis of regular consultations between Member States and the Commission.
The output from new and renewable energy sources in place of conventional fuels should be substantially increased, thereby enabling them to make a significant contribution to the total energy balance.
These Community energy objectives for 1995 are ambitious but feasible. If the current reduction in energy prices persists for some time, the Commun ity will have to consider whether policies should be strengthened in order to offset weakening market signals, and thus to ensure that the agreed objec tives are achieved.
ι Readers who wish to see what changes the Council of Ministers has made in the Commission's proposals should refer to document COM(85)245. The Council Resolution of 16 September 1986 con cerning new Community energy policies for 1995 has been published in Official Journal of the European Communities, C 241 of 25 Sep tember 1986.
Oil and energy prospects in the European
Community: possible pressure points in 1995
If oil prices stay low, stronger efforts could be needed to maintain the impetus towards more
diver-sified and efficient energy demand and supply in the Community. This is the main implication of a
new examination by the staffofDG XVII of energy prospects to 1995. Assuming oil prices over the
next 10 years rise only modestly in real terms from their 1986 levels, oil consumption in the
Com-munity of Twelve could grow by well over 1 million barrels per day from its 1985 level of
9.7 million; dependence on net oil imports for total energy supply could be up to 35-37%; and
en-ergy saving improvements could slow down, perhaps sharply. The
transport
sector seems likely to
be the single most important source of pressure on oil demand.
Earlier this year the staff of DG XVII made an assess-ment of the Community energy outlook to 1990 on the working hypothesis that crude oil import prices could stabilize at around $15 per barrel (1986) prices. On that assumption, it was projected that oil demand in EUR 12 could increase by 0.7 Mb/d (35 Mtoe) or more by the end of the decade. (Energy in Europe No 5, September 1986).
More recent staff work has pushed the analysis forward to 1995, (') the aim being to explore once again the im-plications of sustained low oil prices, this time against the backdrop of the new long-term energy objectives for the Community described elsewhere in this issue.
The oil price path
The new and still preliminary estimates derive from one stylized scenario for low oil prices, which presupposes a slow growth in nominal and real terms from less than $15 in 1986 to a level in 1995 which is around half that assumed in the Commission's earlier study
Energy 2000 (2):
Energy 2000 Nominal prices Real 1986 prices Low oil price scenario Nominal price Real 1986 prices
Oil price paths
1986
32 32
13 13
1990
38 32
18 15
S fob
1995
55 36
26 18
OPEC oil supplies at such a price level. Another doubt in any case, is whether prices in the real world would adjust so smoothly to changes in demand and supply — more probable perhaps are sharper, more spasmodic move-ments. The objective of the exercise, however, was to simulate what might happen in a world in which European consumers and investors became accustomed to much 'lower' oil and energy prices than previously ex-pected, and adjusted their behaviour accordingly. Other essential features of the scenario are summarized in the box below:
Keys to the scenario
Macro-economic growth assumed to average out at around 2.6% per year over the 10-year period, after rising to a level of 2.8% in 1987. A confident investment climate and steady, though not spectacular, growth in industrial production.
The rate of exchange of the dollar against Eu-ropean currencies more or less stable
($1 = 1.07 ECU).
Oil product taxation levels unchanged in real terms from their September 1986 levels. Specific oil taxes assumed to rise in line with inflation only.
No major changes to objectives, measures or in-struments of energy policy: e.g. continuing limita-tions on oil and gas use in power generation, maintenance of existing regulatory environment for energy saving, but no strengthening of sectoral policies.
This is, of course, neither a forecast of the long-term oil price, nor an estimate of a theoretical 'equilibrium' price for oil. Some analysts believe that such a low price would be unsustainable over a 10 year period because of the build-up of oil demand and decline in higher cost
Energy in Europe 6/1986
sectors (residential and commercial, industry, transport and feedstocks) on different assumptions about the im portance attached to energy saving.
The results of the analysis are set out in the bar charts in graph 1:
It will be seen that:
• the industrial sector could make the largest call on additional energy requirements in the Community — between 33 and 48 Mtoe (0.7 and 1 Mb/d) over the period 1984-90. The precise increase will depend heavily on the rate of growth of industrial output, its composition (light versus energy-intensive industries) and the degree to which, in a low price environment, energy savings potential continues to be exploited. Oil would provide some 11-20 Mtoe of this addi tional demand, while natural gas and electricity should continue to make a good deal of headway (gas
prices will follow downward those of oil, much of electricity demand growth will be a function of factors other than price — technical changes, falling requirements for bulk process-heat, etc.);
in the residential and commercial sector the addi tional energy requirements could be very similar to those of industry (32-47 Mtoe or 0.6-0.95 Mb/d) de pending on the rate of progress in improving the qual ity of the building stock (energy improvements in older housing at least could slow down in a lower price environment) and possible changes in consumer habits (how far will thermostats be turned up?). But oil use is unlikely to rise significantly and, more probably, it will continue to fall, with natural gas and electricity developing fast, the former as a result of growing pipeline networks and competitive prices, the latter through untapped potential for specific electric ity use, steady growth of commercial demand as well as increased space-heating use in some Community countries (notably, of course, France);
Graph 1 Final energy demand 1985 & 1995
-(Low oil prices) EUR 12
Total demand
Φ4-Residential and commercial sector
Industry
900 Mtoe
Transport Non-energy use
900-r 8 0 0 7 0 0 6 0 0 5 0 0 4 0 0 3 0 0 2 0 0 -
100-0 - ΖΖΖλ ΕΖ3Ε53
/
Oil and energy prospects
• by far the largest volume of additional oil consump-tion seems likely to be derived, therefore, from the transport sector (35-43 Mtoe or 0.7-0.9 Mb/d), the bulk of it in road transport. This would reflect strong growth of diesel fuels both for road haulage and in the passenger car market (because of a continuing shift towards diesel cars). But it would also mean an in-crease in motor gasoline consumption (by perhaps 10% over the period 1985-95). This would follow from an expansion of the car stock, some 'trading up' from smaller to larger models in the case of of 'first' or family cars, and more 'discretionary' driving in an economic environment in which prices stay relatively low and real purchasing power continues to rise steadily. A further factor that could increase motor gasoline consumption is tougher legislation on exhaust emissions.
• incremental feedstock requirements for oil will be much less significant than those of the transport sector (8-10 Mtoe, or around 0.2 Mb/d), but they are far from negligible.
These results — obtained with the help of the Midas en-ergy model — are tentative and are now to be refined in the light of discussions with experts from Member States. But they already give some indication of the likely pres-sure on energy and specifically oil demand from end users of energy.
They underline the particular importance of energy sav-ing improvements in a low price environment:
• in the residential and commercial sectors at least one-third of the projected increase in energy demand (15 Mtoe or 0.3 Mb/d) could be saved by sustaining existing progress in improving the housing stock;
• and in industry a similar amount is at issue.
They also show how critical will be the evolution of de-mand for road transport fuels and the consequent im-portance of policies to ensure that they are used as effi-ciently as possible (without of course affecting economic growth). The policy questions that arise are discussed more fully in a recent Communication by the Commis-sion to the Council (3) which is summarized elsewhere in
this issue. In view of the complexity of the interactions in the transport field between the evolution of prices, in-comes, industrial growth, infrastructural development and technical progress, the Commission staff will be focusing particular attention on the prospects for
trans-port fuel demand in their further refinement of sectoral demand analysis.
Electricity generation
The future needs of end consumers include, of course, their use of electricity but not the fuels used to generate that electricity.
Could the electricity sector itself be a further point of pressure on oil supplies?
Probably not.
Our current assessment is that the lower oil price en-vironment should not lead to any large-scale switch-back in Europe to the use of heavy fuel oil in existing generat-ing plant, and still less to the construction of new oil-fired stations (which would run counter to Community legislation dating back to 1975). The electricity utilities themselves do not generally wish to go down such a route and as a rule the economics will still be against wide-spread operation of reserve or moth-balled oil capacity at the price levels envisaged. Oil use in 1995, however, could still be a little higher than previously expected if oil capacity currently in use is phased out more slowly. And natural gas use could increase a little (particularly if gas is less successful than we expect in penetrating industrial markets) because of plentiful supply, competitive pricing and environmental advantages.
Electricity sector
Total: Oil
Natural gas Solid fuels Nuclear Hydro, etc.
(energy inputs) 1985 and 1 9 9 5 , EUR 12
Mtoe
1985
348 40 22 145 123 17
1995 (Energy 2000)
443
23
19 194
187
19
1995
(Low prices) 430-457
18-30 21-32 187-205 179-185
19
All this presupposes, of course, that there are no major changes to the current programmes in Member States for the construction and operation of nuclear and solid-fuel fired electricity generating capacity, in so far as they are expected to affect capacity levels in 1995.
Energy in Europe 6/1986
Community will be completed and brought on stream and that there will be no accelerated decommissioning of any existing stations. This would lead to net nuclear ca-pacity in 1995 of 115 GWe (EUR 12).
On this basis nuclear would be supplying the equivalent of 179-185 Mtoe or 40-42% of total power station fuels, with solid fuels 187-205 Mtoe or 43-46%, the latter heavily dependent on rates of growth of electricity de-mand. Even if electricity demand grew by a little less than GDP (the bottom of our range) demand for solid fuels in the electricity-generating sector would increase by around 40 Mtoe; and more bullish growth of electricity demand could raise solid fuel burn by up to 40% or 60 Mtoe over its 1985 level even if nuclear plant is steadily introduced. This incremental demand in the electricity sector would by far outweigh the possible stag-nation in consumption of steam coal in the industrial heat markets in a low price environment and the down-ward pressure on consumption of coking coal in iron and steel.
A lower nuclear contribution would tend, other things being equal, to increase still further demand for coal and other solid fuels. But it would also lead to increased oil and gas use in power stations, adding to the pressures on oil demand coming from final energy consumers.
Community energy production
The new analysis concentrates on the effect of low prices on demand for the different fuels. No attempt has been made to quantify precisely the possible impact on Com-munity production of either solid fuels or hydrocarbons. But for the purpose of assessing possible future levels of dependence on imported oil the staff work has had to make a working hypothesis about future levels of Com-munity oil production in 1995.Before the fall in oil prices it was estimated that Com-munity oil production would decline from a peak of 150 Mtoe (3 Mb/d) in 1985 and 1986 to around 110-120 Mtoe (2.2 to 2.4 Mb/d) in 1995, largely as a result of falling output on the United Kingdom continental shelf.
What has happened since? And what could happen now?
Few existing oil field developments have been affected so far by the fall in oil prices because of their very low mar-ginal production costs. Over the period to 1990, and probably a little beyond, total production levels will be
more heavily influenced by what happens to these fields in terms of incremental investment (infill drilling, well workovers, satellite developments) than to the prospects for purely new developments. The low oil price path in the new scenario should still allow much of this relatively cheap incremental investment to go ahead, which will tend to extend the production profiles from existing fields (thus maintaining the trend of the past few years).
At a $15 real oil price, some new oil and gas fields may just be economic (on the basis of a minimum 10-15% real post-tax rate of return) assuming substantial reduc-tions in development costs (technological and design im-provements, reduced drilling rates, lower prices in construction yards, increased competition among equip-ment suppliers, etc.) induced, to a large extent, by the lower price environment. But many of the companies may now regard it as prudent to plan only on the basis of a price of $10 real, at which few known new oil and gas developments appear to be economic. Against this back-ground some new projects previously expected to go ahead in the next one to two years in the Netherlands, Denmark and the United Kingdom are already being re-timed or restructured. On the scenario described they could still be expected to go ahead in some form, but there is likely to be some reduction in previously ex-pected production from these fields in the mid-1990s.
The effect on new discoveries is difficult to assess. Oil ex-ploration and development expenditure in the Commun-ity has been cut back by around 20-30% in 1986 (slightly less than in the USA). The number of exploration and ap-praisal wells drilled and the number of rigs operating in the North Sea this year are well down. Moreover, recent surveys of companies in this field have suggested lowered levels of expected capital expenditure on North Sea fa-cilities as a whole over the next five to six years. The price environment considered here provides no basis for raising those expectations. Reduced spending on ex-ploration would not necessarily mean significantly re-duced production from new discoveries in the 1995 ho-rizon. Lower expenditure levels could be offset, to some extent, by improved finding rates and lower exploration costs. But it seems reasonable to suppose that there will be some negative effect on expected production even in the period to 1995 (earlier projections included a not in-significant element of production from new discoveries).
Oil and energy prospects
Total energy requirements
The pressures that might be created by sustained low prices are illustrated by a comparison between previous expectations of future total primary energy demand in the Community and the results of the low price case (see Graph 2). Column Β in the table below gives the projec tions emerging from the latest available submissions from Member States (most of which predate the fall in oil prices) and Column C a summary of the reference case in the Commission study Energy 2000. The differences in projected oil demand and in projected dependence on net oil imports between these projections and the more re cent analytical work (Column D) are striking.
Primary energy balance 1985 & 1995 — EUR 12
Primary energy balance 1985 & 1995 - EUR 12
Energy 2000
Mtoe
Low prices
600 500 400 300
200
100
M.
Us!
¡Ss
|Nu
d fuels
1
:lear |
1 T T T T F FffFff t t t t t TffiT
Mtoe
Total:
Primary demand Oil
(of which bunkers) Natural gas Solid fuels Nuclear Hydro, etc.
Domestic production
Oil
Natural gas
Solid fuels Nuclear
Net oil imports
1985
A
1 0 4 8
484
27
184
23 S 124 18
148 126 173 124
335
1995
Β (Member
States)'
EUR 12
1 138
470
27 190 287 165 24
113 110 196
170
373
1995 C (Energy
2000)2
1 192
496
2S 200 286 188 24
114 112 192 187
382
1995 D (Low prices)3
1 2051 255
520560
32 195205 265295 179185 2223
(100) not estimated not estimated 179185
420460
1 Submissions to the Commission in the context of the review of national energy
programmes.
2 Reference case, adjusted to include Spain and Portugal. 3 New low oil price scenario.
sponses. Further work will now be needed both to ident ify the pressure points more clearly and, ultimately, to consider what policy action may be necessary at Com munity or national level.
1985 1986 1987 1988 1989 1990 1991 1992 1993 1994 1995
It should be emphasized once again that these figures are not a forecast of the most likely outcome but rather a preliminary attempt to assess the impact which low prices could have in the absence of appropriate policy re
(') The Community Energy Outlook to 1995: a preliminary reexam ination. Working document submitted to the High Level Energy Group of the Council of Ministers, 12 November 1986.
(2) Energy 2000: a reference projection and alternative outlooks for the European Community and the world to the year 2000, Cambridge University Press, Cambridge, and Economica, Paris, 1986. (J) COM(86)393 final. Rational use of energy in road, rail and inland
The Energy Council's statement on energy
efficiency
At its meeting on energy on 26 November, the EEC Council of Ministers reviewed what progress
the Community as a whole and the individual Member States had made on energy efficiency.
The Council noted that energy efficiency in the Community has improved by over 20% since the
first oil crisis in 1973 after which the Council decided in 1974 that the Community and its Member
States must carry through a structured and integrated energy-efficiency programme. This
under-taking was reaffirmed in 1980 and 1985.
Despite the progress made, the Council felt that the present situation on the oil market might not
continue and that in any case there were still numerous opportunities for taking cost-effective steps
to use energy more efficiently.
Efficient use of energy increases security of supply, makes European
industry more competitive and has a beneficial effect on the environment.
For all these reasons, it is
even more important that the Community as a whole and each individual Member State should keep
up and if necessary step up their efforts to improve energy efficiency by 20% by 1995, one of the
ob-jectives adopted by the Council in its Resolution of 16 September
(see article in this issue).
With this aim in view, the Council has agreed that the Community as a whole and each individual
Member State:
will make the public aware of the need for greater energy efficiency by providing all the ne-cessary information and advice as to how to achieve this objective;
will facilitate the application of good new and existing ways of saving energy so as to ensure that the potential contribution to further energy savings is exploited to the full;
will hold regular exchanges of information and experience at all levels, in particular under the aegis of the Commission, on effective ways of improving energy efficiency so as to enable all interested parties to derive maximum benefit from them;
will review present methods and examine new methods of private financing in this area.
The Council reiterated the need to facilitate technologi-cal innovation in various ways through research, deve-lopment and demonstration and the rapid dissemination of results throughout the Community. The Council reaf-firmed the importance of the programmes now being conducted at national and Community level.
The rational use of energy in road, rail and inland
waterway transport
The importance of transport in the Community's energy situation
Since 1973, major energy efficiency initiatives have resulted, directly or indirectly, in at least a 20%
improvement in industry's use of energy.
And industry is now using much less oil as well
(24% of all
industry's energy use was oil in 1973, compared to no more than 17% today).
But in the transport sector, consumption of energy has increased by over 25% since 1973 —
and the
sector's 98% dependence on oil has hardly changed (see Table 1 below). Transport now accounts
for over half of the Community's oil consumption compared to one third in 1973 and will be the
most important sector in determining future use of oil in the Community (see 1995 article in this
issue). There is considerable scope for saving more energy in transport and it is important that the
momentum to do so is kept up although this could prove difficult in a low oil price environment.
This article examines the issues and considers the policy options. It is derived from the
Commis-sion's Communication to the Council on rational use in road, rail and inland waterway transport
(COM(86)93).
1973
Industry Transport Housing & Services
Total
1985
Industry Transport Housing & Services
Total
EUR 10'
248.1 128.3 264.7
641.1
EUR 10' 190.5 160.3 252.5
603.3
[image:21.595.39.554.357.591.2]Sectoral
Table 1
energy use in the European Community
Final energy consumption (Mtoe)
E2
20.3 11.3 7.3
39
P2
2.7 2.2 1.2
6.1
EUR 12 %
271.1 39.5 141.8 20.6 273.3 39.9 686.2 100
Final energy consumption (Mtoe) E2
17.8 15.2 11.3
44.3
P2
3.0 2.6 1.7
7.3
EUR 12 % 211.3 32.3 178.1 27.2 265.5 40.5
654.9 100
1 Source: Eurostat: Energy balance sheets 2 Source: OECD-IEA: Energy balance sheets
EUR 10' 104.5 124.9 149.1
378.5
EUR 10'
47.0 157.3 97.2
301.5
Proportion
E2
11.3 11.2 5.0
27.5
Proportion E2
7.3 15.0 6.8
29.1
of oil products
P2
1.7 2.1 0.6
4.4
of oil products P2
1.9 2.6 1.0
5.5
(Mtoe)
EUR 12
117.5 138.2 154.7
410.4
: (Mtoe)
EUR 12 56.2 174.9 105.0
336.1
% 28.6 33.7 37.7
100
% 16.7 52.0 31.3
100
Traffic trends in the European
v
Community
There are well-known difficulties in estimating road traffic. For example, there are problems in adopting uni-form measuring techniques or units to be used (e.g. vehicle-kilometres or tonne kilometres). Complete, pre-cise, and timely data are not often available.
Table 2 shows some harmonized data available for traffic on the railways, roads and inland waterways in
EUR 10 during the period 1973-82. It shows that traffic on non-urban roads increased steadily over the period and that on average there has been at least a 30% in-crease in traffic since 1973.
On the railways, average Community traffic went through a period of decline and then recovered its 1973 level in 1979 and 1980 before declining again in the early 1980s — affected by the poor economic situation in the Community.
Energy in Europe 6/1986
It is difficult to draw firm conclusions about the energy efficiency of the various modes of transport from the data in Tables 1 and 2. This is because the data in Table 2 relates only to the non-urban transport sector. Improvements have undoubtedly been made in the manufacturing of more energy efficient road vehicles. One estimate in Energy in Europe No 4 suggested that the Community's average motor vehicle efficiency using motor gasoline improved by about 1 1 % over the 1979-85 period. Railways too have become more efficient. A simple calculation taking the ratio between the per-centage increase (or decrease) in energy consumption and
the percentage increase (or decrease) in traffic volume in-dicates an improved efficiency of 1 % / annum or 11 % for the period 1972-83. This improvement in railway energy efficiency is probably attributable to electrification implying limited room for further improvement in the Community.
Energy efficiency objectives and
the policy framework
Objectives
Two energy efficiency objectives for the transport sector present themselves from the above discussion. They are:
— the need to continue to improve the energy efficiency of the Community's transport system;
— to encourage replacement of hydrocarbons wherever justified because of positive effects on the Commun-ity's primary energy consumption and because of re-lated financial considerations.
Policy framework
The first point is response time. Some measures such as easing traffic flow in towns and reducing speed limits should, in theory, prove effective in the short term. At the other end of the scale, technological innovations and widespread use of alternative fuels should be viewed as long term measures.
The second point to be considered is the efficiency of any proposed improvement. In other words, what percentage of the whole market, or at least the sub-sector, will be af-fected by the proposed measure? To what extent will this measure affect standard patterns of consumption or at least help to improve the energy efficiency of this specific section of the market?
The third point is the user's role. In some cases the user may play a passive role. But in other cases the user may have an important active role, for example, if the proposed measures can only be carried out with the co-operation (voluntary or otherwise) of the user.
The main policy options present
and future
Easing urban traffic flow
Effective management of road traffic by employing de-vices which control and synchronize traffic lights would have a direct effect on traffic mobility (reduced journey time, less frequent stops, traffic flows more freely) and therefore on the amount of energy consumed.
Experiments carried out in different areas of the Com-munity have demonstrated savings of between 5-10% at single intersections and 4-20% for 'green wave', i.e. syn-chronized systems.
Estimates suggest that if all 12 Member States of the Community insisted on proper control of intersection traffic lights, potential energy savings could be in the re-gion of over 1.3 Mtoe per year. (This estimate is based on a total of 175 000 intersections in the Community).
Of course, there are costs involved in the installation and maintenance of traffic control systems. But the payback period for such an investment is estimated to be only about two years.
Speed limits
Since the first oil crisis of 1973, virtually all Member States have adopted some level of speed limits on non-urban roads. These limits normally distinguish between three types of road (motorways, trunkroads and or-dinary non-urban roads) and between four types of ve-hicle (cars, buses, lorries and motor cycles). Each Mem-ber State applies different limits to each of these cat-egories. The range of speed limits extends from 100 km/h in Greece and 88 km/h in Ireland up to the 140 km/h allowed on Italian motorways. In Germany there are no speed limits on motorways at all.
Rational use of energy in transport
associated with road transport depending on the strict ness of the limit and a host of other variables. A study being carried out on behalf of Commission aims to better identify this range.
Easing non-urban traffic flow
The main factors which disrupt traffic and cause delays are roadworks, intersections, seasonal traffic peaks, stops at border crossings or toll-booths, failure to inform motorists about factors which may affect their proposed journey and different vehicle speeds reducing optimal use of road capacity. The two main responses to these problems are increased investment in infrastructure and equipment, and improved planning and information.
These two responses can include a wide range of meas ures from making roads straighter to replanning intersec tions and speeding up procedures at border crossings. Potential savings could be substantial.
Technological progress
Two main areas can be identified where technological progress could substantially improve the rational use of energy in transport. In first place comes development of new equipment components and production processes which improve not only the ratio between the weight of the vehicle and its potential payload, but also its aero dynamic performance. Secondly is basic research into combustion, distribution and the kinetics of fuels. The main thrust of combustion research is to improve com bustion chambers. Current technology has achieved out standing results in this field but there are still two major problems. Firstly, combustion chambers are still very dirty and produce quantities of ΝΟχ, CO and unburned material which are environmentally unacceptable. Se condly, the progress that has been made is mainly the re sult of empirical experimentation. There are still some stages of the combustion process about which virtually nothing is known. Some basic research is therefore
es-1973 1974 1975 1976 1977 1978 1979 1980 1981 1982 1973 1974 1975 1976 1977 1978 1979 1980 1981 1982 1973 1974 1975 1976 1977 1978 1979 1980 1981 1982 Β 42.3 44.5 39.2 39.7 39.6 38.2 40.7 39.9 43.1 42 25.8 26.9 27.9 28.6 30.4 31.6 27 30.1 30.5 30.7 11.8 12.1 9.5 11.9 11.5 11.6 11.3 11.2 10.8 10.1 * DK 13.1 13.1 12.7 13.2 12.9 12.2 12.3 12.4 12.4 12.6 18 18.4 18.6 18.6 20.7 21.2 20.5 19 18.6 18.8 — — — — — — — — Table 2
Use of infrastructure by the three modes of transport: 1 9 7 3 - 8 2
D 323.7 322 283.6 292.8 286 291.8 316.3 317.3 308.9 295.7 176.6 176.6 193.2 195.2 202.5 209.7 214.1 231.5 226.2 227.7 F Railways: in '
302.8 311.8 288.6 303.6 295.9 301 309.9 309 297.1 292.2 Non-urban 178.9 ,175.2 201.9 212 217.8 211.8 218.1 225 225 225 Inland waterways 106.2 102 94.5 111.2 99.3 102.8 98.4 97.5 94 93.9 26 26 21.5 22.7 20.1 20.7 21 21.2 19.3 18 GR 000 million gross
3.1 4.7 roads: in '000 mi
9.1 9.1 IRL tonnes 3.4 3.4 3.4 3.4 3.3 3.5 3.5 4.2 4.5 4.4 I carried per km
131.6 134.4 126.5 133.6 135.7 135.3 138.1 138.9 133 135.8 Ilion vehicles per km
11 11.2 11.5 11.6 12.9 14.3 15.3 15.7 15.7 15 123.4 121.3 126.1 128.9 131.7 136.4 142.8 147.6 154.1 154.1 : in '000 million gross tonnes carried per
— — — — — — — — — • • • • • • • • • L 2.3 2.6 2.1 2.1 2 2.1 2.3 2.3 2 1.9 1 1.2 1.1 1.1 1.1 1.2 1.2 1.3 1.4 1.5 km _ — — — — — _ — NL 29.1 28.8 27.7 27.5 27.2 28.7 27.3 28.5 29.3 28.9 32.2 32.8 36 35.9 38.8 41.8 44.1 46.3 49 49.7 72.9 73.5 65.4 82.5 73.6 81.4 74.7 74.7 65.8 66.1 UK 159.9 159.9 162.9 162.1 162.1 159.7 159.5 156.4 151.7 138 122.1 118.5 121.3 127.1 128.3 135.8 136.2 146.4 158 163.3 .2 .2 .2 .2 .2 .2 .2 .2 .2 .2 EUR 10
1 008
1 021 947 978 965 971
[image:23.595.38.556.400.762.2]Energy in Europe 6/1986
sential for the development of clean, efficient engines. At present basic research on combustion is underway in 30 laboratories in the European Community. Much of this work is being supported by the Community's non-nu-clear energy R&D programme and most of the main motor manufacturers are involved.
It should be mentioned that the motor manufacturers themselves have made substantial progress in improving the efficiency of new vehicles and reducing specific vehicle consumption. In this connection, the Community motor manufacturers set themselves, of their own voli-tion, the goal of reducing specific consumption by 1985 by between 10 and 12% of the 1978 figures (the ref-erence year). It appears that this objective has been easily reached.
Longer-term research is also taking place to achieve more efficient use of hydrocarbons. This research covers hydrocarbon behaviour in the engine, optimization of the use of motor fuel, new additives to increase octane rating, studies concerning fuel/engine matching and specific studies concerning combustion.
Alternative fuels
In order to decrease the dependance of the transport sector on hydrocarbons, considerable attention is being paid to the potential of alternative transport fuels, i.e.
methanol and ethanol, LPG, biogas and hydrogen. Inter-est in these fuels has been sufficient to justify the coord-ination of research inside and outside the Community. The COST 304 programme has been set up to compare the main technical and scientific data produced not only in the EEC but also in Finland, Norway, Sweden and Switzerland.
Alcohol based fuels (methanol and ethanol) are probably the most likely alternative fuels because of their availabil-ity. Methanol is already being mixed with petrol in some markets and it has been demonstrated that the costs of the operation are generally justified, even taking into ac-count the fact that an extender, like TBA (Tertio butyl alcohol), has to be used in addition to the methanol. Methanol can be produced from coal, natural gas and other materials which contain carbon. It has many ad-vantages as a fuel including ease of handling, a high octane rating and is beneficial to the environment by re-ducing the proportion of lead in petrol. But a major im-pediment to the widespread use of methanol as a sole fuel are structural problems linked to the availability of
ex-tenders, like TBA, and the absence of widespread dis-tribution outlets.
For the moment, it appears that production costs will limit the use of ethanol as an alternative fuel (both ethanol produced for synthetic use and that obtained from agricultural products, generally called bioethanol). Synthesis ethanol is more expensive than methanol and
TBA, which are its main competitors. Nevertheless bioethanol is of considerable interest, particularly as it offers an outlet for some surplus agricultural products. To make bioethanol commercially attractive a compre-hensive research and development programme will have to be undertaken.
LPG (liquified petroleum gas) has been used as a motor fuel in some countries for more than 40 years. It is basic-ally a mixture of propane and butanes, the relative proportions of which can vary considerably. LPG is carried in a vehicle's fuel tank in the form of liquid under moderate pressure. Since LPG is an oil refinery by-prod-uct it is therefore closely linked to oil prodby-prod-uction. For example, the huge capacity of the refineries around Rot-terdam, the Netherlands, means that every year about 2 million tonnes of LPG are produced, of which 850 000 tonnes are used as motor fuel. The advantage of LPG is that it can be used in both petrol and diesel en-gines and it is environmentally superior to both fuels. But the disadvantage is that LPG generally reduces maximum power by 10% and cold starting is more difficult. There is also no homogeneous product for the European mar-ket, i.e. the composition of LPG is different in different countries, and there is not, as yet, a widespread and effi-cient distribution network.
Biogas as a motor fuel is unlikely to be widespread in the short term. It is currently not economic and there are as-sociated unsolved technical problems, i.e. when filling the tank biogas must be compressed to at least 200 atm.
At least three countries (France, the Federal Republic of Germany and the Netherlands) are currently carrying out research into the possibility of using hydrogen as a motor fuel. This research is still at an early stage and it is highly unlikely that hydrogen will be extensively used in road transport before the year 2000. It could however become an important fuel, mainly for environmental reasons.
Compressed natural gas (CNG) also offers some interest-ing possibilities in the future. Indeed one-quarter of a
Rational use of energy in transport
Conclusions
The transport sector offers great potential for saving en-ergy. However, the long response times associated with initiatives, the efficiency of the mechanisms chosen and the role of the user complicate the adoption of specific policies. Moreover, any action in the field of transport has important repercussions upon life-style, economic activity, the environment and town-planning. Therefore,
The Chernobyl nuclear power station accident
When
Energy in Europe No 5
went to the press reliable information was not yet available about the
sequence of events leading up to the reactor explosion at the Chernobyl nuclear power station. Since
then the Soviet authorities have lifted the veil of secrecy surrounding the accident, and at a meeting
organized by the International Atomic Energy Agency (IAEA) in Vienna from 25 to 29 August
provided essential information for an understanding of the accident. The Commission attended the
meeting in question and recently reported on this subject to the Council and the European
Parlia-ment. (') In its report the Commission also assesses the consequences of the accident within the
Community.
Sequence of events leading up to
the accident
The accident took place during the carrying-out of a test when the RBMK reactor was operating at low power just before being shut down for planned maintenance.
The aim of the planned test was to verify the possibility of using the mechanical inertia of the turbo-alternators as a source of electricity in the event of a sudden shutdown of the reactor, in order to ensure that the plant's essential safety systems were kept temporarily under voltage until the emergency diesel generators could take over. Gener-ally speaking, nuclear power stations in the West do not go in for this practice and this type of test is therefore not carried out.
The Soviet authorities have admitted that the test itself had been poorly prepared and the appropriate authoriza-tions had not been issued. Furthermore, although it was impossible to maintain the reactor's operating paramet-ers within the authorized ranges, the plant staff at-tempted to proceed with the test nevertheless, and breached several operating rules and blocked some of the reactor's protection systems.
In an RBMK reactor, because of its intrinsic characte-ristics, such breaches and action inevitably lead to a sudden increase in power with catastrophic con-sequences. The RBMK reactor is intrinsicallly unstable at low power. The Soviet authorities have known about this weakness for a long time and it was even made public back in 1974. The United Kingdom considered this type of reactor in 1976 in the context of scientific cooperation with the USSR, but rejected it on safety grounds.
Let us now attempt to explain the specific features of this instrinsic instability. Chain nuclear reactions take place within a nuclear reactor. Each fission of a uranium atom produces neutrons which in turn generate further fis-sions. Whether this chain reaction is kept in equilibrium depends on the ability of the neutrons to generate a
fis-sion; this in turn depends on parameters such as tempera-ture of fuel and density of coolant.
In an RBMK reactor the chain reaction may get out of control if the reactor is at low power and the control rods are withdrawn from the core: the slightest increase in power can then increase the quantity of steam in the core. This change in the parameters has a favourable ef-fect on the ability of the neutrons to generate further fis-sions. The increase in power is hence intensified and the reactor goes out of control until it destroys its own struc-tures. In technical terms, it may be said that the power coefficient is positive. The main safeguard protecting against such a disastrous event is compliance with the operating procedures by operators: low-power operation is prohibited and a number of control rods must remain inserted in the reactor.
The approach to safety is different in Western techno-logy. In certain types of reactor (gas or sodium cooled) a cooling fluid is used which is not liable to undergo a change of phase, thus favouring stability. Where water reactors are concerned, the most common types cf reactors in the Community, excessive evaporation or loss of coolant always results in a rapid stoppage of the chain reaction because the power coefficient is negative.
Because of these fundamental technical differences, the Chernobyl accident can scarcely be regarded as a pre-cursor or warning for nuclear technology in the West. In this respect, it is radically different from the Three Mile Island accident whose external effects were virtually nil but which influenced certain design and operating fea-tures of European pressurized water reactors.
Chernobyl accident
Chronology of the main stages
leading up to the accident
25 April, 01.00 hours: reactor power reduction starts, in preparation for the test and the planned shutdown.
25 April, 13.05 hours: power reduction sus-pended: reaction maintained at 50% of nominal power at the request of the electricity supply grid control office (this half-power waiting period made it more difficult to comply with the test procedure because of neutron 'poisoning' of the reactor which increased spatial power disequilibrium and re-duced reactivity and especially meant that the oper-ator, in order to be able to continue with the test, subsequently had to withdraw the control rods from the reactor, in breach of the operating pro-cedures).
25 April, 23.10 hours: power reduction resumed, with a view to achieving 23 to 35% of nominal power.
26 April, 0.28 hours: difficult to control the power reduction, reactor power falls to 1% of nominal power.
1.00 hours: operator succeeds in increasing reactor power but to no more than 7% of nominal power; to do this, the operator had to increase reactivity by withdrawing the control rods from the reactor, to such an extent that he breached the operating rules (the reactor is more unstable with the rods withdrawn).
1.03 hours: operator continues with the test, even though the reactor power is below the authorized
limit (the lower the power the closer the reactor is to instability).
1.19 hours: operator blocks the first emergency protection signal relating to thermohydraulic par-ameters.
1.23.04 hours: test starts: the turbine steam feed valves are stopped; the turbine continues to rotate by mechanical inertia; the reactor is kept in opera-tion so that the test can be redone in the event of failure: this entails blocking a second emergency reactor protection signal relating to turbine condi-tions (if this protection signal had operated the situation would have been saved).
1.23.21 hours: because of the test configuration, the flow of water to the reactor slowly starts to de-crease, the temperature rises, and the gradual in-crease in steam in the reactor results in an inin-crease in reactivity; the reactor became unstable; power grew slowly; automatic control rods were inserted into the reactor but could only partially offset the increase in reactivity.
1.23.31 hours: the control rods are completely in-serted and can no longer offset the increase in reactivity; power increases more quickly.
1.23.40 hours: operator pushes the emergency reactor shutdown button in vain (the emergency control rods withdrawn from the reactor can no longer act sufficiently rapidly).
Energy in Europe 6/1986
by monitoring the Soviet citizens who received a signifi-cant dose. It is hoped that the Soviet authorities will make this data available to international experts. One thing is certain — the Chernobyl accident will result in greater international cooperation on nuclear safety.
Radiation fallout from Chernobyl
within the Community
With the detection of increased radioactivity levels in the air first of all in Sweden and later in the Community, the national authorities in the Member States began ex-tensive monitoring of the environment. In accordance with Articles 35 and 36 of the Euratom Treaty, on 29 April the Commission requested from the Member States the regular communication of radioactivity read-ings.
lodine-131 deposition Bq/m2
Average Pafc
<10<
10- 10'
103 E 3 io'
104 rø Kr·
Both values rounded to the nearest order ol magnitude
Most of the radioactive emissions from Chernobyl were released during the ten-day period between 26 April and 5 May. During this period the meterological conditions over Europe changed considerably, and as a consequence the dispersion of radioactive material was widespread but very uneven, in particular because the pattern of de-position on the ground was greatly affected by localized rainfall.
29 and 30 April reached Northern Italy before moving northwards. On 1 and 2 May the radioactive plume moved towards Greece. The releases of 3 and 4 May went towards the northwest, sparing the Member States; however, subsequent releases on 5 May reached North-ern Greece and Italy between 9 and 11 May.
Levels of surface contamination in the Member States by the most important radionuclides, namely iodine 131 and caesium 134/137, as reported to the Commission by the national authorities following the accident, are
illustrated in Figures 1 and 2.
The Commission has asked the National Radiological Protection Board in the United Kingdom to estimate the resulting radiation exposure for the following pathways:
— external radiation from the cloud and deposited ma-terial;
— internal radiation from inhalation of airborne ma-terial during the passage of the cloud;
— internal radiation from ingestion of contaminated foodstuffs.
The latter pathway is the most important.
Total caesium deposition
Bq/m2
Average Peak ,2
The release of 26 April reached Scandinavia on 27 and 28 April. That of 27 April spread further southwards, passing through the Federal Republic of Germany and France, before turning through Belgium, the Nether-lands, the United Kingdom and Ireland. The releases of
precau-Chernobyl accident
tionary measures taken by individual members of the public as a reaction to the contamination resulting from Chernobyl is difficult to quantify and has therefore been ignored. Table 1 gives the individual effective doses re-ceived in the first year for each of the three age categories considered. Table 2 gives the cumulative dose in each Member State which an adult will receive over the next 50 years. The average lifetime dose (over 50 years) var-ies from 0.0003 to 0.61 mSv depending on the Member State.
The collective effective dose equivalent to the Commun-ity population, which is a measure of the potential health impact of the exposure, amounts to about 85 000 man-Sv.
Table 1
Average individual effective dose equivalents Chernobyl during the first year
Country Belgium Denmark France Germany Greece Ireland Italy Luxembourg Netherlands Portugal Spain
United Kingdom
Infant 0.110 0.110 0.068 0.230 0.420 0.130 0.160 0.120 0.089 0.0004 0.0027 0.055
caused by after the accident (mSv)
Child 0.059 0.076 0.042 0.190 0.350 0.100 0.180 0.077 0.078 0.0003 0.0017 0.037
Adult 0.051 0.063 0.038 0.190 0.350 0.100 0.210 0.061 0.068 0.0002 0.001 0.033
By way of comparison, the average annual individual doses from other sources are as follows (mSv):
Natural exposure: 1 to 2 mSv per annum
Medical exposure: 0.3 to 0.5 mSv per annum
By way of comparison, average individual lifetime doses from other exposure sources are as follows (mSv):
Natural exposure: 70 to 140 mSv
Medical exposure: 21 to 35 mSv
International organizations such as the World Health Organization, which cannot be suspected of having a nuclear bias, consider that such doses have quite insigni-ficant medium and long-term effects. It is interesting to compare these doses with the maximum permissible dose for members of the public in the event of controllable ex-posure, which, in accordance with basic Euratom stan-dards, is 5 mSv per annum.
This 5 mSv per annum value has also been recommended by the working party of radiation protection experts set up pursuant to Article 31 of the Euratom Treaty to establish the level below which it is unnecessary to take large-scale steps to withdraw contaminated foodstuffs in the first year following a nuclear accident.
It is also worth comparing the doses caused by Cher-nobyl with the doses caused by natural radiation. As in-dicated in Tables 1 and 2, the dose resulting from natural radiation is 1 to 2 mSv per annum, i.e.