This is a repository copy of In situ SR-XRD study of FeCO precipitation kinetics onto ₃ carbon steel in CO -containing environments: The influence of brine pH₂ .
White Rose Research Online URL for this paper: http://eprints.whiterose.ac.uk/121786/
Version: Accepted Version
Article:
Burkle, D, De Motte, R, Taleb, W orcid.org/0000-0003-2179-7963 et al. (5 more authors) (2017) In situ SR-XRD study of FeCO precipitation kinetics onto carbon steel in ₃
CO -containing environments: The influence of brine pH. Electrochimica Acta, 255. pp. ₂ 127-144. ISSN 0013-4686
https://doi.org/10.1016/j.electacta.2017.09.138
© 2017 Elsevier Ltd. This manuscript version is made available under the CC-BY-NC-ND 4.0 license http://creativecommons.org/licenses/by-nc-nd/4.0/
[email protected] https://eprints.whiterose.ac.uk/
Reuse
This article is distributed under the terms of the Creative Commons Attribution-NonCommercial-NoDerivs (CC BY-NC-ND) licence. This licence only allows you to download this work and share it with others as long as you credit the authors, but you can’t change the article in any way or use it commercially. More
information and the full terms of the licence here: https://creativecommons.org/licenses/
Takedown
If you consider content in White Rose Research Online to be in breach of UK law, please notify us by
Accepted Manuscript
Title:In situSR-XRD study of FeCO3 precipitation kinetics onto carbon steel in CO2-containing environments: The influence of brine Ph
Authors: D. Burkle, R. De Motte, W. Taleb, A. Kleppe, T. Comyn, S.M. Vargas, A. Neville, R. Barker
PII: S0013-4686(17)32009-1
DOI: https://doi.org/10.1016/j.electacta.2017.09.138
Reference: EA 30337
To appear in: Electrochimica Acta
Received date: 14-4-2017
Revised date: 21-9-2017
Accepted date: 22-9-2017
Please cite this article as: D.Burkle, R.De Motte, W.Taleb, A.Kleppe, T.Comyn, S.M.Vargas, A.Neville, R.Barker, In situ SR-XRD study of FeCO3 precipitation kinetics onto carbon steel in CO2-containing environments: The influence of brine Ph, Electrochimica Acta https://doi.org/10.1016/j.electacta.2017.09.138
1
In situ SR-XRD study of FeCO3 precipitation kinetics onto carbon steel in CO2 -containingenvironments: The influence of brine pH
D. Burkle,a* R. De Motte,a W. Taleb,a A. Kleppe,b T. Comyn,c S. M. Vargas,d A. Neville,a and R. Barkera
aInstitute of Functional Surfaces, School of Mechanical Engineering, University of Leeds,
Leeds, LS2 9JT, United Kingdom.
bDiamond Light Source Ltd, Diamond House, Didcot, Oxfordshire, OX11 ODE United
Kingdom.
cIonix Advanced Technologies, 3M Buckley Innovation Centre, Firth Street, Huddersfield,
HD1 3BD, United Kingdom.
dBP America, Inc., Houston, Texas 77079, United States of America.
*Corresponding Author
ABSTRACT
The growth of iron carbonate (FeCO3) on the internal walls of carbon steel pipelines used for
oil and gas transportation can reduce internal corrosion significantly. Solution pH can be
considered as one of the most influential factors with regards to the kinetics, morphology and
protection afforded by FeCO3 films. This paper presents results from a recently developed in
situ Synchrotron Radiation-X-ray Diffraction (SR-XRD) flow cell integrated with
electrochemistry for corrosion measurements. The cell was used to follow the nucleation and
growth kinetics of corrosion products on X65 carbon steel surfaces in a carbon dioxide (CO2
)-saturated 3.5 wt.% NaCl brine at 80ºC and a flow rate of 0.1 m/s over a range of solution pH
values (6.3, 6.8 and 7). In all conditions, FeCO3 was identified as the only crystalline phase to
form. Electrochemical results coupled with post-test surface analysis indicate that at higher pH,
larger portions of the surface become covered faster with thinner, more protective films
consisting of smaller, denser and more compact crystals. The comparison between XRD main
peak area intensities and FeCO3 surface coverage, mass and volume indicates a qualitative
relationship between these parameters at each pH, providing valuable information on the
2
Key words: CO2 corrosion, pH, iron carbonate, precipitation, synchrotron, X-ray diffraction
1. INTRODUCTION
The presence of dissolved carbon dioxide (CO2) in oilfield production fluids is known to
promote the internal general and localised corrosion of carbon steel pipelines through the
formation of carbonic acid (H2CO3). In particular, the potential for severe localised attack of
carbon steel in CO2-containing conditions inevitably leads to concerns over pipeline integrity
during service when transporting hydrocarbons. Observations of localised degradation are
particularly evident under conditions where protective iron carbonate (FeCO3) films have only
partially formed on or been removed from a steel surface, as this has been shown to lead to the
development of galvanic cells between the filmed area (cathode) and bare steel (anode) [1-3].
Understanding the fundamental processes governing the formation of FeCO3 and conditions
conducive to it local mechanical and/or chemical removal is essential in developing a robust
and reliable corrosion management strategy for transportation pipelines. The formation of
FeCO3 on the internal walls of carbon steel pipelines in CO2 environments is not an uncommon
observation in the oil and gas industry. When the concentration of iron ions (Fe2+) and
carbonate ions (CO32-) exceed the solubility product (Ksp) of FeCO3 in a solution, it becomes
thermodynamically possible for FeCO3 to precipitate onto the internal walls of pipelines [4]:
(1)
The FeCO3 precipitation process can dramatically reduce the corrosion kinetics of the
underlying steel by offering a diffusion barrier to electrochemically active species and by
blocking active sites on the steel surface [5]. However, the nature, morphology and protection
3
particular, factors which influence the precipitation rate of FeCO3 can have a profound effect
on how effectively the film is able to suppress corrosion kinetics of the underlying steel.
FeCO3 nucleation and growth is governed by the saturation ratio, S , which is deemed to
be the driving force behind the precipitation process [6]. S is defined as:
(2)
where Fe and CO (in mol/m3) are the concentrations of ferrous and carbonate ions,
respectively. Ksp (in mol2/m6) is the solubility product for FeCO3, which is a function of ionic
strength and temperature. At higher solution pH, higher concentrations of CO32- result in fewer
Fe2+ ions being required to exceed the solubility product of FeCO3, and generate significant
levels of precipitation [7].
The nucleation and growth of the FeCO3 layer is heavily dependent upon the kinetics of the
precipitation reaction which are governed by the surrounding environment. Such a process is
facilitated when S > 1 [8]. Although nuclei formation is thermodynamically possible at
S > 1, its rate increases rapidly only when a critical S is exceeded [9]. The process of
nucleation starts with heterogeneous nucleation, a process which is capable of occurring easily
due to the numerous imperfections on the steel surface [10]. Nucleation is then followed by
crystal growth which essentially limits the rate of precipitation.
As previously stated, the protectiveness of FeCO3 is influenced by several environmental
factors such as temperature, pH, CO2 partial pressure and Fe2+ concentration. From all the
parameters, solution pH can be regarded as one of the most important factors. As an example,
Chokshi et al.[11] demonstrated that for the corrosion of carbon steel in a pH 6 at 80°C in a CO2
-saturated 1 wt.% NaCl brine with an addition of 50 ppm Fe2+, a low bulk S was obtained
4
the steel surface resulting in a final corrosion rate of 1.8 mm/yr after 45 hours. Higher pH
values of 6.6 under the same operating conditions (80°C, 1wt. % NaCl, 50 ppm Fe2+) resulted
in a higher bulk S , faster precipitation kinetics and formation of a more protective FeCO3
film resulting in a final corrosion rate of 0.1 mm/yr after 45 hours.
As well as influencing the precipitation kinetics of FeCO3, pH can also have a profound effect
on the size and morphology of the crystals by influencing S and hence, crystal nucleation
and growth, which in turn influences the level of protection offered by the FeCO3 film. Pessu
et al.[12] exposed X65 steel samples to a 3.5 wt.% NaCl solution at 50°C for 168 hours at three
different pH levels of 3.8, 6.6 and 7.5. At pH 3.8 a porous, amorphous/nano-polycrystalline
FeCO3 film developed that offered minimal protection to the steel surface. Increasing pH to
6.6 resulted in a protective FeCO3 film consisting of cubic crystals which grew progressively
on the steel surface. The crystals were observed to be loosely packed on the steel surface. At
pH 7.5, film formation was rapid and produced rhombohedral FeCO3 crystals with sharp, well
defined edges which were extremely protective and compact. As pH was increased, there was
a notable increase in the density and compactness of the corrosion product layer, which linked
strongly to the level of protection offered to the steel substrate. Similarly, Tanupabrungsun et
al.[13] and Li et al.[14] demonstrate that protective FeCO3 formation is accelerated/enhanced at
higher solution pH, corroborating with the observations of Pessu et al.[12].
Understanding the formation, chemistry and role of CO2-induced corrosion products in oilfield
environments remains of considerable interest to industry. Providing clear links between the
nature/protectiveness of films and defined operating conditions can provide reassurance over
the adopted corrosion management strategies and improve the capabilities of corrosion
prediction tools. Considering that pH plays a critical role in influencing both the kinetics of
corrosion reactions as well as the morphology and composition of corrosion products, the
5
stages of film development. However, one key challenge in studying FeCO3 precipitation is
following the growth kinetics and relating this to the corrosion rate of the steel substrate either
in a quantitative or qualitative manner. Therefore, in this work, we demonstrate the capabilities
of in situ Synchrotron Radiation-X-Ray Diffraction (SR-XRD) to study the film growth
processes with a custom designed flow cell which is described in our previous publication [15].
The flow cell has been designed to enable simultaneous acquisition of diffraction patterns and
electrochemical corrosion measurements from the steel surface. This enables the kinetics of
film formation to be followed and correlated with the corrosion rate of the steel substrate in
real-time in a flowing system.
A number of research groups have already studied the formation of corrosion products in CO2
corrosive environments using in situ SR-XRD [16-20]. Such studies have reported that in simple
CO2-containing brine solutions a number of iron oxides/hydroxide phases form in conjunction
with FeCO3. Such phases include magnetite (Fe3O4) [21], chukanovite (Fe2(OH)2CO3) [16-20],
wustite (FeO) [20] and goethite (FeO(OH)) [20]. However, these studies have either been
performed in oxygen contaminated systems (as suggested by the authors themselves) [20], or
the growth of the corrosion product was accelerated by applying excessive currents/voltages
(unlike in this research) to the sample under study [18, 19] which were not realistic of the actual
corrosion kinetics encountered in the field and consequently prevented the true processes of
film formation from being established. Additionally, none of the aforementioned studies have
examined corrosion product growth in a flowing system.
In the present research, the flow cell is used to assess the effect that pH has on the early kinetics
of FeCO3 film formation and demonstrates that at the very least, qualitative information can be
obtained on the rate of film growth which can also be related to the corrosion rate transient
response of the carbon steel substrate. Further laboratory studies are also presented to
6
Electron Microscopy (SEM) analysis which was performed on samples at different time
intervals of the experiments, as well as longer term electrochemical corrosion measurements.
From the SEM images acquired, the surface coverage and size of the crystals were evaluated
in order to gain information relating to the induction time, as well as the nucleation and growth
processes identified through the in situ X-ray and electrochemical measurements.
2. EXPERIMENTAL
The following sections provide information relating to the experimental approach and the test
conditions evaluated using the SR-XRD flow cell. The flow cell design is described in detail
in our previous publication [15], which also discusses the setup, operation and full capabilities
of the system. However, a brief summary of the setup and operation is provided here for
completeness.
2.1 SR-XRD flow cell experimental set-up
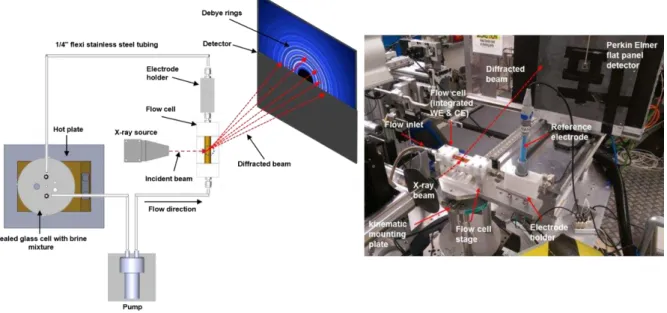
A schematic diagram of the flow cell setup at the Diamond Light Source, Oxfordshire, UK as
well as an image taken in the experimental hutch itself is shown in Figure 1. A locally heated
formation brine circulates within a closed loop between the flow cell and a 1L vessel via the
use of a centrifugal micro-pump. The flow cell houses a carbon steel sample (or working
electrode) from which diffraction patterns and electrochemical responses are recorded. A
detailed description of the components within the system (including the platinum counter and
Ag/AgCl reference electrode configuration) is provided in the paper by Burkle et al.[15]. Suffice
to say that the main capabilities of the system are that it enables in situ electrochemical
measurement and SR-XRD measurements to be collected continuously from the carbon steel
sample within the cell throughout the duration of the test without disturbing the flow conditions
7
Once flow was initiated through the cell, electrochemical and SR-XRD measurements
commenced after 3-4 minutes from when the pump was switched on as this was the time taken
to complete the safety checks and evacuate the experimental hutch. Each of the experiments
conducted at the Synchrotron facility ran for a duration of 4 hours. Additional tests using the
cell ran for 20 hours and were conducted in University of Leeds corrosion laboratories.
Figure 1. The flow cell set-up during Synchrotron experiments: Photograph (right) and schematic (left) of the flow cell set-up used on the Diamond Light Source beamline (I15).
2.2 Materials
The samples fitted into the flow cell throughout this study were made from X65 grade carbon
steel. The steel was provided in bar form and machined into cylinders of 9 mm diameter and
10 mm length. The exposed surface area of the sample to the 1L of electrolyte was 0.63 cm2
for each experiment. The carbon steel samples used comprised of pearlite and ferrite phases
with approximately 10-13% consisting of pearlite which was randomly dispersed within the
face of the sample exposed to the test solution. The chemical composition of the steel was (in
wt.%): C 0.15, Mn 1.422, Ni 0.09, Nb 0.054, Mo 0.17, Si 0.22, V 0.06, P 0.025, S 0.002, Fe
8
carbide grit paper, degreased with acetone, rinsed with distilled water and dried with
compressed air before being immediately flush mounted into the base of the flow cell. An
electrical wire was then connected to the base of the sample to enable connection to a
potentiostat for electrochemical measurements.
2.3 Brine preparation and operating conditions
For all experiments, the test solution used was a CO2-saturated 3.5 wt.% NaCl solution. To
achieve de-aeration and minimise the dissolved oxygen concentration (O2), the test solution
was purged with high purity CO2 for a minimum of 4 hours prior to each experiment. In
addition, high purity CO2 was continuously bubbled into the test solution throughout the entire
duration of each experiment. The flow cell and brine vessel were also sealed with one small
outlet for CO2 gas to prevent O2 ingress. Based on colorimetric analysis of the test solution, the
concentration of O2 was determined to be below 50 pbb. Each test was conducted at a fixed
temperature of 80 1ºC and flow velocity of 0.1 m/s. The only parameter changed between
each test was the solution pH which was varied for each experiment and controlled through the
addition of sodium bicarbonate (NaHCO3) with the aid of an automatic temperature correction
pH probe. Three pH values of 6.3, 6.8 and 7.0 were assessed within this study.
2.3. Data acquisition: XRD and Electrochemistry
2.3.1. Collection and interpretation of XRD data
The in situ SR-XRD experiments were conducted at beamline I15 at the Diamond Light Source.
Synchrotron radiation was adjusted and focused into a monochromatic beam (70 µm in
diameter) with a well-defined energy of 40 keV and a corresponding wavelength ( ) of 0.30λλ
Å. The incident-beam to sample angle was set to 4º. In order to maximise the accuracy and the
ability of the XRD patterns to be correlated with the extent of crystal growth, an operational
9
sample for every experiment. The reason behind implementing such a technique is that the
crystal formation may not be entirely uniform across the steel surface, particularly in the early
stages of growth. Consequently, this method of analysis enables identification of the
consistency of film growth in different locations across the steel, but also provides a larger
sampling size from the surface which can be more accurately and reliably correlated with ex
situ measurements (e.g. SEM images and corrosion product mass measurements as a function
of time). In this work, both the transient response from individual scans, as well as the average
from all 5 scanned areas are presented to describe the non-uniform growth characteristics over
the surface and to provide the most representative data possible to correlate with the collected
ex situ data.
With regards to the duration of data acquisition, individual data scans at each location took 60
seconds to acquire an XRD pattern (including the time taken for movement to each point).
Therefore the overall scanning time to complete the 5 scans over a 2 mm path length was ~5
minutes. These diffraction images were recorded using a Perkin Elmer flat panel detector
located 975 mm from the sample and conventional 2 diffraction patterns were generated by
radial integration of the Debye rings using the software Fit2D with subsequent data analysis
performed by profile fitting and Rietveld analysis.
2.3.2 Collection and interpretation of electrochemical data
With regards to the electrochemical measurements, linear polarisation resistance (LPR) and
electrochemical impedance spectroscopy (EIS) were employed to determine the in situ
corrosion rate of the X65 carbon steel working electrode. LPR measurements were performed
by polarising the sample ±15 mV vs. the open circuit potential (OCP) at a scan rate of 0.25
mV/s to obtain a polarisation resistance (Rp) and were undertaken every 5 minutes. In all of the
experiments, the solution resistance (Rs) was measured independently in laboratory tests away
10
polarised ±5 mV vs. the OCP using the frequency range from 20 kHz to 0.1 Hz. The value of
Rs was subtracted from Rp to produce a charge-transfer resistance (Rct in Ohm.cm2) which was
used to determine the corrosion rate behaviour with time.
(3)
Potentiodynamic measurements were also performed within the flow cell on freshly ground
samples in separate experiments at each solution pH. This technique was used to generate Tafel
polarisation curves to determine the anodic and cathodic Tafel constants and ultimately an
appropriate Stern-Geary coefficient (B) to enable calculation of corrosion rates from the values
of Rct determined as a function of time in each experiment. Tafel polarisation curves were
collected by performing individual anodic and cathodic sweeps starting at OCP and scanning
to +150 mV or -500 mV vs. OCP, respectively at a scan rate of 0.5 mV/s. Freshly wet-ground
samples and new test solutions were used for each individual anodic and cathodic sweep. From
the polarisation curves produced, it was possible to determine the anodic ( a) and cathodic ( c)
Tafel constants in mV/decade by measuring their respective gradient over regions were
linearity was observed between the applied voltage and the natural log of the measured current.
The Tafel slope measurements were used in Equation (4) to determine the Stern-Geary
coefficient (B), and the corrosion current density (icorr in mA/cm2) using Equation (5).
(4)
11
The icorr value obtained through Equation (5) was then used in combination with Equation (6)
(based on Faraday’s Law) and the measured values of Rct to determine the corrosion rate in
mm/year:
(6)
where 3.27 is a conversion factor (in (mm.g)/(mA.cm.year)), to obtain corrosion rate (CR) in
units of mm/year, MFe is the molar mass of iron (55.8 g), n is the number of electrons freed in
the corrosion reaction (2 electrons) and is the density of steel (7.87 g/cm3).
2.4. Ex-situ surface analysis
To supplement Synchrotron experiments, additional tests were performed away from the
beamline in University of Leeds corrosion laboratories to enable ex situ data to be collected in
the form of SEM images. These micrographs could then be correlated with the recorded XRD
patterns and electrochemistry data obtained at the Synchrotron. The laboratory experiments
varied in duration from 30 to 240 minutes depending upon the point at which samples were
identified for removal. At the end of each experiment, the samples were rinsed with acetone,
dried using compressed air and retained in a desiccator prior to SEM analysis, which was
performed using a Hitachi TM3030 Bench Top SEM in secondary electron mode with an
operating voltage of 15 kV. The SEM images were carefully analysed to determine the crystal
morphology, crystal size and the surface coverage. The surface coverage was obtained through
processing numerous random images from across the same surface into a MATLAB
programme that utilises the difference in contrast of the crystals formed against the bare steel
surface to produce a binary output image in black and white. Surface coverage was determined
through recording the percentage of black pixels (crystals) against the white pixels (no
crystals). This method of surface coverage analysis has been implemented and validated
12
the mass of the samples after each experiment was recorded before and after removal of
corrosion products from the steel surface using a sensitive micro balance (Mettler XP26). At
the end of each experiment, the sample was removed from the flow cell and rinsed with acetone
and then dried with compressed air. The sample was then weighed to determine the combined
mass of the sample and corrosion products before being weighed again after removal of
corrosion products using Clarke’s solution. This was achieved by pipetting a thin layer of the
solution onto the surface of the sample and rubbing gently with a cotton swab to remove the
layer. The difference in sample mass before and after corrosion product removal was used to
establish the mass of corrosion product present.
The operating conditions, test methods and analysis techniques for tests completed at the
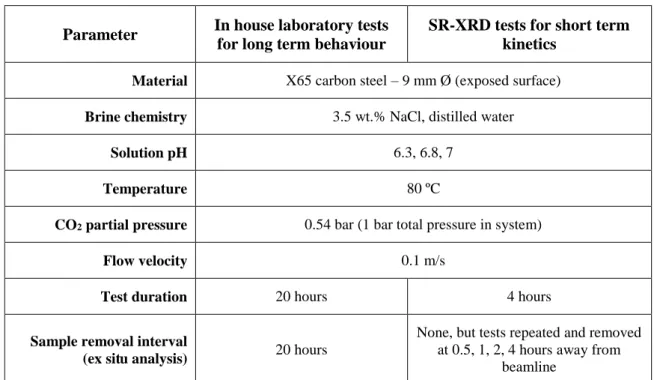
Diamond Light Source and within the University of Leeds are outlined in Table 1. Essentially,
all 4 hour LPR electrochemical data and all XRD data presented in this paper were recorded at
the Diamond Light Source. All other supporting electrochemical data (EIS, longer term LPR,
Tafel plots) and the SEM images were collected at the University of Leeds.
Table 1. Experimental in-house laboratory tests (at the University of Leeds) and in-situ SR-XRD tests (at the Diamond Light Source Synchrotron facility).
Parameter In house laboratory tests for long term behaviour
SR-XRD tests for short term kinetics
Material X65 carbon steel – 9 mm Ø (exposed surface)
Brine chemistry 3.5 wt.% NaCl, distilled water
Solution pH 6.3, 6.8, 7
Temperature 80 ºC
CO2 partial pressure 0.54 bar (1 bar total pressure in system)
Flow velocity 0.1 m/s
Test duration 20 hours 4 hours
Sample removal interval
(ex situ analysis) 20 hours
None, but tests repeated and removed at 0.5, 1, 2, 4 hours away from
13 In situ Electrochemical
measurements
LPR, EIS, Potentiodynamic
polarisation LPR
In situ surface analysis none SR-XRD
Ex situ surface analysis
SEM
None, but SEM, mass gain and surface coverage analysis conducted
away from beamline on removed samples at 0.5, 1, 2 and 4 hours.
3. RESULTS & DISCUSSION
3.1. Initial longer term corrosion tests and solution equilibrium chemistry
Laboratory experiments were performed over 20 hours to understand the long-term behaviour
and corrosion rate transient response of X65 carbon steel as a result of changing bulk solution
pH within the flow cell. These experiments formed the basis for comparison with shorter
duration tests conducted over 4 hours under the exact same conditions (using an identical setup)
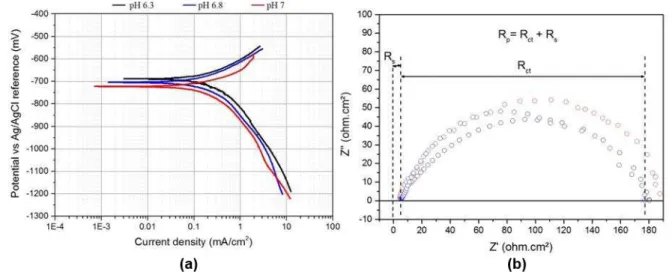
at the Synchrotron facility. Figure 2(a) shows the Tafel plots obtained by performing separate
anodic and cathodic polarisation sweeps about the OCP of X65 steel after 20 hours of
immersion in the test solution. The Tafel constants ( a = anodic Tafel constant; c = cathodic
Tafel constant), obtained as a function of pH, were measured based on the anodic and cathodic
curves in Figure 2(a) and resulted in a Stern-Geary coefficient of approximately 17 mV/decade
with a = ~60 and c = ~120 mV/decade across all conditions.
Figure 2(b) shows the EIS Nyquist plots depicting the solution resistance (Rs) and the
charge-transfer resistance (Rct) at the start of each test on the wet-ground steel surface. The solution
14
Figure 2. (a) Tafel plots and (b) EIS Nyquist plots showing the solution resistance (Rs) and
the charge-transfer resistance (Rct) for X65 carbon steel conducted in a CO2-saturated 3.5
wt.% NaCl at 80°C, 0.54 bar pCO2 and 0.1 m/s with pH values of 6.3, 6.8 and 7. Data
recorded away from beamline in laboratory experiments and after 5 mins OCP stabilisation.
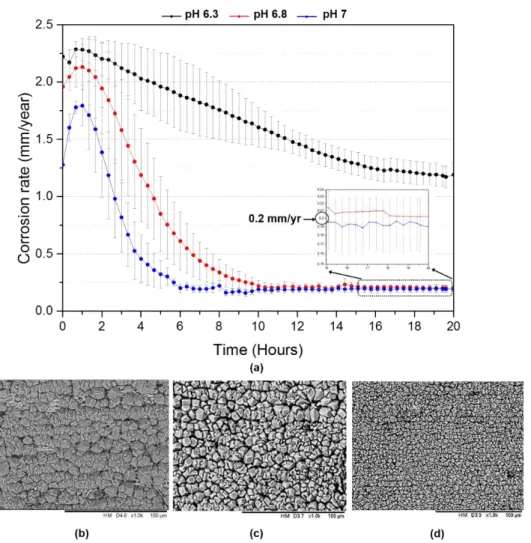
The effect of pH on the corrosion behaviour of carbon steel over 20 hours is shown in Figure
3. In acidic conditions, as the pH increases, the corrosivity of the solution generally decreases
in CO2 conditions due to the reduction in H+ ions available for the cathodic hydrogen-evolution
reaction. This difference can be observed in the initial stages prior to film growth in Figure
3(a), but due to the high pH of the three systems, there is only small sensitivity in initial
corrosion rate to the change in pH under these conditions.
During these tests, the formation of a protective surface film at pH 6.8 and 7 lowered the
corrosion rates to ~0.2 mm/year after 20 hours, whereas at the lower pH of 6.3, the final
corrosion rate reached ~1.2 mm/year but was still continuing to reduce. In addition to the
electrochemical observations, post-test SEM micrographs provided in Figures 3(b), (c) and (d)
indicate the difference in crystal morphology for the three tests; namely the size of the crystals
and their packing density. Although only marginally influencing the initial corrosion rate of
15
influencing FeCO3 formation. At higher pH, the Fe2+ concentration required to exceed the
solubility of FeCO3 is reduced, meaning saturation of the test solution is reached faster. This
results in substantial levels of precipitation onto the steel surface, resulting in corrosion rates
declining earlier and faster as pH increases.
Figure 3. (a) In situ corrosion rate data over 20 hours for X65 carbon steel in a CO2-saturated
3.5 wt.% NaCl solution at 80°C, 0.54 bar pCO2 and 0.1 m/s with pH values of 6.3, 6.8 and 7.
Data is supplemented with SEM images for (b) pH 6.3; (c) pH 6.8 and (d) pH 7 representing the surface after 20 h exposure to each condition. All data collected away from the beamline
in laboratory experiments.
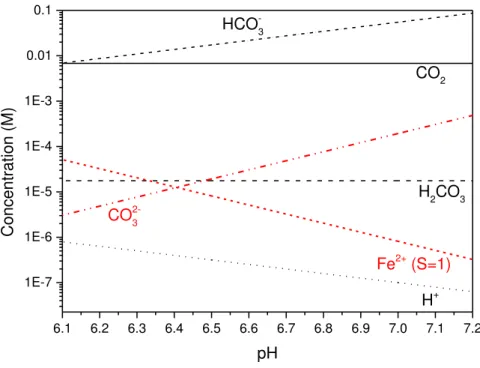
Through consideration of the equilibrium and dissociation reactions and their corresponding
equilibrium constants (Equations (7) to (16) in Table 2) it is possible to determine the CO3
-16
saturated 3.5 w.t % NaCl solution at 80°C and 0.54 bar pCO2. The exact equilibrium constant
values included in the model are listed elsewhere (Ksol [23], Kwa[24], Khy[25], Kca [23], Kci [23]), but
the concentration of species over the pH range of 6.3 to 7 are provided in Figure 4. This figure
shows that the concentration of CO32- increases by over an order of magnitude between pH 6.3
and 7, meaning much less Fe2+ ions are needed to reach the critical S required for
substantial crystal nucleation and growth.
Table 2. Homogenous H2O-CO2 equilibrium chemical reactions and their equilibrium
constants
To elaborate on this point further, the solubility constant (Ksp) shown in Equation (2) for FeCO3
is determined based on the knowledge of solution temperature and ionic strength using the
empirical expression proposed by Sun et al. [26] discussed previously.
log log (17)
Reaction Equation Equilibrium
Constant Equation
Dissolution of carbon
dioxide (7) (8)
Water dissociation (9) (10)
Carbon dioxide
hydration (11) (12)
Carbonic acid
dissociation (13) (14)
Bicarbonate anion
17
Where TK is the temperature in degrees Kelvin (K), and I is the solution ionic strength. For a
system of CO2-saturated 3.5 wt.% NaCl at 80°C, the Ksp can be calculated to be 1.57 × 10⁻¹⁰.
Through the use of the solubility product, from Sun et al.[26] (Equation (17)) and the definition
of S in Equation (2), the Fe2+ concentration required for saturation of FeCO3 in the bulk
solution (S = 1) can be determined, and this has also been included in Figure 4. Based on
Figure 4 the amount of Fe2+ required to reach saturation is reduced by over one order of
magnitude as the pH increases, due to the large increase in CO32- concentration. The exact
concentration of the species at each of the pH values considered in this paper are presented in
Table 3.
Increasing solution pH has been reported to result in greater nucleation of crystals onto steel
surfaces which are smaller and more densely packed. This is essentially because solution
saturation can be achieved more readily at higher pH in a closed system and FeCO3 nucleation
increases exponentially with relative S , whereas the rate of FeCO3 crystal growth bears a
linear relationship to this parameter. Therefore, nucleation dominates at high saturation while
crystal growth is more influential at low S [27]. By considering the concentrations obtained
from the equilibrium model for CO32- as a function of pH, if the same surface flux of Fe2+
occurs from the steel surface, then a change in pH from 6.3 to 6.8 would result in an increase
in surface S of approximately one order of magnitude, resulting in increased nucleation,
but potentially less growth of crystals. Increasing pH to 7 would result in a S 25 times
higher than at pH 6.3 for the same Fe2+ concentration. This helps to explain the observations
of increased crystal nucleation and growth with increasing pH as shown in Figure 3 (but a shift
in their respective dominance). This concept will also be related to both the in situ SR-XRD
and ex situ focused ion beam-scanning electron microscopy (FIB-SEM) analysis later in this
18
Figure 4. Equilibrium concentrations of species in the bulk solution as a function of pH in a CO2-saturated 3.5 w.t % NaCl solution at 80°C and 0.54 bar pCO2.
Table 3. Concentration of the species from the chemical reactions at pH 6.3, 6.8 and 7
pH CO H CO HCO H CO Fe
6.3 6.80 x 10⁻³ 1.76 x 10⁻⁵ 1.09 x 10⁻² 5.01 x 10⁻⁷ 7.70 x 10⁻⁶ 2.04 x 10⁻⁵
6.8 6.80 x 10⁻³ 1.76 x 10⁻⁵ 3.46 x 10⁻² 1.58 x 10⁻⁷ 7.70 x 10⁻⁵ 2.04 x 10⁻⁶
7 6.80 x 10⁻³ 1.76 x 10⁻⁵ 5.48 x 10⁻² 1.00 x 10⁻⁷ 1.93 x 10⁻⁴ 8.13 x 10⁻⁷
3.2. Kinetics of FeCO3 film formation: in situ SR-XRD and ex situ SEM analysis
In situ SR-XRD patterns between the values 2 =0-12° were collected continuously over 240
minutes for the three tests conducted at the Synchrotron facility. These experiments were then
repeated away from the beamline for further extensive ex situ SEM analysis of the films formed
over a range of time intervals between 30 and 240 minutes. The results are reviewed
collectively over the following sections.
6.1 6.2 6.3 6.4 6.5 6.6 6.7 6.8 6.9 7.0 7.1 7.2 1E-7
1E-6 1E-5 1E-4 1E-3 0.01 0.1
Fe2+ (S=1) CO2-3
HCO-3
H2CO3
Conce
ntr
atio
n (
M)
pH
CO2
19
3.2.1. Composition of the corrosion products formed
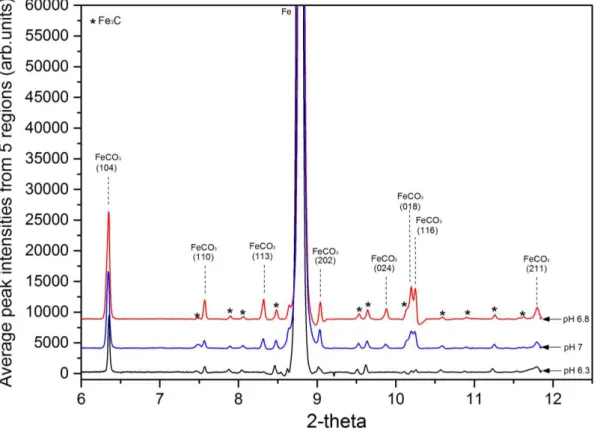
Figure 5 shows XRD patterns representing the signal intensity against 2 collected from the
carbon steel surface at the end of each 240 minute experiment for the three pH values (patterns
are offset for clarity).
Figure 5. Selection of in situ diffraction patterns recorded from the X65 carbon steel surface within the flow cell at the Diamond Light Source beamline (I15) after 240 minutes. Test conditions were 80°C, 0.54 bar pCO2 and 0.1 m/s in a CO2-saturated 3.5 wt.% NaCl solution
at different pH values of 6.3, 6.8 and 7. Each plot represents the average peak intensities of the phases present across a 2 mm path length at the centre of each sample which comprised of
5 individual scans. All data recorded at the Diamond Light Source powder diffraction beamline (I15).
Each pattern represents the average of five scans on the sample surface across a 2 mm linear
region at the centre of each sample, performed within the space of 5 minutes. These in situ
SR-XRD patterns reveal that the only crystalline phase detected on the steel surface at the end of
all three experiments was FeCO3. In fact, no other phases were detected at any point during the
20
part of the steel microstructure. Among the formed FeCO3 crystal planes, the most intense peak
was observed at 2 =~6.35º corresponding to the [104] plane. Given that this plane is the most
dominant under all conditions, it was chosen as the main peak to correlate with the precipitation
kinetics later within this work.
It is important to note here that utilising the peak intensity or peak area intensity of the (104)
reflection to follow precipitation kinetics relies on the assumption that no preferred orientation
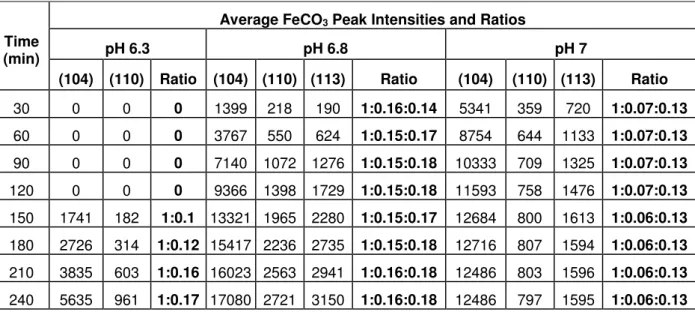
of the crystals exists on the steel surface. To validate whether any preferential orientation did
exist, the intensity ratios of the three most dominant peaks were compared. These three peaks
correspond to the (104), (110) and (113) reflections, which should exist in peak ratios of
1:0.20:0.18, respectively. Table 4 provides the peak intensity ratios across each pH and at
different time intervals. It can be observed from the table that these ratios are relatively
consistent with those expected for FeCO3 crystals with no preferential orientation at pH 6.3
and 6.8. Slight preferential orientation appears to exist at pH 7, but this is in favour of the (104)
reflection relative to the (110) peak. It is important to take this into consideration when using
such a technique to follow precipitation kinetics in a quantitative manner.
Table 4. FeCO3 (104), (110) and (113) peak intensity ratios across each pH and at different
time intervals
Time (min)
Average FeCO3 Peak Intensities and Ratios
pH 6.3 pH 6.8 pH 7
(104) (110) Ratio (104) (110) (113) Ratio (104) (110) (113) Ratio
30 0 0 0 1399 218 190 1:0.16:0.14 5341 359 720 1:0.07:0.13
60 0 0 0 3767 550 624 1:0.15:0.17 8754 644 1133 1:0.07:0.13
90 0 0 0 7140 1072 1276 1:0.15:0.18 10333 709 1325 1:0.07:0.13
120 0 0 0 9366 1398 1729 1:0.15:0.18 11593 758 1476 1:0.07:0.13
150 1741 182 1:0.1 13321 1965 2280 1:0.15:0.17 12684 800 1613 1:0.06:0.13
180 2726 314 1:0.12 15417 2236 2735 1:0.15:0.18 12716 807 1594 1:0.06:0.13
210 3835 603 1:0.16 16023 2563 2941 1:0.16:0.18 12486 803 1596 1:0.06:0.13
21
3.2.3. Early stages of FeCO3 film formation over time: Linking the in situ
corrosion behaviour to the in situ growth kinetics
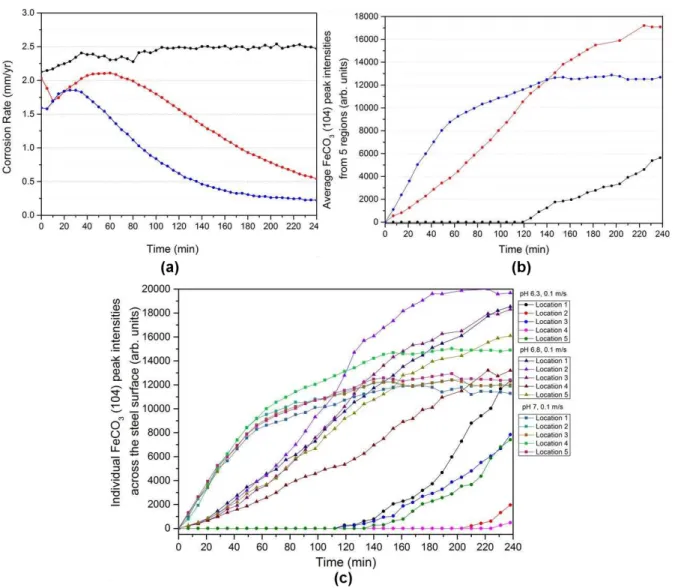
Figure 6(a) shows the in situ electrochemical corrosion measurements and Figure 6(b) shows
the intensity of most dominant FeCO3 (104) peak over time in the form of the average peak
intensities across all five locations for the different pH values studied i.e. each point on the
graph is the average intensity of the (104) peak from 5 scanned locations within the space of 5
mins. The individual responses from each of the 5 locations within all three experiments are
also provided in Figure 6(c) for completeness and show the variability in the diffraction
patterns observed at different locations on the same sample surface at very similar instances in
time. The variability in diffraction response from the steel surface is greater at lower pH, as
may be expected due to the slower kinetics resulting in larger differences in induction time on
different areas of the steel surface. At the highest pH of 7, the intensity responses from each
location are much more consistent with one another. However, these responses in Figure 6(c)
highlight the need to sample multiple regions on the steel surface (or to have a sufficiently
larger sample area) in order to obtain representative information on the induction time,
nucleation and growth behaviour of corrosion products, as some non-uniformity in the growth
of the film clearly exists across the surface.
In terms of relating the average intensity of the (104) peak to the corrosion response, referring
back to Figure 6(a), at a starting pH of 6.3 the corrosion rate increases with time before
stabilising at ~2.5 mm/year from 120 minutes onwards. In this experiment, the corrosion rate
does not change throughout the remainder of the test, although interestingly, FeCO3
precipitation is detected after 130 minutes as shown in Figure 6(b), reflecting the fact that the
SR-XRD is capable of detecting the very early stages of crystal growth, prior to it having any
22
before reducing continuously over the test duration, reaching a final corrosion rate of ~0.55
mm/year after 240 minutes.
Figure 6. In situ data recorded over time at the Diamond Light Source beam line (I15) for each test conducted at 80°C, 0.54 bar pCO2 and 0.1 m/s in a CO2-saturated 3.5 wt.% NaCl
solution at different pH values of 6.3, 6.8 and 7: (a) Corrosion rates; (b) Average FeCO3
(104) peak intensities of all 5 scans performed over a 2 mm line scan on each sample; (c) Individual FeCO3 (104) peak intensities of all 5 scans performed over a 2 mm line scan on
each sample. All data recorded at the Diamond Light Source powder diffraction beamline (I15).
Similarly, at pH 7, the initial corrosion rate increases yet again but reduces rapidly to values of
approximately ~0.2 mm/year after 240 minutes. The higher pH values of 6.8 and 7 result in
23
film within the given timeframe due to the increase in CO32- concentration in the bulk solution.
These characteristics are reflected by a rapid decrease in the corrosion rate with time. The faster
film formation at pH 6.8 and 7 observed with the in situ corrosion data is further reinforced by
the in situ SR-XRD data, where it is clear from Figure 6(b) that the induction time (the time
taken for the onset of crystal nucleation to occur) reduces significantly with increasing pH. The
induction time of FeCO3 is significantly longer at pH 6.3 (~130 minutes), compared with that
at pH 6.8 and 7 (~14 and ~7 minutes, respectively), and hence the growth kinetics of FeCO3
are faster at the higher pH in comparison with the system at pH 6.3, which is to be expected as
the surface S under these conditions is approximately 10 times higher at pH 6.8 and 25
times higher at pH 7 (inferred based on the similarity in surface flux of Fe2+ and the bulk CO3
2-concentrations calculated in Table 3).
When comparing the two systems operating at pH 6.8 and 7, assuming a direct relationship
between crystal growth kinetics and peak intensity transient response extracted from the XRD
patterns, the growth kinetics are noticeably different. The initial nucleation and crystal growth
rate is faster at pH 7, but the primary difference is that the growth rate decreases until a plateau
is approached after ~125 minutes (blue plot in Figure 6(b)) and remains constant until the end
of the experiment. Here, the crystal growth rate decreases due to larger proportions of the
surface being covered with crystals and ultimately reducing the production of Fe2+ from the
steel surface, which has a direct impact on the formation of FeCO3, reducing the precipitation
rate. These observations are consistent with the trend in electrochemical data. In comparison,
at a pH of 6.8, the induction time for FeCO3 nucleation is also comparatively fast (< 14 mins),
but the crystal growth rate is relatively constant throughout the majority of the experiment,
slowing down towards the final hour. Importantly, the peak intensity at the end of the
experiment at pH 7 is lower than the experiment at pH 6.8, indicating that the film formed at
24
SEM images later in this paper indicate that very high surface coverage of FeCO3 crystals is
achieved at both pH 6.8 and 7 after 4 hours, and that the key difference for the higher intensity
measured at pH 6.8 after 4 hours is the difference in thickness of the corrosion product film.
This difference in film thickness is highlighted in Figures 7(a-h) which are SEM images where
a focused ion beam (FIB) has been used to mill a cross-section into the protective FeCO3 film
to reveal the layer thickness.
25
tests (80°C, CO2-saturated 3.5 wt.% NaCl solution at 0.54 bar pCO2 and 0.1 m/s) at (a)/(c-e)
pH 6.8 and (b)/(f-h) pH 7.
Figure 7(a) and (c-e) shows the area removed, revealing the cross-section of the FeCO3 film
formed at pH 6.8. The film ranges from 2 to 4.75 m in thickness. Figures 7(c-e) also show the
presence of pores at the steel and FeCO3 crystal interfaces, allowing a pathway for species to
diffuse to and from the steel surface. These pores are not detectable from the top view SEM
images.
Figures 7(b) and (f-h) show the area milled away revealing the cross section of the FeCO3 film
formed at pH 7. The film ranges from 0.5 to 2 m in thickness. Unlike the crystals formed at
pH 6.8, Figures 7(f-h) show crystals that are better adhered to the steel surface interface which
more effectively block the surface reaction and diffusion of species to and from the surface.
The images show that the film formed at pH 6.8 is considerably thicker and consists of much
larger crystals than those at pH 7, agreeing with the measured XRD peak intensities (i.e. higher
intensity was observed for the thicker film at pH 6.8 after 4 hours). As a final point in Figure
7, there is a clear difference in the level of compactness of crystal and their interaction with the
substrate. Crystals formed at pH 7 produced a less porous layer which conforms better to the
steel substrate compared to crystals precipitated at pH 6.8, which aids in explaining why
corrosion rates were noticeably lower after 4 hours at pH 7.
3.2.2. Early stages of FeCO3 film formation over time: Development of film
through ex situ SEM observations
Theoretically, the peak area for a specific crystal plane in a diffraction pattern is proportional
to the crystal volume (or mass if a fixed density is assumed). Therefore, evaluating the average
peak area intensity as a function of time provides a suitable technique to follow the evolution
26
In this section, in situ SR-XRD and corrosion rate measurements are compared with ex situ
SEM observations showing the visual appearance of the corroding steel surface and FeCO3
crystals developing over time. Figures 8(a-e), 9(a-e) and 10(a-e) relate to the three different pH
values of 6.3, 6.8 and 7, respectively. The SEM images depicting the morphology and extent
of precipitation of FeCO3 crystals onto X65 carbon steel surfaces was conducted by running
numerous experiments at different durations of 30, 60, 120 and 240 minutes away from the
beamline. The ex situ SEM images enable determination of the structure and morphology, size
and the amount of the surface occupied by the crystals at each pH over time, which can be
correlated with specific data from the XRD patterns collected. The SEM images within the
figures are analysed at a magnification of x3000 to project an area of ~70x70 µm to represent
the size of the beam and to illustrate the area of the surface being scanned at each location.
Additionally, Figures 8(e), 9(e) and 10(e) shows the kinetics of the FeCO3 crystal growth in
the form of the average peak area intensity from all five locations which can be compared with
the electrochemical response that provides an average corrosion rate over the steel surface.
Figure 8 refers to the kinetics of FeCO3 formation for pH 6.3. In Figures 8(a) and (b), no
crystals are observed until 120 minutes (Figure 8 (c)) which agrees with the observed FeCO3
intensity increase in Figure 8(e). At this point, it can be assumed that the system has reached
the critical S required for not only FeCO3 nucleation but also further crystal growth
because in the following 120 minutes, the FeCO3 intensity rapidly increases and more crystals
are captured in Figure 8(d) with a slight increase in overall size to ~1.5 m, covering
approximately 23% of the surface. An interesting observation here is that despite the growth
of FeCO3 crystals on the surface, the corrosion rate remains stable at 2.4 mm/year with only a
small indication of a potential decrease after 230 minutes. Although FeCO3 crystals are present,
27
Figure 8. Development of the FeCO3 crystals; (a)-(d) SEM images as a function of time
(scale bar corresponds to 30 µm and data collected from laboratory repeats); (e) In situ corrosion rate and major FeCO3 (104) average peak area versus time collected at beamline
I15, conducted in a CO2-saturated 3.5 wt.% NaCl solution at 80°C, 0.54 bar pCO2 and 0.1
m/s at pH 6.3.
In comparison to the previous test conducted at pH 6.3, the decrease in Fe2+ solubility as a
result of increased bulk solution pH to 6.8 has enhanced both the nucleation and growth rate of
FeCO3 crystals which is evident from Figure 9(e). SEM images of the X65 steel surface after
exposure to the solution at pH 6.8 for 30, 60, 120, and 240 minutes are provided in Figure 9
28
Figure 9. Development of the FeCO3 crystals; (a)-(d) SEM images as a function of time
(scale bar corresponds to 30 µm and data collected from laboratory repeats); (e) In situ corrosion rate and major FeCO3 (104) average peak area versus time collected at beamline
I15, conducted in a CO2-saturated 3.5 wt.% NaCl solution at 80°C, 0.54 bar pCO2 and 0.1
m/s at pH 6.8.
After 30 minutes, following nucleation, discrete crystals on the surface begin to grow with
crystal sizes varying from <1 m to 2 m in width (Figure λ(a)) covering ~9.4% of the surface.
At this stage the crystals offer little or no protection against corrosion. After 60 minutes, the
nucleated crystals have grown, with an average size from 1 m to 5 m in width (Figure λ(b))
whilst new crystals continue to nucleate on to the steel surface. In conjunction with this
behaviour, the corrosion rate begins to decrease as a result of the FeCO3 crystals blocking active
sites on the steel surface with ~26.6% of the surface covered with FeCO3. From 60 minutes
29
of nucleation and growth continues until the FeCO3 film has the ability to reduce the corrosion
rate significantly. This sequence of nucleation and growth illustrates that as the FeCO3 layer
develops, larger proportions of the surface are being covered with crystals, ultimately reducing
the access of electrochemically active species to the surface, but also limiting the surface flux
of Fe2+ from the steel surface, which has a direct impact on the formation of FeCO3, reducing
the precipitation rate. Therefore, as the FeCO3 layer builds up, the precipitation kinetics slow
down which is captured by the SR-XRD measurements after 175 minutes in Figure 9(e). After
240 minutes, further nucleation and growth then contributes to a subsequent build-up of the
FeCO3 layer with crystals ranging from 1 m to 10 m. By the end of the experiment, areas
still exist on the steel surface through which the electrolyte has a direct pathway to the steel
surface, allowing the steel to continue to corrode at a reduced rate of ~0.6 mm/year.
A further increase in system pH to 7 resulted in even more substantial levels of FeCO3
precipitation occurring earlier in the experiment with increased nucleation as seen in Figure
10. This was attributed to the solubility of Fe2+ being further reduced due to the increased pH.
No significant change in the morphology of the film was observed between this test and the
previous test (pH 6.8) other than the size of FeCO3 crystals with sharper and more defined
edges (Figure 10 (a)-(d)).
After just 30 minutes of exposure (Figure 10(a)), a significant proportion of the steel surface
was covered by small FeCO3 crystals varying from <1 m to 2 m in width that possessed a
very similar structure to those observed at pH 6.8. After just 60 minutes of exposure, ~50% of
the surface is covered with FeCO3 crystals which is observed in Figure 10(b). In conjunction
with these observations, the corrosion rate is rapidly reducing at this stage. After 120 minutes
of exposure, a very large portion of the surface was covered by FeCO3 crystals varying from 1
30
slowed down due to the reduction in Fe2+ production from the surface, hindering FeCO3
formation.
Figure 10. Development of the FeCO3 crystals; (a)-(d) SEM images as a function of time
(scale bar corresponds to 30 µm and data collected from laboratory repeats); (e) In situ corrosion rate and major FeCO3 (104) average peak area versus time collected at beamline
I15, conducted in a CO2-saturated 3.5 wt.% NaCl solution at 80°C, 0.54 bar pCO2 and 0.1
m/s at pH 7.
The corrosion rate gradually continues to drop until the end of the test were almost entire
surface coverage is achieved. Very few changes were observed from the SEM images from
120 minutes onward with the only noticeable difference being a minor increase in crystal size.
Comparing this to the previous test, the maximum crystal size here is almost half the size of
31
coverage at pH 7 continued to increase marginally even though a plateau in FeCO3 intensity
occurred. This may be due to the fact that precipitation was limited at this stage and that the
regions scanned by XRD were already fully covered, producing no variation in intensity and a
slight mismatch between the in situ and ex situ observations. Figure 11 summarises the effect
of pH on the development and morphology of the FeCO3 crystals over time.
Figure 11. The effect of pH on the development and morphology of FeCO3 crystals over time
conducted in a CO2-saturated 3.5 wt.% NaCl solution at 80°C, 0.54 bar pCO2 and 0.1 m/s at
pH values of 6.3, 6.8 and 7.
The main differences throughout the tests at each pH were the sizes and growth rate of the
crystals. The crystals formed at pH 7 appear to have sharper and more defined edges, whereas
32
sharp edges (as seen at pH 7). The crystals at pH 6.8 also seem to vary in size considerably in
comparison to the FeCO3 at pH 7. It is well documented that the increase in pH significantly
decreases the solubility of Fe2+, resulting in faster precipitation and hence increased rate of
surface coverage. Consequently, FeCO3 precipitation is far more favourable at the higher pH
and has resulted in the formation of a smaller, compact and more protective crystals covering
larger portions of the steel surface. These observations link back to the nucleation and growth
theory when discussing long term corrosion behaviour in the previous sections.
3.3. Mechanism of FeCO3 film formation
In practice, the process of FeCO3 nucleation is observed more typically in the presence of
impurity particles and foreign surfaces (heterogeneous nucleation)[28]. The FeCO3 precipitation
process in this context starts with heterogeneous nucleation, a process which is capable of
occurring easily due to the numerous imperfections and adsorption sites to develop FeCO3[8].
Nucleation is then followed by the crystal growth process which essentially limits the rate of
overall precipitation.
The key role of S in FeCO3 formation has long been identified, initially by Dugstad [27].
The importance of the S near the steel surface was also discussed by Nesic and Lee [29].
Moreover, research efforts have also been directed towards understanding the role of nucleation
and crystal growth according to the saturation level of FeCO3 close to the steel surface by Gao
et al [30]. In the context of this work, the initial S at the corroding surfaces are orders of
magnitude different from pH 6.3 to pH 7, leading not only to very different nucleation and
growth rates, but differences in relative dominance between the two processes.
With consideration of in situ electrochemical, in situ SR-XRD and ex situ SEM data combined,
it can be interpreted that the formation of the FeCO3 crystals have caused the decline in
33
corrosion rate generated a high near-surface concentration of Fe2+. A combination of surface
roughening through the corrosion of the sample and high local S (especially at the higher
pH), will have promoted the significant heterogeneous nucleation of FeCO3 crystals on to the
steel surface. The combined in situ observations and ex situ SEM images illustrate that the
process of nucleation and growth continues until the FeCO3 film is protective enough to reduce
the corrosion rate significantly. However, this sequence of nucleation and growth illustrates
that as the FeCO3 layer develops, larger proportions of the surface are being covered with
crystals and ultimately reducing the reaction rate of Fe2+ production across the surface which
has a direct impact on the formation of FeCO3, reducing the precipitation rate and limiting
FeCO3 precipitation. Therefore, as the FeCO3 layer builds up, the FeCO3 growth rate kinetics
slow down which is captured by the SR-XRD measurements. From the accumulated measured
peak areas and intensities from the tests, four steps characterise the growth mechanism of the
FeCO3 layer. During each step, either the nucleation rate or the crystal growth rate dominates
the kinetics of the layer build up. The steps, based on the work in this paper are characterised
as followed:
(1) An induction time when the measured FeCO3 intensity is zero and no nucleation or
crystal growth rate occurs (high Fe2+ production rate and therefore higher S );
(2) Nucleation of the FeCO3 crystals when the measured intensity (of FeCO3) starts to
increase (nucleation rate dominates as new crystals initially form). At this point, the
production of Fe2+ is still rising (high S );
(3) Nucleation-growth stage which is characterised by an increase in crystal growth, but
also the nucleation and growth of new crystals. Here, the Fe2+ production rate will begin
reduce at some time along with the relative S , whilst crystals continue to grow;
(4) Growth stage when the integrated intensity of FeCO3 slows down or reaches a plateau
34
hence a reduction in S and Fe2+ production, while nucleation of new crystals
reduces). Larger FeCO3 crystals are present on the surface.
A schematic representation of the different steps of FeCO3 crystal growth mechanism is
provided in Figure 12.
Figure 12. Schematic diagram showing the different steps of FeCO3 crystal growth
mechanism (red arrows indicating pathways for anions/cations to and from the bulk solution/steel surface).
As mentioned previously, the nucleation rate is believed to increase exponentially with the
relative S , whilst the crystal growth rate varies linearly[27]. When the relative S is
high, nucleation dominates and a nano-crystalline or even amorphous film can develop [19, 31].
Conversely, crystal growth should play a more substantial role at lower relative S . This
35
same surface flux of Fe2+ which results in the increased nucleation and overall faster
precipitation of FeCO3 which is evident from the ex situ SEM and the in situ SR-XRD data
presented.
3.4. Use of in-situ SR-XRD for quantitative and qualitative analysis of
precipitation kinetics and surface coverage
A particular focus of this study was to identify whether a quantitative link could be established
between the intensity of the in situ SR-XRD patterns and the mass of FeCO3 on the steel
surface. As stated previously, the peak area intensity for a specific crystal plane in a diffraction
pattern is proportional to the crystal volume. For a fixed crystal density, this relationship should
hold for the mass of FeCO3 on the steel surface.
Accurately quantifying the kinetics of FeCO3 and other corrosion products (such as iron
sulphide) on the internal walls of carbon steel pipeline is of huge importance to the oil and gas
industry and has been the subject of significant research attention in recent years. The ability
to monitor film precipitation kinetics in real time and relate this to the protectiveness of the
various films capable of forming on the steel surface enables more robust corrosion
management strategies and corrosion prediction tools/models to be developed which account
for the presence of such films.
A vast amount of research has been conducted focusing on evaluating precipitation kinetics of
corrosion products in oilfield environments, particularly in terms of FeCO3. However, the main
challenges in determining precipitation kinetics of FeCO3 relate to the suitability and accuracy
of the methodologies applied to determine growth rates. For example, previous studies by
Johnson and Thomson [32] and Greenberg and Thomson [33] have typically involved inferring
precipitation rates through the measurement of Fe2+ ion concentration drop within the bulk
solution. Based on this methodology, the assumption is made that all precipitation in the system
36
by Sun and Nesic [28]. In fact, Sun and Nesic [28] showed that the original models developed for
FeCO3 precipitation overestimated film growth by orders of magnitude. Such conclusion were
based on result obtained using the ‘weight gain’ method in which the sample is weighed before
and after removal of the corrosion product through the use of Clarke solution. Although this
method was shown to be much more robust and to provide a more accurate measurement of
FeCO3 precipitation rates, the approach (just as with mass loss measurement) provides an
integral value over a particular time frame. Hence, as well as being time consuming, the
approach does not provide real-time precipitation kinetics and measurements of small mass
gains can be challenging.
Consequently, from this study the interest was in examining if there was a relationship between
film mass and average peak area intensity from the produced diffraction patterns across all five
scanned regions. However, although using in situ SR-XRD theoretically is an ideal means of
determining the growth kinetics and composition of corrosion products in conjunction with the
electrochemical behaviour, the measurement of such small crystal masses to correlate with the
peak intensities is challenging and proved impractical for the very early stages of film growth
in each of the tests conducted. This was mostly attributed to the small sample size required to
minimise water path length through the flow cell. As a result of this, only the final mass of
corrosion products could be correlated with the XRD patterns with any certainty. Figure 13
shows the relationship between the mass of the corrosion product film on the steel surface with
the average peak area intensity and total FeCO3 calculated volume (calculated using surface
coverage and average crystal size) under each pH condition.
Based on this figure, there is evidence to suggest that the technique may hold promise in terms
of providing quantitative analysis of film mass for a fixed incident angle and a calibrated
37
kinetics and overcome limitations of being able measure earlier levels of mass gain, the surface
coverage extracted from multiple SEM images was correlated with average peak area intensity.
Figure 13. Relationship between (a) the mass of the corrosion product film on the steel surface with (b) the average FeCO3 (104) peak area at the end of the tests and (c) total
calculated FeCO3 volume on the steel surface.
Although a direct comparison across all pH values could not be performed due to different film
thicknesses, it would be possible to see if the peak area intensity correlated with the quantity
of film for each individual pH separately as more of the surface became occupied by crystals.
Considering that the spot size scanned on the surface was significantly greater than thickness
of the film (i.e. five 70 x 70 µm scanned areas vs. a <5 µm thick film), it would be expected
that a good correlation could be achieved between the two values, particularly at higher levels
38
where film growth is present is relatively consistent in thickness and that these distinct areas
have the same mass density.
Figure 14 shows the correlation between surface coverage and average peak area intensity over
five different scanned areas of the steel surface. Considering the small areas processed from
images and SR-XRD, the agreement is very strong. Again, these observations reinforce the
capability of SR-XRD to help understand and quantify precipitation kinetics. At the very least,
these results indicate that SR-XRD and processing of the (104) peak intensity can provide
qualitative data on the film growth kinetics, but strong potential exists to develop this into a
quantitative technique.
Figure 14. In situ average FeCO3 (104) plane peak area compared with the surface coverage
for each test showing the different steps of FeCO3 crystal growth mechanism: (a) pH 6.3; (b)
39 4. CONCLUSIONS
A new system comprising of a flow cell with integrated in situ electrochemistry and SR-XRD
capabilities has been used to follow the steel dissolution and FeCO3 precipitation kinetics of
X65 carbon steel in real-time in a CO2-saturated brine at different pH values of 6.3, 6.8, and 7
when subjected to a flow rate of 0.1 m/s. The following conclusions can be extracted from the
results presented in this work:
FeCO3 nucleation could be detected consistently and well before its inhibitive effect on
general corrosion rate was recorded from electrochemical responses, indicating that in
situ SR-GXRD is able to detect the very early stages of crystal nucleation on surfaces
in a flowing cell.
Under the specific conditions evaluated, FeCO3 was the only crystalline phase to form
in the system, with no crystalline precursors being apparent prior to or during its
formation and being the sole phase responsible for the observed reduction in corrosion
rate, predominantly through the blocking of active sites on the steel surface.
The growth and the morphology of the FeCO3 crystals recorded using in-situ diffraction
patterns can be well described by the most dominant [104] crystal plane which is the
most predominant during the nucleation and growth of FeCO3.
From the response of the average peak intensities and peak area intensities collected
from diffraction patterns for the [104] plane as a function of time from multiple surface
locations, four steps characterised the growth mechanism of the FeCO3 layer: (1) An
induction time when the measured intensity is zero; (2) Nucleation of the FeCO3
crystals when the measured intensity initially increases; (3) Nucleation-growth stage
which is characterised by an increase in crystal growth with nucleation occurring
simultaneously; (4) Growth stage when the integrated intensity slows down and near
40
The induction time for FeCO3 formation significantly reduces with increased pH, which
also causes increase in crystal nucleation rate resulting in the formation of a smaller,
compact and more protective crystals in the early stages of growth.
There was insufficient evidence to show in situ SR-XRD measurements allow a
complete quantification of the mass or thickness of the film formed on the steel surface.
However, comparisons between crystal mass, surface coverage and peak area
(integrated intensity) of the (104) reflection demonstrates a strong agreement to provide
robust qualitative data on precipitation kinetics. Results also suggested that quantitative
information on mass gain or precipitation kinetics could be achieved with the use of a
constant incidence angle on a calibrated system.
The results clearly indicated that the quantity of FeCO3 (in terms of mass, thickness and
measured intensity) on the steel surface is not necessarily a good indication of the
protectiveness of the film formed. This highlights the importance of combined
diffraction and electrochemical measurements in understanding film formation
processes which may influence corrosion management strategies in the oil and gas
industry.
ACKNOWLEDGMENTS
The authors would like to thank the Diamond Light Source for beam time (Beamline I15,
reference EE12481-1), specifically Dr Annette Kleppe and Allan Ross for assistance before
and during our visit. We would also like to thank Steve Caddick, Graham Brown and Mick
Huggan for their expertise and assistance with the design and manufacture of the flow cell.