o
Ui
Oí
Intermodal
freight transport
key statistical data
1 D
ζ
J J C
· 3
1 9 9 2 - 1 9 9 7
L-2920 Luxembourg — Tél. 4301-1 — Télex COMEUR LU 3423 B-1049 Bruxelles, rue de la Loi 200 — Tél. 299 11 11
A great deal of additional information on the European Union is available on the Internet. It can be accessed through the Europa server (http://europa.eu.int).
Cataloguing data can be found at the end of this publication.
Luxembourg: Office for Official Publications of the European Communities, 1999 ISBN 92-828-7307-2
© European Communities, 1999
Printed in Luxembourg
κ C
LU
σι σι Ci
Intermodal
freight transport
key statistical data
1 9 9 2 - 1 9 9 7
#
*
Preface
This publication is the first step to publish existing non-harmonised statistical data on
intermodal freight transport concerning the European Union. The publication will be
progressively improved in the future when more data on intermodal transport becomes
available.
All comments and suggestions to improve this publication are welcome and should be
sent to the following address:
European Commission
Statistical Office of the European Communities
Unit OS/C/2
Jean Monnet Building, Rue Alcide de Gasperi
L-2920 Luxembourg
EU Intermodal Freight Transport eurostat
TABLE OF CONTENTS
Introduction 7 Executive summary 8
Intermodal transport key data 10 General situation and trends of transport in Europe 11
Table 1.1 Transportin EU-15 by kind of commodities 12
Table 1.2 External trade EU-15 13 Chart 1.3 Growth of transport, gross domestic product and industrial production 14
Table 1.4 Share of each mode in the total inland transport 14 Chart 1.5 Evolution of the modal split for goods transport in EU-15 (1980-1996) 15
Transport infrastructure 17
Table 2.1 Road network 18 Table 2.2 Rail network 19 Table 2.3 Inland waterway network 20
Table 2.4 Inland waterway main container ports 21
Table 2.5 Top container ports 22 Table 2.6 Extension of the European combined transport network:
main projects of new lines 23 Map 2.7.a Trans-European railway corridors and terminals 24
Map 2.7.b Trans-European railway corridors and terminals in Benelux-countries,
Germany, France and Austria 25 Map 2.7.C Trans-European railway corridors and terminals in Spain,
the United Kingdom, Ireland and Portugal 26 Map 2.7.d Trans-European railway corridors and terminals in Denmark,
Sweden and Finland 27 Map 2.7.e Trans-European railway corridors in Greece and Italy 28
Map 2.7.f Trans-European combined transport plan inland waterways 29
Transport chains 31
Table 3.1 Continental and intercontinental transport chains, by type 32 Table 3.2 Inland traffic of maritime containers, by country and by inland
transport mode 33 Table 3.3 Traffic of manufactured products by transport chain
between Cataluna / Ruhrgebiet 34
Unitised transport by country 35
Chart 4.1 Unitised transport of the European railway companies 36 Table 4.2.a Intermodal transport including railway transport 37 Table 4.2.b Intermodal transport including railway transport 38 Table 4.3 International rail traffic of large containers 39 Table 4.4 National and transit rail traffic of large containers 39
Table 4.5 Road-rail traffic 40 Table 4.6.a Intermodal transport including maritime transport 41
Table 4.6.b Intermodal transport including maritime transport 42
Table 4.7 Rail-sea and road-sea traffic 43 Table 4.8 Container traffic of maritime ports by country 44
m.
eurostat EU Intermodal Freight Transport
Unitised transport by operator 47 Table 5.1 Intermodal transport main operators 48
Table 5.2 Intermodal rail traffic by operator 49 Table 5.3 Transit rail traffic by ICF members 50 Table 5.4 Unitised rail transport: import of large containers by kind of frontier point 51
Table 5.5 Unitised rail transport: export of large containers by kind of frontier point 52 Table 5.6 Unitised rail transport: transit of large containers by kind of frontier point 53
Table 5.7.a Traffic of ICF by origin and destination railway 54 Table 5.7.b Traffic of ICF by origin and destination railway 55 Table 5.8 Share of combined transport technologies (UIRR members) 56
Table 5.9 Top 20 container service maritime operators 57
Unitised transport by nodes and links 59 Table 6.1 Port traffic (major European sea ports) 60
Table 6.2 Container traffic in major European ports 61 Table 6.3 Inland origins and destinations for the port of Rotterdam (example) 62
Table 6.4 Inland ports : fluvial and fluvio-maritime traffic 63 Table 6.5.a & b Inland containers shipping /journey times on the Rhine 64
Table 6.6 Freight traffic of major airports 65
Freight traffic through the Alps 67 Table 7.1 Traffic through the Mont-Cenis - Brenner segment 68
Table 7.2 Traffic between Germany / Benelux and Italy (Mont Cenis - Brenner segment) 68
Key contacts 69
Appendix
Abbreviations (countries) 72 Acronyms and abbreviations 73
Τ
Introduction
he promotion and development of intermodal transport is an important element of the Common Transport Policy.
The aim of intermodality is to combine the strong points of transport in the best possible way. Intermodality is a characteristic of a transport system that allows different modes to be used in an integrated manner in a door to door transport chain (COM (97) 243 dated 29th May 1997)1. This integrated approach focuses on the interlinkages between modes. Road, inland waterway, rail and other modes have in the past in many cases been developed independently. There is therefore a growing need for statistical data on intermodal transport. This need is explicitly referred to in the 1997 Communication from the Commission entitled "Intermodality and intermodal freight transport in the European Union".
Knowledge and understanding of mobility patterns, transport logistics and the evaluation of the impacts of different policy options on transport demand have to be based on reliable statistical data.
On long distance transport, each consignment generally uses different modes of transport or the same mode with transhipments (short haulage, then long haulage) between the first place where it is loaded and its final destination. A transport is considered as intermodal when different modes of transport are involved in the transport of a consignment. The following scheme illustrates an intermodal transport chain, as well as the corresponding information chain.
Example of a transport chain
Λ Π /Λ
SHIPPER 1ST
MODE
2ND MODE
3RD MODE
▼ y
Transhipment 1 Transhipment 2
4TH
MODE - > CONSIGNEE
Transhipment 3
Information flow
EU and ECMT define intermodality by two different concepts:
According to the COM (97) 243 (dated 29th May 1997) of the European Commission on intermodality and intermodal freight transport, intermodality is "a characteristic of a transport system, that allows different modes to be used in an integrated manner in a door to door transport chain".
Executive summary
This is the first effort to collect existing intermodal data in one publication.
A difficult conceptual problem: The construction of intermodal transport statistics (according to the
transport chain definition) raises a difficult conceptual problem because every single consignment is shipped by a specific transport chain. Moreover, the mix of transport modes and the various transhipment nodes makes it difficult to set-up intermodal transport statistics on a European scale. Statistical observation is also difficult because spatial aspects are often outweighted by economic considerations (trade between two adjacent regions is often routed via distant national hubs to consolidate dispersed flows in an efficient way). Due to the scarcity and weakness of existing transport chain statistics, the current publication focuses essentially on the unitised and combined transport, which is only one part of intermodal transport. However, in the long run, this publication will focus increasingly on data dealing with the transport chain concept.
Looking at the scheme of the previous page representing a typical transport chain, it is significant that most data currently available are dealing with only one link of each transport chain (eg one mode or one combination of modes as rail-road for example) or with one node (for example the containerised traffic from/to a port).
Main users: The main potential users of this publication are the policy makers and statisticians at EU and
Member States level, as well as the thousands of operators involved in the intermodal transport and logistics operations in the EU15 (shippers, forwarders, transport operators).
Sources of information: Several sources were used to prepare this publication, the main ones being:
European Commission Directorate-General VII, Eurostat, ECMT, UNO, UIC, UIRR, ICF (Intercontainer-Interfrigo), the Containerisation Yearbook, the Institute of Shipping Economics and Logistics (Germany), the "Direction des Ports et de la Navigation Maritime", various port authorities, the European Federation of Inland Ports (EFIP). Data from FP4 research projects (IQ, IMPULSE) were also used, as well as from private data providers (ΝΕΑ, MDS Transmodal). Details about all these sources are provided in appendix. Estimates have been used to a certain extent when no data has been available.
Transport chains: It is estimated that in 1992, the land-land transport chains represented 94% of the total
continental freight traffic in Europe, with a strong predominance of unimodal road transport, which makes about 90% of all land - land transport. As far as intercontinental freight traffic is concerned, 88% of the total traffic was realised with sea-land transport chains.
Statistics on transport chains are more and more difficult to set up. The implementation of the internal free market within the European Union had major consequences on the transport statistical system. Concerning intra-community trade, the disappearance of the single administrative documents led to a loss of information. The introduction of the INTRASTAT system has led to the disappearance of the domestic mode of transport, of the nationality of the border-crossing mode and the mode of appearance at border, as well as the country of first origin or last destination.
Unitised rail transport: Unitised rail transport amounted to 8 million TEU in 1996. The total amount of
unitised transport in that year was estimated to 140 -145 million tonnes and 50 billion tonne-kilometres.
Wñ
EU Intermodal Freight Transport eurostat
Moreover, some combined transport companies structured on cooperative lines, that is freight forwarders, road hauliers and their organisations have come together in the "Union Internationale des sociétés de transport combiné Rail-Route" (UIRR). The UIRR companies organise and market terminal-to-terminal services by rail. Seven origins - destinations make 64% of this total, involving principally Germany, Italy, Austria, Greece and to a smaller extent Belgium, By country of origin, the share of Italy is 35%, Germany 29.8%, Austria 11.6%, Belgium 10.6% of the total tonne-kilometres.
There are also a number of other private hauliers who, in parallel with the groups of providers referred to above, operate combined-transport services on their own account either on certain routes or for specific categories of goods, eg chemicals and liquid products requiring tanker transport. Such operators also offer combined transport train capacities to third parties on the market. These private operators have increased significantly their market share during the last three years.
Combined transport: The most common form of combined transport is transport with containers, swap bodies and semi-trailers. This unaccompanied transport, in which only the loading units are transported by rail, has a market share of around 80%. If transport of maritime containers by inland rail is included, the share is as high as 90%. In 1997, the share of swap-bodies and containers reached 7 1 % of all consignments carried by UIRR members. Conversely, the share of semi-trailers decreased from 18% in 1992 to 10% in 1997. The accompanied transport maintained its position.
Unitised transport by sea: The 31.2 million TEUs loaded and unloaded in EU ports represent 1/7 of the cargo handled in EU ports. The traffic of UK, Dutch and German ports accounted for 48% of the total EU traffic in 1996. Total container port-traffic in EU-15 increased by 45% between 1992 and 1996. The relative growth of container traffic was particularly impressive in the Spanish (+94%), Italian (+216%) and Finnish (+94%) ports during the period 1992/96. Rotterdam, Hamburg and Antwerp account for 1/3 of the containers transported in EU ports in the year 1997. The container transport of some Mediterranean container ports grew quickly during the three last years. The ports are Barcelona, Genoa, Algeciras and the new container port of Gioia Tauro (since 1997 the biggest container port of Italy with 1,4 Mio TEU).
Unitised transport on inland waterways: Around two million TEUs per year are transported on the EU inland waterways. The share of hinterland traffic of the ports of Rotterdam (Rhine corridor) and Antwerp as well as the Rotterdam-Antwerp feeder traffic is more than 90% of the total fluvial traffic in the EU. Container traffic on the Rhine increased annually by 20 % in the 1980s and by 7 % in the 1990s.
TRANSPORT KEY DATA RELATED TO INTERMODAL TRANSPORT
Total EU transport traffic (billion tkm, 1996)
of which: -road - rail
- inland waterway - sea (intra-EU) - pipe-line
Total goods transport growth (1970-1996) Total unitised traffic (Mio TEU, 1996)
- by EU railways - on inland waterways - on roads
- by sea (containers (loaded +unloaded) in ports)
Total unitised traffic (Mio tonnes, 1996) - by EU railways
- by air (major EU airports traffic)
- on inland waterways
- on roads
- by sea (containers (loaded +unloaded) in ports)
Total unitised traffic (Mio tkm, 1996) -rail
-road
- inland waterway
Total unitised traffic growth (1994-1996, UIRR members) Unitised traffic (% of total tkm transported by each mode)
-rail
- inland waterway -road
-air
Inland traffic of maritime containers (Mio TEU, 1996) -rail
- inland waterway -road
Rail-sea (bimodal) traffic Road-sea (bimodal) traffic
Share of combined transport technologies (by UIRR members, 1997) - semi-trailers
- accompanied transport - containers and swap-bodies
2,640
44%
8% 4% 41% 3% 2,6% per year
8.2 2 n.a 30.5
140/145
7.6 n.a n.a
240
53,70 n.a 4,7 31 % (in tonnes)
30% n.a n.a >90%
21.3 16.9%
8.9%
73.2%
8,824 wagons 12,254 trucks
10% 19% 71%
Sources : Eurostat. UIC, UIRR, ICF, Sotes estimates, DGVII.
GENERAL SITUATION AND TRENDS
OF TRANSPORT IN EUROPE
Table 1.1
Transport in EU-15 by kind of commoditiesYear 1997 Unit : % of tkm, except specifically indicated
Total EU-15 (billion tkm) %
(Breakdown in %)
Agricultural products (0,1) * Coal, other solid mineral fuels (2) * Petroleum and petroleum products (3) * Iron ore, steel, other metal products (4,5) * Cement, building materials (6) *
Chemicals, fertilizers (7,8) *
Machinery, manufactured articles (9) * All goods
Road
1,100 44%
29 1 5 8 19
9 29 100
Rail
220 8%
13 12 8 20 11 11 25 100
Inland Waterway
110 4%
13 12 19 18 25 10 3 100
Sea (intra-EU)
1070 4 1 %
n.a n.a n.a n.a n.a n.a n.a
- Pipe-lines
90 3%
0% 0% 100%
0% 0% 0% 0% 100
Total
1,920 100%
25 4 6 11 18 10 26 100
(*) NST/R classification groups in brackets (**) Data by groups of goods refer to EU12, 1992
Source : DG VII /Eurostat
The total number of freight transport tonne-kilometres was 1,920 billion in the EU15 in the year 1995. The share of road transport was 58%, while the share of rail transport was 11%.
Agricultural products and manufactured articles including machinery accounted for more than 50% of the total tonne-kilometres transported by inland modes of transport. Machinery and manufactured articles are partly transported by containers. Other kinds of commodities are mainly transported in bulk. The majority of freight tonnes are transported short distances. In 1992 60% of the freight transport in tonnes involved distances of less than 50 km and 81% less than 150 km. Thus, a majority of goods transported is far below the threshold of 300 to 400 km commonly admitted as the limit under which intermodal transport is not competitive. The current EU policy aims at supporting technological and logistical improvements in order to reduce this threshold.
EU Intermodal Freight Transport eurostat
Table 1.2 External trade EU-15
Year 1996 Unit: billion ECU
B+L DK D EL E F IRL I NL A Ρ FIN S UK EU-15 EXPORTS to Total Export 138.9 40.1 410,7 8.9 80.8 240.3 37,8 197,8 160,3 45.9 18.8 32.4 66.8 203.7 1 683.1 EU-15 106.4 27,0 234,6 4,6 54,0 149.7 26.9 109,2 129.3 29.4 15,0 17,7 38,1 117,4 1 059,2 77% 67% 57% 52% 67% 62% 71% 55% 81% 64% 80% 54% 57% 58% 63% PECO 2,7 1.4 29,1 1.1 1.4 5.3 0.4 11,5 3,2 6,2 0.1 2.2 2.2 3,9 70.7 2% 3% 7% 13% 2% 2% 1% 6% 2% 14% 1% 7% 3% 2% 4% Meditere Countries 5.3 0,7 16.7 1.9 4,3 13.2 0.6 15,6 3.4 2,2 0.3 0.6 1.6 6,3 72,7 4% 2% 4% 21% 5% 5% 1% 8% 2% 5% 2% 2% 2% 3% 4% USA 5.8 1.6 31,5 0.4 3.3 14.6 3,5 14,4 5.0 1,5 0,9 2,6 5.5 23.8 114,3 4% 4% 8% 4% 4% 6% 9% 7% 3% 3% 5% 8% 8% 12% 7% IMPORTS from Total Import 130,8 35.5 359.1 21,3 89,7 231,0 27.4 163,1 150.2 54,0 26.9 24,7 52,6 227.7 1594.0 EU-15 95.2 25,2 215,6 13.3 60,9 156.7 18,3 99,3 92,0 40,1 20,3 16,2 36.1 124.1 1013,2 73% 71% 60% 63% 68% 68% 67% 61% 61% 74% 76% 65% 69% 55% 64% PECO 1,6 1.0 23,3 0.8 0.9 3.4 0.2 6,7 2,6 4.4 0.1 0.8 1.3 2,8 50,0 1% 3% 6% 4% 1% 1% 1% 4% 2% 8% 1% 3% 3% 1% 3% Mediterr. Countries 2,9 0.3 12.5 1,3 3,5 8,6 0,2 11.0 2.7 1,5 0,6 0,1 0,3 4.0 49.5 2% 1% 3% 6% 4% 4% 1% 7% 2% 3% 2% 0% 1% 2% 3% USA 8,9 1.6 20.5 0.7 5.0 15.2 3,9 8,0 12.6 1.8 0.9 1,4 3,4 28,8 112,6 7% 5% 6% 3% 6% 7% 14% 5% 8% 3% 3% 6% 6% 13% 7%
PECO = Centrât and Eastern European Countries
mediterranean Countries - Gibraltar, Malta, ex Yugoslavia, Turkey. Albania, Ceuta and Melilla, Morocco, Algeria, Tunisia, Libya, Egypt, Cyprus, Lebanon. Syria, Israel and Jordan
Source DG VII ■ Eurostat
The total value of exports of the EU-15 Member States was 1,683 Billion ECU in 1995. The figure includes the intra-EU exports from Member State to Member State. The share of export between Member States is 63% of the total exports.
For extra-EU exports, the share of exports to the USA was the largest one, 7% of the total. The value of exports to the Central and Eastern European Countries and to the Mediterranean countries was 4% of the total for both destinations.
As for imports, the structure is roughly the same. The other importing zones of the world, not indicated in the table, make 22% of the total value of the EU exports and 23% of that of EU imports.
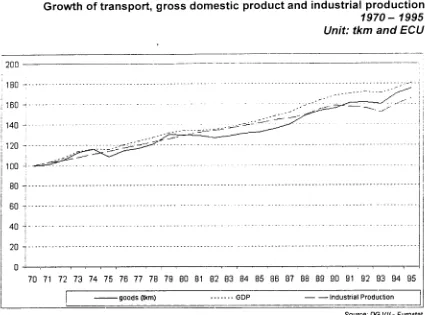
Chart 1.3 Growth of transport, gross domestic product and industrial production 1970-1995 Unit: tkm and ECU
200
[image:16.595.107.532.65.380.2]180
| 160
| 140
-I 120 -τ
100 -j
B0 η
60 -j
4 0 -i
20 -f
0
-t-70 71 72 73 74 75 76 77 78 79 80 81 82 83 84 85 B6 87 88 89 90 91 92 93 94 95
-goods (tkm) ■ GDP Industrial Production
Source: DO VII-Eurostat
The average growth rate of freight transport (in tkm) and GDP was 3.5% per year during the period 1970-1995.
Table 1.4 Share of each mode of the total inland transport
Year 1997 Unit: tkm in %
Β
DK*
D
EL*
E
F
IRL
I
L*
NL*
A
Ρ*
FIN
S
UK
EU-15
Road
70.4 73.2 67.1 98.1 84.2 74.4 91.3
85.1 68.7 47.0
38.2 85.7 71.0 63.4
84.8
73.2
Rail
14.6 8.1 16.1
1.9
10.1 16.9 8.7
9.4
20.5 3.6 37.0 14.3 27.6 36.6 9.1
14.4
Inland waterway
12.0 0.0 13.8
0.0 0.0 1.8 0.0 0.1 10.8 42.8 5.1
0.0 1.4 0.0 0.1 7.2
Pipelines
3.0 18.7
2.9
0.0 5.7
6.9
0.0 5.4
0.0 6.7 19.7
0.0 0.0 0.0 6.0 5.2
Π Modal Split based on national and international road traffic of vehicles registered in the country Source: DG VII - Eurostat
In all Member States; except Austria, the share of road transport of the total inland transport exceeds 50%.
EU Intermodal Freight Transport eurostat
In Ireland and Greece the share of road transport is more than 90%. These countries have no inland waterways transport and the share of rail freight transport is small. In the Netherlands the use of inland waterway has been maximised and the share of this mode is 42.8%. Also in Germany inland waterway transport has a significant share. Luxembourg, Austria, Finland and Sweden are the EU countries where rail transport is important.
Chart 1.5 Evolution of the modal split for inland goods transport in EU-15
1980-1996 (Vooftkm)
D Road ■ Rail
: D Inland waterway!
1980 1990 1996
The share of road transport of the total inland freight transport has increased continuously - from 58% to 74% - during the last 16 years. This has led to road capacity and safety problems.
Transport infrastructure
Table 2.1 Road network: length of motorways at the end of the year 1970-1996
Unit: km
1970 1980 1990 1991 1992 1993 1994 1995 1996 Β 488 1 192 1666 1650 1667 1686 1665 1666 1674 DK 184 516 601 653 706 747 786 830 880 D(-W) 4 461 7 538 8 959 10 955 11013 11 0B0 11 143 11 190 11300 D-Ε 1600 1687 1850 D D D D D D EL 11 91 190 225 280 330 380 420 470 E 387 1933 4 425 5 065 6 209 6 577 6485 6 962 7 293 F 1553 5 254 6 824 7 080 7408 7 614 7 956 8 275 8300 IRL 0 0 26 32 32 50 56 70 80 I 3913 5 900 6185 6 214 6 289 6401 6401 6401 6439 L 7 44 78 84 95 100 121 123 115 NL 1209 1773 2 092 2118 2 134 2150 2167 2 300 2360 A 439 869 1470 1532 1554 1567 1589 1596 1607 Ρ 66 132 318 474 519 579 587 687 710 FIN 108 204 225 249 318 334 388 394 431 S 403 850 939 968 1005 1044 1 141 1231 1330 UK 1073 2 573 3181 3211 3 246 3 252 3 286 3 308 3344 EU15 15902 30 566 39 029 40 510 42 475 43511 44151 45453 46333 index 1970=101 100 192 245 255 267 274 278 286 291
Estimates in bold italic D : included in D(-W) Sources: EUROSTAT, IRF, National Statistics
The construction of the main highway axes occurred during the period 1970-1990. In the 1990s more than 70% of the total EU motorways are in Germany, France, Spain and Italy.
After that the extension of the highway network has been rather slow with the exception of Spain and France. In Spain the length of motorways increased by almost 3000 kilometres during the 1990s. This explains a large part of the total EU-15 increase of the network during this period.
Table 2.2 Rail network: length of lines 1970- 1996 Unit: km 1970 1980 1990 1993 1994 1995 1996 Β 4 232 3 978 3 479 3 410 3 398 3368 3380 DK 2 352 2 015 2 344 2 349 2306 2 349 2349 D(-W) 29 527 28 517 26 950 40 369 41 355 41 719 40 826 D-E 14250 14 248 14 031 D D D D EL 2 571 2 461 2 484 2 484 2 464 2 474 2 474 E 13 668 13 542 12 560 12 601 12 646 12280 12 284 F 36 117 34 382 34 260 32 579 32 275 31939 31852 IRL 2 189 1 987 1 944 1 944 1 944 1 947 1945 I 16 069 16 133 16 086 15 942 16 002 15 998 16 014 L 271 270 271 275 275 275 274 NL 3 148 2 760 2 798 2 757 2 757 2 739 2 739 A 5 907 5 847 5 624 5600 5 636 5 672 5 672 Ρ 3 591 3 588 3 592 3 062 2 699 2 850 2 850 FIN 5 870 6 096 5 867 5 885 5880 5880 5 881 S 11 550 11 382 10 801 9 476 9 661 9 782 10 923 UK 19 691 18 490 17 406 16 996 16 998 17 026 17 128 EU-15 171 003 165 696 160 497 155 729 156 296 156 298
156 591
index 1970=100 100 97 94 91 91 91 92
of which, % electrified:
1996 73% 17% 45% D 0% 56% 45% 2% 64% 95% 73% 60% 22% 35% 68% 30% 47%
Main railway gauge and electric current used :
mm dc volts ac volts 1435 3000 1435 3000 25000 50Hz 1435 15000 16.7Hz 1435 15000 16.7Hz
1435 1668
3000 1435 1500 25000 50Hz 1600 1500 1435 3000 1435 25000 50Hz 1435 1500 1435 15000 16.7Hz 1668 25000 50Hz 1524 25000 50Hz 1435 15000 16.7Hz 1435 25000 50Hz
D : Included In D(-W) 1435 mm = standard gauge Source : UIC, data tor UIC member rait&ays
With 40,000 and 32,000 km of railway lines respectively, Germany and France have by far the most extended railway networks in the EU-15.
Contrary to the highway network, railway network has decreased during the 1970's and the 1980's. After that period the length of the UIC rail network in the EU has been around 156 000 km, of which 47% is electrified. Electrification of the railway lines is particularly high in the Benelux countries. The length of the railways of the non-UIC members is around 10 000 km.
Table 2.3 Inland waterway network: length in use of navigable canals, rivers and lakes 1970- 1996
Unit: km
1970 1980 1990 1991 1992 1993 1994 1995 Β 1553 1510 1513 1513 1513 1513 1513 1513 D(-W) 4 508 4 395 4 350 7341 7 341 7 681 7 681 7 343 D-E 2 300 2 302 2319 D D D D D DK -E -F 7433 6 568 6197 5 951 5 867 5 825 5 703 5 962 EL -I 2 337 2 337 1366 1366 1466 1466 1466 1466 IRL -L 37 37 37 37 37 37 37 37 NL 5 599 4 843 5 046 5 046 5 046 5 046 5 046 5 046 A 350 350 351 351 351 351 351 351 Ρ -FIN 6 000 6 057 6160 6160 6120 6120 6120 6120 S Π3 na na na na na na na UK
2 351
2 351
2 351
2 353
2 353
2 353
2 353
2 353
EU-15 32 468 30750 29 690 30118 30094 30 392 30270 30191 index 1970=100 100 95 91 93 93 94 93 93 Estimates in bold italics
Underlined : change in time series
-: nil D : included in D(-W) Sweden: data not available (na) Source: EUROSTAT, UN
The total length of inland waterways remained quite stable during the last fifteen years in all countries, with a total of about 30,000 km.
The network is particularly developed in Germany, the Netherlands, France and Finland. However, it is only in the first two countries that the loading gauge is sufficiently high to allow very high annual tonnages to be transported. In Denmark, Ireland, Greece, Spain and Portugal there are no inland waterway networks with significant freight traffic.
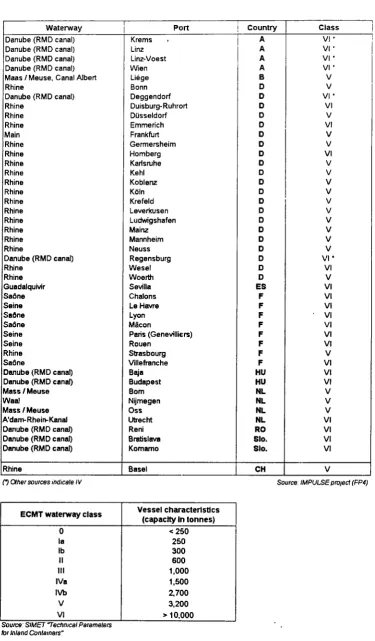
Table 2.4 Inland waterway main container ports: classes of network and their characteristics
Waterway Danube (RMD canal) Danube (RMD canal) Danube (RMD canal) Danube (RMD canal) Maas / Meuse, Canal Albert Rhine
Danube (RMD canal) Rhine Rhine Rhine Main Rhine Rhine Rhine Rhine Rhine Rhine Rhine Rhine Rhine Rhine Rhine Rhine
Danube (RMD canal) Rhine Rhine Guadalquivir Saône Seine Saône Saône Seine Seine Rhine Saône
Danube (RMD canal) Danube (RMD canal) Mass / Meuse Waal Mass / Meuse A'dam-Rhein-Kanal Danube (RMD canal) Danube (RMD canal) Danube (RMD canal)
Rhine Port Krems . Linz Linz-Voest Wien Liège Bonn Deggendorf Duisburg-Ruhrort Düsseldorf Emmerich Frankfurt Germersheim Homberg Karlsruhe Kehl Koblenz Köln Krefeld Leverkusen Ludwigshafen Mainz Mannheim Neuss Regensburg Wesel Woerth Sevilla Chalons Le Havre Lyon Macon Paris (Genevilliers) Rouen Strasbourg Vülefranche Baja Budapest Born Nijmegen Oss Utrecht Reni Bratislava Komamo Basel Country A A A A B D D D D D D D D D D D D D D D D D D D D D ES F F F F F F F F HU HU NL NL NL NL RO Slo. Slo. CH Class VI-VI· vi · v v vi-vi v VI V v VI v v v v v v v v v v
V I ' VI v VI VI VI ' VI VI VI VI v VI VI VI v v v VI VI VI VI V
O Other sources indicate IV Source IMPULSE protect (FP4)
ECMT waterway class
0 la Ib II III IVa IVb V VI Vessel characteristics (capacity In tonnes)
<250 250 300 600 1,000 1,500 2,700 3,200 > 10,000
Source SIMET "Technical Parameters tor Inland Containers"
Most of the large inland waterway container ports in the EU are located on the Rhine river.
They are accessible to large vessels (up to 10,000 tonnes capacity). There are in total 39 inland waterway container ports off classes V and VI in Europe (excluding sea ports). The breakdown by country is as follows: Germany: 27, France: 7, Austria: 5, the Netherlands: 4, Belgium: 1, Spain: 1.
Table 2.5 Top container ports: yard gantry cranes / straddle carrier distribution
Year 1997
Container port
Antwerp
S Bremerhaven / Bremen 'Felixstowe
: Genoa Giaoa Tauro Hamburg Hamburg La Spezia Le Havre Piraeus Rotterdam Rotterdam Southampton Thamesport
Country
Β
D
UK
I
I
D
D
I
F
EL
NL
NL
UK
UK
Type of equipment
Straddle carrier Straddle carrier RTG crane
RMG/OHB/crane Straddle carrier RMG / OHB / crane Straddle carrier RMG / OHB / crane Straddle carrier Straddle carrier RMG / OHB / crane Straddle carrier
Straddle carrier
RMG / OHB / crane
Number
166
90 ,
63 ¡
14 |
51 I
10
156 10
74
63
95
121 52
14
Source: Containerisation International- Hardware Market Analysis Note : RTG = Rubber-tyred gantry crane
RMG = Rail mounted gantry crane OHB = Overhead bridge
In total 979 handling cranes and carriers are in operation in the top twelve ports listed above. 78% of them are located in the Belgian, Dutch and German ports.
Table 2.6 Extension of the European combined transport network: Main projects of new lines
Project
Betuwe line
NEAT (Neue Alpen Transversable)*
Brenner axis
Lyon-Torino
Perpignan-Barcelona
Sweden-Denmark
Fehmam Belt
Area connected
Port of Rotterdam / Ruhr Region (Germany)
Alpine transit from Germany and France through Switzerland to Italy.
Verona (Italy) / München and Nürnberg -Berlin line via Erfurt - Halle and Leipzig: transit through the Alps between Austria and Italy
Link through the Alps between Ambérieu (France) and Torino (Italy)
France to Spain
Fixed link between Sweden and Denmark
Fixed link between Denmark and the German islands of Fehmam
Details
Length: 160 km, dedicated for freight traffic Double stack on the Dutch section of the line Expected capacity: 150 Mio tonnes / year
New line Arth-Goldau and Lugano, including the tunnels of St Gotthard (57km) and Mt Cenis (33km)
New line between Faltigen region and Steg, including the Lötschberg tunnel (33km)
The line Verona-München includes the construction of a 54 km tunnel under the Brenner, east of the existing one
Includes a base tunnel (54 km) and the Belledone tunnel Mixed passengers (high speed) / freight link
Mixed passenger (high speedyfreight link. European standard gauge.
Rail and road access between Copenhagen and the coast: four lane motorway (10km) + double track railway (12km) Öresund fixed link to Malmö (Sweden) : double track railway link + four lane motorway
Would allow continuation of the fixed link between Sweden and Denmark to south of Copenhagen.
[image:25.595.52.521.143.508.2]Map 2.7. Trans-European railway corridors and inland waterway network Time horizon: Year 2010
The maps of the following pages below illustrate the trans-European rail and inland waterways transport network outline plan for the time horizon 2010. They are included in the Commission proposal for the integration of ports and other interconnection points in the trans-European network (COM 681). The proposal has been adopted by the Commission and it is currently being examined by the other European institutions.
Map 2.7.a Trans-European rail network; railways corridors and terminals
7.1.0
LEITSCHEMA DES TRANSEUROPAISCHEN VERKEHRSNETZES (HORIZONT 2010)
ABSCHNITT: KOMBINIERTER VERKEHR
TRANSEUROPEAN TRANSPORT NETWORK OUTLINE PLAN (2010 HORIZON)
SECTION: COMBINED TRANSPORT
SCHEMA DU RESEAU TRANSEUROPEEN DE TRANSPORT (HORIZON 2010)
SECTION' TRANSPORT COMBINE SCHIENENKORRJDORE UNO TERMINALS RAILWAY CORRIDORS AND TERMINALS CORRIDORS FERROVIAIRES ET TERMINAUX BESTEHENDE VERBINDUNGEN/EXISTING CONNECTION/CONNEXIONS EXISTANTES
VERBINDUNGEN MIT DRITTLANDERN (NUR HINWEISEND) THIRD COUNTRY CONNECTIONS (PURELY INDICATIVE) CONNEXIONS AVEC LES RAYS TIERS (PUREMENT INDICATIVES) TERMINAL/STANDORTRAUM
TERMINAL/TRANSHIPMENT AREA TERMINAL/ZONE DE TRANSBORDEMENt
Source: DG VII
M a p 2 . 7 . b Trans-European railway corridors and terminals in Benelux-countries, Germany, France and Austria Time horizon: year 2010
The map below shows the trans-European combined transport rail corridors and terminals as well as the planned extensions of the network plan for Belgium, Germany, France, the Netherlands, Austria and Luxembourg. The time horizon is year 2010.
An extension is planned between Bremen through Groningen to Amsterdam.
LfJTSCHEMA DCS TRANSEUflOPAlSCHEN VERKEHRSNETZES (HORIZONT 2010)
ABSCHNITT KOMBINIERTER VERKEHR TRANSEUROPEAN TRANSPORT NETWORK OUTLINE PLAN
imo HORIZON;
SECTION: COMBINED TRANSPORT
SCHEMA DU RESEAU TRANSEUROPEEN X TRANSPORT [HORIZON 2O10)
SECTION TRANSPORT COMBME SOCNEMCORRDORE UNO TERM NAL S RMWAV COWflüORS ANDTEHMNAL3 CORRCORS FERROVUKE5 ET TERMWUJX
IBMNM/ST ANDOR TRAUM 1 TERMttAUTRAHSHlPMEKTAflEA
TOMNAUZONT. DE TRANSBORDEMENT
BELGIË/ BELGIQUE
2 Antwerpeo 3 ZeeOrugge 4 AJnus 6 Geik 7
üege-Renory-Bressoui β Gent 9 Mouscron
LUXEMBURG/ LUXEMBOURG
1 Bettembourg
NEDERLAND
1 Gronngen 2 Twente 3 A/nsterflam 4 Rotterdam 5 AmhenVr*)megen fi Verto 7 BonVZufcWjrnburg
FRANCE
1 Dunkerque 2 Lie 3 Amiens 4 Le Havre 5 Rouen 6 Remes 7 LeMans β Pant 9 Nancy/Metz 10 Strasbourg 11 Nantes-Mont» 12Angerj 13 Tour» UCftjon ISVeioU 1 6 M u t e u W
0 * w s h e e n 17 Cognsc-AngoüèfTK 1B Cheton-sa-Saon* «Macon 20 Lyon 21 Grenoble 22 B o r t e * « 23 Agen 24Toutouee 25 Montpewar/Sètt 26Avgnon
29 D n » H e n d a y · 31 Pen^gnen
DEUTSCHLAND
* NeumuTster 2 Rostock 4 Bnsme'1 5 Hannover 6 Braunscfuíieg,'1
WofsöunjiSaCginer 7 Bertm 8 Rhen* 9 Osnabrück 10 Bielefeld 11 Duisburg 12 Hohenowdberg t3 DússekJori-Neuss 14 Wanne/Heme 15 OortrrunoVBonen 16 Hagen 17 Wuppertal Ι9ΚοΟβηι 20 Wetzlar 2 2 l e r j z ç 23 Dresden 24 Paderborn 25 Dessau/Aker 26 Magdeburg 27 Kassei/Beiseiòrtn 26 Edun 29 Wûrzburg/
Scmvetrrfui X MarrtwirV LuOwiosnalen 31Tnw 32 Nürnberg 33 Regensburg 34 Saarbrücken 35 Karlsruhe 37 Stuttgart 3β Ingolstadt 39Landshul 40 Passau 41 Oftentxjrg 42 l i m 43 Augsburg 44 Munchen 45 Freiburg 46 PfuUenoorf I
Ravensburg Π Basel
OSTERREICH
Map 2.7.c Trans-European railway corridors and terminals in Spain The United Kingdom, Ireland and Portugal
Time horizon: year 2010
LEITSCHEMA DES TRANSEUROPAISCHEN VERKEHRSNETZES (HORIZONT 2010)
ABSCHNITT: KOMBINIERTER VERKEHR
TRANSEUROPEAN TRANSPORT NETWORK OUTLINE PLAN 12010 HORIZON)
SECTION COMBINED TRANSPORT
SCHEMA DU RESEAU TRANSEUROPEEN DE TRANSPORT (HORIZON 2010)
SECTION: TRANSPORT COMBINE
SCHIENENKORRIDORE UNO TERMINALS RAILWAY CORRIDORS AND TERMINALS CORRIDORS FERROVIAIRES ET TERMINAUX SESTEHENOE VERBINOUNGENfEXISTING CONNECTION/CONNEXIONS EXISTANTES GEPLANTE AUSWEITUNGJPLANNED EXTENSION/EXTENSION PLANIFIEE
VERBINDUNGEN ΜΓΓ DRITTLÄNDERN (NUR HINWEISEND) TURD COUNTRY CONNECTIONS (PURELY INDICATIVE) CONNEXIONS AVEC LES PAYS TIERS (PUREMENT INDICATIVES)
,
6_îs
»&£>--'
-~f:~ ^-.jimmsm
ié¿;h
TERMINAUSTANDORTRAUM 1 TERMINAUTRANSHIPMENTAREA
TERMINAL/ZONE DE TRANSSORDEMEN1
ESPANA
1 Bilbao 2 kun 3 Pamplana/Noan 4 Pod Bou
5 Vitola 6LWa
7 Barcelona 8 Zaragoza 9 Tarragona i n v a l i d ó l o 11 Madiid 12Valenaa/Sina 13Afcante 14 Multai Cartagena 15Unanj9 15 Cordoba ITAJoeoras/
San Roque igvigo
PORTUGAL
1 Lercoes/Porto
2 ValadoTejol ruaOioe
ÍS ■:\- " ' - - , . . ; ; « » s i f t *
ífCX&Víi
Ur·— >3t¿*
■\"Ν' ·
-N¿~:
» ^ L a T ^ ^
1L^V.7i^J\fc^Á,
: ï = ^ , - r - W ir
--",.iä..^
"" 3 Lobo· - r-Λ
.'^--¿¿'.i*,'-- ' .'^--¿¿'.i*,'--".'^--¿¿'.i*,'--Í
," ; "νΏ » .- -:". =.·=«?£' ■■■■..■
^ ^ » S & W l f * ¡ f ^ ; ; : i,
-09/97
UNITED KINGDOM
1 Stramayde 2 Betast 3 Cleveland 4 Leeds 5 Merseysde 6 Manchesier 7 Wakefield 8 Doncastar 9 West Midlines 10 DaventrylEast
Midlands 11 South Wales 12 London 13 HalYndi/T-eüxkme/
East of England 14 Soniti wast
IRELAND
1 Dunda!» 2 Dublin
3 Cot
EU Intermodal Freight Transport eurostat
Map 2.7.d Trans-European railway corridors and terminals in Denmark, Sweden and Finland
Time horizon: year 2010
7.1.3
Map 2.7.e Trans-European railway corridors in Greece and Italy
Time horizon: year 2010
The map below illustrates the combined transport railway corridors and terminals in Greece and Italy. The existing connections are illustrated by a solid line. Extensions are planned in Greece.
HELLAS
t Thessaloniki 2 Alhina
ITALIA
1 U i m 2 Cnesso 3 Tonno 4 Vercelli 5 Novara 6 Mlano
7 VefTX« β Padova 9 U d r e 10 Trieste 11 Alba 12 Rivatta S o m a 13 Pozzo» U Fiorefuuola 1 5 Ρ ν π α l6Mooena 17 Bologna 18 Ravenna
19 Genova 20 La Spezia 21 Livorno 22 Falconara 23 Roma 24 Pescara 25 Pómez» 26 La tina 27 Napoli 28 Bari 29 Brindei 30 Gioia Tauro 31 Palermo 32 Messina 33 Catania 34 Sassari 35 Cagliari
L E I T S C H E M A DES TRANSEUROPÀISCHEN VFRKEHRSNETZE. (HORIZONT 2010)
ABSCHNITT: KOMBINIERTER VERKEHR
TRANSEUROPEAN TRANSPORT NETWORK OUTLINE PLAN (2010 HORIZON)
SECTION: COMBINED TRANSPORT
SCHEMA DU RESEAU TRAMSEUROPEEN DE TRANSPORT (HORIZON 2010)
SECTION. TRANSPORT COMBINE SCHIENENKORRIDORE UNO TERMINALS RAILWAY CORRIDORS AND TERMINALS CORRIDORS FERROVIAIRES ET TERMINAUX BESTEHENDE VERB1NOUNGENÆXIST1NG CONNECnONXONNEXtONS EXISTANTES GEPLANTE AUSWETTUNG/PIANNED EXTENSION/EXTENSION PLANTEE
VERBINDUNGEN MTT DRITTLÄNDERN (NUR HINWEISEND)
1 THRO COUNTRY CONNECTIONS (PURELY INDICATIVE) CONNEXIONS AVEC LES PAYS TIERS (PUREMENT INDtCATtVES) TERMINAL / STANDORTRAUM
TERMINAL / TRANSHIPMENT AREA
TERMINAL ƒ ZONE DE TRANSBORDEMENT 09/97
3,i.-,:-, ' ".-::-,:■>--'·*>■-■- -. -.-*- - ■ : " _ ~~'-Λ*,ΐ&ίζ/ ¿i.*** .«·■·-.--,.· „..-„ir;.,. ; -J." - « h ■ V ;■;■-.■■;· --- v í V ·;"¥ 31 . ¿ ¿ » - > ^ £ " s * r '■"'?-* ¿ r i _iiî-. ?■->*>-- ι,-: ■ :·-rgv-rtp
v,^v>>*-*;
¿-»?3*#5,»,^
fe
. V -v r>
mr
J t ' ^ Ï K ϊ-ίχ. f*'-:. ...^'hrí/íJf^'-rsiS'.'irf:-. ■ ¡¿?mè;'Source: DGVII
Map 2.7.f Trans-European combined transport plan for inland waterways Time horizon: year 2010
The map below illustrates the European inland waterways and inland ports. Extensions are planned in Germany as well as in Belgium between Liège and Lille in France.
/
LEITSCHEMA DES TRANSEUROPAISCHEN V E R K E H R S N E T Z E S (HORIZONT 2010)
ABSCHNITT KOMBINIERTER VERKEHR
TRANSEUROPEAN TRANSPORT NETWORK OUTLINE PLAN (2010 HORIZON)
SECTION: COMBINED TRANSPORT
SCHEMA DU RESEAU T R A N S E U R O P E E N DE T R A N S P O R T (HORIZON 2010}
SECTION: TRANSPORT COMBINE
BINNENWASSERSTRAßEN UND BINNENHAFEN INLAND WATERWAYS AND INLAND PORTS VOIES NAVIGABLES ET PORTS INTERIEURS BINNENWASSERSTRAßEN ΜΓΓ 4 * 3 LAGEN UNO MEHR INLAND WATERWAYS FOR * 13 STACKS OR MORE VOIES NAVIGABLES POUR * 13 «VEAUX DE CONTAINERS ET PLUS BINNENWASSERSTRAßEN ΜΓΓ 3 χ 2 LAGEN
INLAND WATERWAYS FOR 3 χ 2 STACKS
VOIES NAVIGABLES POUR 3 χ 2 «VEAUX DE CONTAINERS GEPLANTE AUSWEITUNG
PLANNED EXTENSION EXTENSION PLANIFIEE BINNENHAFEN INLAND PORT PORT INTERIEUR
'~^B
EU Intermodal Freight Transport eurostat
Transport chains
Table 3.1 Continental and intercontinental transport chains by type 7992 Unit: Mio tonnes
Continental transport chains
Sea-Sea Sea-Land Sea-Road Sea-Rail Sea-Inland waterway Unknown Land-Land Unimodal Road Unimodal Rail
Unimodal Inland waterway Multimodal Total % Agriculture & Food 0,5 82,2 36,9 3.9 4,1 37.2 1.533,50 1.467,80 44,6 18,6 2,5 1.616,20 19,7 Solid fuel, Ores & Minerals 0,3 126,8 22,8 8,7 12 83.3 3.423,10 3.031.50 236.5 150,4 4,7 3.550,20 43,4 Petrol products 0,05 123,1 30.4 5,6 13,4 73,7 417,1 314,6 56.2 45,7 0,6 540,2 6,6 Metal 0,1 37,1 9.7 3,8 4 19,6 372,8 275.9 88,6 6,7 1.6 410 5 Chemical 0,2 61,3 25,7 4,6 4,9 26,1 109,5 346,1 42.5 18,4 2,5 471 5,8 Manufactured good 0,5 74,3 22,1 2 0,4 49,8 1521,2 1446 72 2 1,2 1596 19,5
T o t a l
1,65 504,8 147,6 28,6 38,8 289.7 7.677,30 6.881.90 540,4 241,8 13,1 8.183,60 100,00 % 0,02 6,2 1,8 0.3 0.4 3,5 93,8 84,1 6,6 3 0,2 100,00
Intercontinental transport chains
Sea-Sea Sea-Land Sea-Road Sea-Rail Sea-Inland waterway Unknown Land-Land Total •A Agriculture & Food 6 119,4 53,1 3.9 14,1 48.3 15,1 140,5 22 Solid fuel, Ores 4 Minerals 0,8 241,5 24,3 28.8 53,1 135,3 16,1 258,4 40,4 Petrol products 0,8 92,7 21,9 3.2 5.5 62.1 9,6 103,1 16,1 Metal 1,5 21,9 5.1 1.9 4.2 10.7 3,7 27,1 4.2 Chemical 2,4 54,1 20,7 4,6 7.6 21,2 9,5 66 10,4 Manufactured good 3,9 33 14,8 2,4 2,2 13.6 7,4 44,3 6,9 Total 15,4 562,6 139.9 44,8 86,7 291,2 61,4 639,4 100 % 2,4 88 22 7 13,6 45,5 9,6 100
Source: ΝΕΑ Transport Research and Training
According to the estimate of ΝΕΑ, land-land transport (in 1992) represented 94% of total continental freight traffic in Europe, with a strong predominance of unimodal road transport, around 90% of all land - land transport.
As far as intercontinental freight traffic is concerned, sea-land transport chains account for 88% of the total intercontinental freight traffic.
The tables above illustrate the situation concerning the continental and intercontinental freight flows in 1992, broken down by group of products and by type of transport chain.
These tables reflect the situation which was prevailing in 1992 at the beginning of the Single Market. The implementation of the Single Market within the European Union had major consequences on the transport statistical system. Concerning intra-community trade, the disappearance of the single administrative document led to losses of information. The introduction of the INTRASTAT system has led to the disappearance of the domestic mode of transport, of the nationality of the border-crossing mode and the mode of appearance at border, as well as the country of first origin destination or last origin destination.
Table 3.2 Inland traffic of maritime containers, by country and by inland transport mode 1992 - 1996 Unit: 1000 TEU
Ports in:
B + L
DK
D
EL*
E
F
IRL
'
NL
Ρ
UK
TOTAL
1992
Road
1.115
273
1.609
n.a.
952
768
483
1.433
1.672
351
3.607
12.263
Rail
292
88
681
n.a.
152
331
84
307
322
23
590
2.870
Inland Waterways
292
0
40
n.a.
0
0
0
0
735
0
0
1.067
Total
1.699
361
2.330
n.a.
1.104
1.099
567
1.740
2.729
374
4.197
16.200
1996
Road
1.500
359
1.749
n.a.
1.544
1.063
665
2.694
1.807
420
3.829
15.630
Rail
513
42
942
n.a.
129
323
81
333
534
32
720
3.649
Inland Waterways
526
0
64
n.a.
0
18
0
0
1.342
0
0
1.950
Total
2.539
401
2.755
n.a.
1.673
1.404
746
3.027
3.683
452
4.549
21.229
* Daia not available because of change in definitions n.a. : not available
Source: MDS Transmodal
The above table highlights the inland modes used for transport chains having a maritime link. Between 1992 and 1996, the total inland traffic of maritime containers has increased by 31%, from 16.20 million TEU to 21.23 million TEU.
In 1996, road traffic accounted for 73.6% of the total inland traffic of maritime containers. Between the years 1992 and 1996 the transport of maritime containers by road and rail increased roughly 27% and by inland waterways 83%.
The share of rail transport of maritime containers of the total is 34% in Germany. The share of inland waterway transport of the total is 21% in Belgium and 36% in The Netherlands.
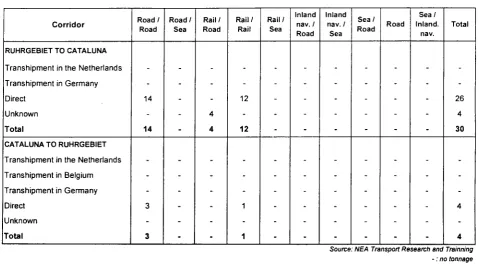
Table 3.3 Traffic of manufactured products by transport chain between Cataluna/Ruhrgebiet 1992 Unit: 1000 tonnes
C o r r i d o r
RUHRGEBIET TO CATALUNA Transhipment in the Netherlands Transhipment in Germany Direct
Unknown Total
CATALUNA TO RUHRGEBIET Transhipment in the Netherlands Transhipment in Belgium Transhipment in Germany Direct
Unknown Total
Road / Road
14
14
3
3
R o a d / Sea
-Rail/ Road
4 4
-Rail/ Rail
12
12
1
1
Rail/ Sea
-Inland nav. / Road
-Inland nav. / Sea
-Sea/ Road
-Road
-Sea/ Inland.
nav.
-Total
26 4 30
4
4 Source: ΝΕΑ Transport Research and Trainning
- : no tonnage
This table is an example of transport chain data, which are included in the NEAC database. The example shows the tonnes transported by type of transport chain between two regions, Cataluna in Spain and Ruhr in Germany.
Each chain is defined by the two main modes of transport used.
The NEAC database contains selected origins and destinations of freight transport by commodity group. Data are the results of compilations, harmonisation, estimates of raw data and modelling.
Chart 4.1 Unitised transport of the European railway companies 1996
Unit: 1000 TEU (except specifically indicated)
Estimated total
New operators 400
National rail operators / v a a s E
1 9 6 3 / ' ^Mm
1
24%wB
Intercontainer λ ^^k m
joint ventures 527 ^ ^ ^ ^ B I 9 'W
Intercontainer ( I C F ) ^ ^ ^ ^ ^ ^ ^ ^ ^ ^ 1 349
UIRR 3900
Sources: UIRR, UIC, ICF
8 million TEUs were transported by rail in EU-15 in the year 1996.
Based on the total tonnage published by the UIC (which covers around 90-95% of the total EU unitised market) the total unitised rail traffic can be estimated to 140-145 million tonnes (eg approximately 17 tonnes/TEU).
The railway companies and their subsidiaries originally concentrated their efforts on the maritime container business. In addition to mainly domestic marketing companies such as Compagnie Nouvelle de Conteneurs (France) and Transfracht (Germany), the European railway companies jointly formed the company called Intercontainer. This company merged in 1993 with the railway subsidiary for temperature-controlled freight transport and formed Intercontainer-lnterfrigo (ICF). Operating in competition with hauliers and freight forwarders in the European inland transport, the container companies offer shippers the entire combined transport chain for land containers.
As a result of the liberalisation of European transport markets and the internationalisation of transport demand patterns more and more railway companies are directly getting involved in international container transport, thus diminishing the role of ICF.
Moreover, some combined transport companies structured on cooperative lines, freight forwarders and road hauliers and their organisations formed the International Union of Combined Road-Rail Transport Companies, UIRR (Union Internationale des sociétés de transport combiné Rail-Route). The UIRR companies organise and market terminal-to-terminal services by rail.
There are also a number of other private hauliers who, in parallel with the groups mentioned above, operate combined-transport services on their own account either on certain routes or for specific categories of goods, for example chemicals and liquid products requiring tanker transport. Such operators also offer combined rail transport equipment to third parties on the market.
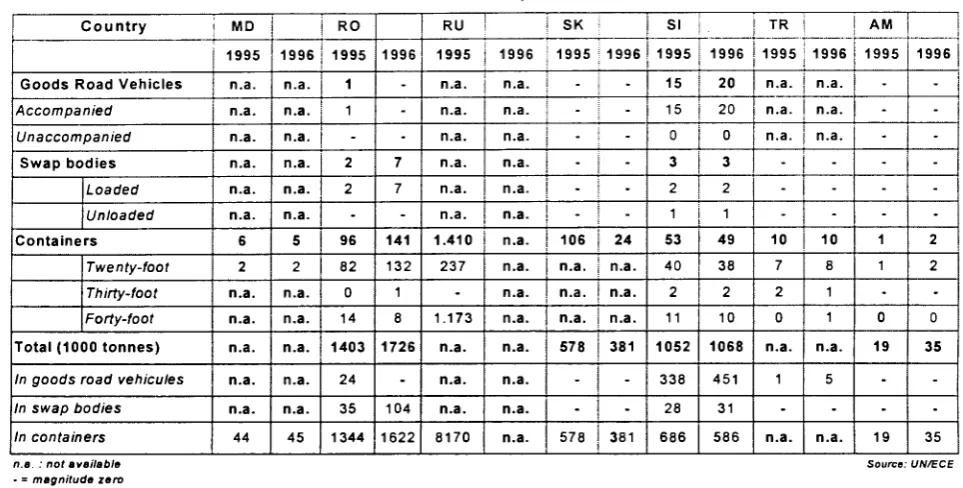
Table 4.2.a Intermodal transport including railway transport 1995-1996
1000 transport units
Number of intermodal transport units forwarded
Country
Goods Road Vehicles
Accompanied Unaccompanied Swap bodies Loaded Unloaded Containers Twenty-foot Thirty-foot Forty-foot
Total (1000 tonnes)
In goods road véhicules
In swap bodies
In containers BE 1995 n.a. n.a. n.a. 575 450 125 n.a. n.a n.a. n.a. n.a. n.a n.a. n.a 1996 n.a. n.a. n.a. 601 475 125 n.a. n.a. n.a. n.a n.a n.a. n.a. n.a. DK 1995 n.a. n.a. n.a. n.a. n.a. n.a. n.a. n.a. n.a. n.a. n.a. n.a n.a. n.a. 1996 n.a. n.a. n.a. n.a. n.a. n.a. n.a. n.a. n.a. n.a. n.a. n.a. n.a n.a. D 1995 n.a. 200 n.a. n.a. n.a. n.a. 2659 n.a. n.a. n.a. n.a. 3469 n.a. n.a. 1996 313 n.a. n.a. n.a. n.a. n.a. 2173 n.a. n.a. n.a. n.a. 6173 n.a n.a. EL 1995 n.a. n.a. n.a. n.a. n.a. n.a. n.a. n.a. n.a. n.a. n.a. n.a. n.a n.a. 1996 n.a. n.a. n.a. n.a. n.a. n.a. n.a. n.a. n.a. n.a. n.a. n.a. n.a. n.a. E 1995 n.a. n.a. n.a. n.a. n.a. n.a. n.a. n.a. n.a n.a n.a n.a n.a n.a 1996 n.a. n.a. n.a. n.a. n.a. n.a. n.a. n.a. n.a. n.a. n.a. n.a. n.a. n.a. F 1995 42 -42 495 n.a. n.a. 665 n.a. n.a. n.a. 17556 1075 8637 7844 1996 46 -46 545 n.a. n.a. 716 n.a. n.a. n.a. 19062 1038 9026 '8998 IRL 1995 -78 31 0 44 962 n.a. n.a. 962 1996 -83 34 0 45 951 n.a. n.a. 951 I 1995 n.a. n.a. n.a. n.a. n.a. n.a. n.a. n.a. n.a. n.a. n.a. n.a. n.a. n.a. 1996 n.a. n.a. n.a. n.a. n.a. n.a. n.a. n.a. n.a. n.a. n.a. n.a. n.a. n.a.
Number of intermodal transport units forwarded
Country
Goods Road Vehicles
Accompanied Unaccompanied Swap bodies Loaded Unloaded Containers Twenty-foot Thirty-foot Forty-foot
Total (1000 tonnes)
In goods road véhicules
In swap bodies
In containers L 1995 n.a n.a n.a
i t a n.a n.a n.a n.a ita. n.a
I L L
n.a
i t a
i t a 1996
n.a
n.a.
n.a
n.a
i t a n.a
n.a
n.a.
n.a
i t a
n.a
i t a
i t a
i t a NL 1995 n.a n.a n.a n.a n.a n.a n.a. na. n.a n.a n.a
i t a
i t a
i t a 1996 n.a n.a n.a n.a n.a n.a. n.a n.a n.a. n.a n.a
I U .
n.a n.a A 1995 188 n.a. n.a n.a n.a n.a 616 n.a n.a n.a 14799 6081
i t a
8718 1996 210 n.a n.a. n.a n.a n.a 646 n.a n.a n.a. 16528 7319 n.a 9209 Ρ 1995 n.a n.a n.a. n.a n.a. n.a. 34 34 -n.a. n.a n.a 332 1996 n.a n.a n.a n.a. n.a n.a 40 40 -n.a n.a n.a 439 FIN 1995 n.a n.a n.a n.a n.a n.a 26 n.a n.a n.a n.a n.a n.a 481 1996 n.a n.a. n.a. n.a. n.a. n.a. n.a n.a. n.a n.a n.a n.a. n.a n.a S 1995 n.a. n.a. n.a. n.a. n.a. n.a. n.a n.a. n.a. n.a. 4.870 1.481 1.191 2.198 1996 n.a n.a. n.a. n.a. n.a. n.a n.a. n.a. n.a. n.a. n.a n.a. n.a. n.a. UK 1995 390 390 n.a. n.a. n.a. n.a. n.a. n.a. n.a. n.a. n.a. n.a n.a n.a 1996 n.a. n.a. n.a. n.a n.a. n.a n.a n.a. n.a n.a. n.a n.a. n.a. n.a CH 1995 219 86 134 481 429 52 409 n.a. n.a. n.a 8881 2441 3429 3011 1996 208 89 119 471 423 48 380 n.a. n.a. n.a. 8417 2258 3430 2729
n.a. : not available
- « magnitude zero
0- magnitude less than half otthe unit employed
[image:39.595.49.522.131.397.2]