This is a repository copy of Fluoride doped γ-Fe O nanoparticles with increased MRI ₂ ₃
relaxivity.
White Rose Research Online URL for this paper: http://eprints.whiterose.ac.uk/132477/
Version: Accepted Version
Article:
Jones, NE, Burnett, CA, Salamon, S et al. (9 more authors) (2018) Fluoride doped γ-Fe O₂ ₃ nanoparticles with increased MRI relaxivity. Journal of Materials Chemistry B, 6 (22). pp. 3665-3673. ISSN 2050-750X
https://doi.org/10.1039/C8TB00360B
© 2018, The Royal Society of Chemistry. This is an author produced version of a paper published in Journal of Materials Chemistry B. Uploaded in accordance with the publisher's self-archiving policy.
eprints@whiterose.ac.uk https://eprints.whiterose.ac.uk/
Reuse
Items deposited in White Rose Research Online are protected by copyright, with all rights reserved unless indicated otherwise. They may be downloaded and/or printed for private study, or other acts as permitted by national copyright laws. The publisher or other rights holders may allow further reproduction and re-use of the full text version. This is indicated by the licence information on the White Rose Research Online record for the item.
Takedown
If you consider content in White Rose Research Online to be in breach of UK law, please notify us by
1
Fluoride Doped -Fe2O3 Nanoparticles with Increased MRI Relaxivity
N. E. Jones,1 C. A. Burnett,2 S. Salamon,3 J. Landers,3 H. Wende,3 L. Lazzarini,4 P. Gibbs,5 M.
Pickles,5 B. Johnson,6 D. J. Evans,1 S. J. Archibald1,8 and M. G. Francesconi1*
1 School of Mathematics and Physical Sciences-Chemistry, University of Hull, Cottingham
Road, Hull, HU6 7RX.
2 Department of Chemistry, University of Warwick, Gibbet Hill, Coventry, CV4 7AL
3Faculty of Physics and Center for Nanointegration Duisburg-Essen (CENIDE), University of
Duisburg-Essen, 47057 Duisburg, Germany
4 IMEM-CNR Parco Area delle Scienze 37/A, 43124 Parma, Italy
5 Centre for MR Investigation, University of Hull, Royal Infirmary, Anlaby Road, Hull HU3
2JZ
6 School of Physics & Astronomy, E C Stoner Building, University of Leeds, Leeds, LS2 9JT.
8Positron Emission Tomography Research Centre, University of Hull, Cottingham Road, Hull,
HU6 7RX.
Abstract
Iron oxide nanoparticles (IONs) are being actively researched and experimented as contrast
agents for Magnetic Resonance Imaging (MRI), as well as image-directed delivery of
therapeutics. The efficiency of an MRI contrast agent can be described by its longitudinal and
transverse relaxivities, r1 and r2. -Fe2O3 nanoparticles - doped with fluoride in a controlled
manner and functionalised with citric acid - showed a 3-fold increase in r1 and a 17-fold
increase in r2 in a magnetic field of 3 T and almost 6-fold increase in r1 and a 14-fold increase
in r2 at 11 T. Following fluorination, PXRD shows that the crystal structure of -Fe2O3 is
maintained, Mössbauer spectroscopy shows that the oxidation state of the Fe cation is
unchanged and HREM shows that the particle size does not vary. However, magnetisation
curves show a large increase in the coercive field, pointing towards a large increase in the
magnetic anisotropy for the fluorinated nanoparticles compared to the un-doped -Fe2O3
nanoparticles. Therefore, a chemically induced increase in magnetic anisotropy appears to be
the most relevant parameter responsible for the large increase in relaxivity for -Fe2O3
2
Introduction
Iron oxide nanoparticles (IONs) are becoming increasingly popular for use in biomedical
applications such as magnetic resonance imaging (MRI) for the detection of diseased tissues,
as well as image-directed delivery of therapeutics.1,2 For example, low concentration
biomarkers can be difficult to detect because of the limited sensitivity of the MRI equipment,
however, the signal intensity of MRI can be improved by introducing contrast agents. IONs are
being heavily investigated for their potential as MRI contrast agents due to their high
biocompatibility in comparison to other magnetic compounds, their high magnetic moment,
low toxicity and wide availability. Moreover, IONs can be directed specifically to the in vivo
target through the modification of their surfaces with specific binding groups that interact with
the target tissue.3 Several formulations based on IONs have already received approval by FDA
for clinical trial, mainly to be used as MRI contrast agents.1 Many current studies are directed
towards increasing the magnetic performance of IONs, so that lower doses of nanoparticles
will need to be injected in the patient’s body. The signal recorded during an MRI scan relates to magnetic relaxation processes occurring for the nucleai of the proton of the water molecules
in the area of the body, hence the efficiency of a contrast agent is usually described using
relaxivities, ri (i = 1, 2). The longitudinal (r1) and transverse (r2) relaxivities are defined as the
relaxation rate per unit concentration (mmolL1) of magnetic cation and are connected to the
efficacy of contrast enhancement, i.e. quality of images. The Koenig-Keller model relates the
relaxivities to the magnetic moment of the nanoparticles.4 Considering that, in inorganic solids,
there is a direct link between the magnetic properties and the chemical composition, the
efficiency of inorganic nanoparticles as contrast agent to enhance contrast for higher quality
images, is directly correlated with their chemical composition, as well as the particle size,
surface properties and functionalisation. Hence, it is crucial to design nanoparticles with
tuneable magnetic properties and surface functionalisation to obtain optimum MRI contrast.
Fine adjustment of the chemical composition via doping is one well established tool to modify
and fine tune magnetic properties in inorganic solids.5
Several iron oxides are available in nature and can be prepared in chemistry lab but the acronym
IONs, generally refers, mainly, to magnetite (Fe3O4) and to the more stable maghemite (
-Fe2O3), as both iron oxides show magnetic moment of appropriate intensity.5
The crystal structures of magnetite (Fe3O4) and maghemite ( -Fe2O3) are very similar, both
3
in both the octahedral and tetrahedral holes. In -Fe2O3 all Fe cations show oxidation state +3
and are randomly distributed between octahedral and tetrahedral holes. As both structures are
based on an FCC lattice, Fe3O4 can be interconverted into -Fe2O3 via oxidation and consequent
creation of cation vacancies. Fe3O4 is frequently non-stoichiometric (Fe3xO4) and has been
found to oxidise easily into a series of intermediates with varying content of Fe2+
(magnetite-magnemite solid solution).6
So far cationic substitution/insertion reactions have assured progress in the modification of
chemical formulas of inorganic solids and discovery of new materials, and are expected to
continue to do so. Particularly, cobalt, nickel, and manganese doped Fe3O4 nanoparticles,
MFe2O4 (M = Co, Mn, Ni, Zn) nanoparticles of size 35–50 nm were reported to be potential
alternatives to IONs due to their superparamagnetism at room temperature, high saturation
magnetization, high surface area, high density of surface amine groups and good aqueous
dispersion stability.7,8,9 However, manipulation of the anion population of inorganic solids has
been pursued less due, mainly, to experimental challenges. Despite this limitation, structural
and electronic modifications through alteration of the anionic makeup has yielded several
interesting compounds in recent years, due to the larger differences in nature, size, charge and
electronegativity seen with non-metals, when compared with metals. In addition, when
different anions coexist in the same structure an eclectic mix of bonding types and coordination
environments for the cations are present and, often, unique structures can be created.10 In
particular, the partial replacement of oxide anions with fluoride anions has been widely
researched for the modification of electronic properties in advanced materials such as
superconductors.11
There are only a handful of published examples of fluorination of iron oxides. The action of
fluorine on iron oxides was investigated in 1974. The fluorination of a crystal of Fe2O3 (it is
not specified whether the - Fe2O3 or the -Fe2O3 polymorph was used) with F2 or HF led to
no reaction for temperatures T < 300 C and formation of FeF3 on the surface for T 300 C.
12 More recently, Fe
3O4 nanoparticles were fluorinated to improve their performance as
cathodes in Li-ion batteries. Firstly, Fe3O4 nanoparticles were reacted with F2 gas in a fluidised
bed reactor and surface formation of FeOF was found for reaction temperatures T 100 °C.13
Direct fluorination under fluorine gas using a fluidized bed reactor was also performed on
-Fe2O3 nanoparticles. At reaction temperatures below 250 C, surface fluorination was obtained
4
temperature T ≥ 275 C, interconnected nano-domains of FeF3 and Fe2O3 were found to coexist
in the same nanoparticles.14
18F is well known as a radiolabelling agent for use with imaging techniques such as positron
emission tomography (PET) and therefore development of a fluorine modified iron oxide
nanoparticle could have potential as a dual MRI/PET probe.15 There have also been exciting
advances in the area of direct nanoparticle radiolabelling to offer the incorporation of
radioisotopes in stable one-step processes.16,17,18 The combination of stable fluoride containing
materials into this process offers a further opportunity for new multimodal probes.19 MRI/PET
is a developing imaging modality combination that is growing in clinical relevance and there
is a desire to develop applications and agents for new clinical imaging procedures.20,21
In this work, we performed a partial substitution of fluoride anions for oxide anions in - Fe2O3
nanoparticles using an experimentally simple and low-cost reaction.22, 23 The application of
IONs as MRI contrast agents rely on the magnetic properties of these oxides, hence phase
purity is of paramount importance to ensure repeatability and consistent performance. We
focused on -Fe2O3 nanoparticles and not on Fe3O4 nanoparticles to be certain of fluorinating
single phase samples. The most interesting outcome of this work is that the crystal structure
and magnetic moment do not change following fluorination, instead there is a large increase in
the coercive field and magnetic anisotropy. This increase seems to be responsible for the higher
relaxivity shown by the fluorinated -Fe2O3 nanoparticles.
Experimental
0.01045 moles of FeCl2.4H2O and 0.0209 moles of FeCl3 were mixed in 50 mL ethylene glycol and heated to 80˚C. 5M NaOH solution was added dropwise until the pH of the solution reached 10. The temperature was then increased to 120˚C and the solution stirred. After 1 hour, the
heat was removed. The mixed solution was exposed to an oxygen rich atmosphere by
connecting a separate flask of decomposing H2O2 (30%, 100 volumes; 25 mL) to the main
reaction vessel and left overnight. The nanoparticles were collected magnetically and washed
with warm water before being dried in an oven.
0.5g of the prepared -Fe2O3 was thoroughly ground with a pestle in a mortar at a 1:1 molar
ratio with NH4F powder and heated at 250˚C for 8 hours in air. The grinding process was
5
Powder X-Ray diffraction patterns were collected on a Siemens D5000 Diffractometer with Cu
K 1 radiation (1.54 Å) at 30 mA, 40 kV with a step size of 0.02 degrees 2 theta and a 0.5 ° fixed
divergence slit.
The TEM investigations have been carried out in a JEOL 2200FS field emission microscope
operated at 200kV, with point-to-point resolution 0.185 nm (0.136 nm in STEM mode),
equipped with in-column filter, X-ray microanalysis, and two high angle annular dark field
(HAADF) detectors for chemical imaging. The so called HAADF-STEM technique is also
known as Z contrast, as, in the proper conditions, the dominant mechanism in the images is
represented by the differences of the mean atomic number.
The powder are dispersed in isopropanol, sonicated and then dropped on holey carbon grids
for the observation.
Mössbauer spectra were recorded in transmission geometry using a 57Co source mounted on a
Mössbauer drive operating in constant-acceleration mode. Low temperature in-field
measurement were performed in a liquid helium bath cryostat, using a superconducting
split-pair magnet to apply a homogenous field of 5T at the sample position.
M(H) curves were recorded with the vibrating sample magnetometer (VSM) option of a
Quantum Design PPMS DynaCool, while M(T) measurements were performed with a
Quantum Design MPMS-5S.
XPS measurements were performed using a VG Escalab 250 XPS with monochromated
aluminium K-alpha X-ray source. The samples were mounted onto carbon tape for analysis.
The spot size was 500 m with a power of 150W. Detailed spectra of individual peaks were
taken at energy of 20 eV with a step size of 0.1 eV. Detailed spectra had a Shirley or linear
background fitted to them and peaks were fitted and deconvoluted using mixed
Gaussian-Lorentzian fits (using CASAXPS). Any shift in the spectra was corrected for using the carbon
peak at 285 eV.
The nanoparticles were dispersed in an aqueous solution of citric acid in a 1:1.2 Fe2O3−xFx:
citric acid molar ratio. Hydrochloric acid was added until the solution reached pH 4. The
mixture was stirred for 2 hours before magnetic decantation and the collected nanoparticles
were washed with deionised water and the pH adjusted to pH 7 by adding a 5M solution of
6
Hydrodynamic radii of the functionalised nanoparticles were measured using Nanosight LM10
with Nanoparticle Tracking Analysis (NTA) Version 2.3 Build 0011 RC1. Analysis settings:
Frames per Second: 23.22, Calibration: 186 nm/pixel, Blur: Auto, Detection Threshold: 10
Multi, Min Track Length: Auto, Min Expected Size: 100 nm, Temperature: 22.00 oC, Viscosity:
0.95 cP.
Relaxivity measurements were collected at 3 T and 11.7 T magnetic field strength. Relaxivity
data were collected at 3 T using a 3.0 T (Discovery 750) GE scanner. T2 weighted images (for
R2 quantification) were acquired using a spin-echo imaging sequence with the following
parameters: TR 600 ms, slice thickness 5 mm, field of view 24×19.2 cm with 256×256 matrix
size (image resolution is thus 0.94 mm by 0.75 mm), acquisition time 2 mins 12 secs. Repeated
for 10 different echo-times (10, 15, 20, 25, 30, 35, 40, 50, 70, 100 ms) for a total acquisition
time of 22 minutes. R2 was quantified via simplex minimisation using:
S=Soe−TEXR2
T1 weighted images (for R1 quantification) were acquired using an inversion recovery
imaging sequence with the following parameters: TR 6000 ms, TE 12.1 ms, slice thickness 5
mm, field of view 24×19.2 cm with 256×256 matrix size (image resolution is thus 0.94 mm by
0.75 mm), acquisition time 2 mins 6 secs. Repeated for 10 different inversion times (50, 100,
200, 300, 400, 500, 600, 800, 1000, 1500 ms) for a total acquisition time of 21 minutes. R1
quantified via simplex minimisation using:
S=S0(1−2e−T1XR1)
Relaxivity measurements at 11.7 T magnetic field strength were collected using a Bruker 500
MHz NMR. For T1 relaxation study, FISP T1 + T2 map sequence protocol was used with used
parameters: FOV = 4.0 cm, FA = 60 dg, TR = 3.0 ms, TE = 1.5 ms, TA = 5 min 20 s, T1 = 65
ms. T2 relaxivity data was collected using a MSME sequence protocol (Bruker
MSME-T2-map) where FOV = 4.0 cm, FA = 180 dg, TR = 2000 ms, TE = 10 ms, TA = 6 min 24 s.
For the phantom measurements, aqueous suspensions were prepared at di erent concentrations
(between 100 µM and 500 µM).
Results and Discussion
Steps were taken during the synthesis of the starting iron oxide to achieve single-phase samples
of -Fe2O3. Specifically, the oxidising agent H2O2 was added to make sure that all Fe2+ was
oxidised to Fe3+ or, in other words, that all Fe3O4 formed initially would be transformed into
7
were analysed using a peak deconvolution method that allows calculations of the percentage
of Fe3O4and -Fe2O3 in nanocrystalline samples.24 The (440) diffraction peak was used for the
deconvolution and the resulting weight percentages, 98.5 % for -Fe2O3 and 1.5% for Fe3O4,
led to the conclusion that the iron oxide samples prepared in this work can be reasonably
approximated to single-phase -Fe2O3 samples.
The fluorination reaction was performed using the solid fluorinating agent NH4F. The
fluorination reaction with NH4F is classified as a “soft-chemistry” reaction due to the fact that
it is usually carried out at a relatively low temperature (100 – 250 C). This method has been
vastly used for the fluorination of oxides and was reported to occur via the decomposition of
NH4F into NH3 and HF, which then reacts with the oxide.22
The fluorination reaction was attempted also using higher amounts of NH4F, specifically using
the following NH4F : -Fe2O3 molar ratios: 1:1, 2:1 and 3:1. However, reactions involving
NH4F : -Fe2O3 molar ratios higher than 1:1 led to increasing amount of -Fe2O3 (hematite) as
secondary phase. The amount of the secondary phase seemed to increase with the increasing
NH4F : -Fe2O3 molar ratio.
Both PXRD patterns of the fluorinated and un-doped -Fe2O3 (Figure 1) show the same set of
peaks with no detectable 2 theta shift and no detectable peaks corresponding to impurities,
although amorphous impurities cannot be completely excluded. This shows that the fluorinated
[image:8.595.74.496.504.729.2]compound maintains the maghemite structure of the starting material.
8
The unit cell parameters of -Fe2O3, and fluorinated -Fe2O3, were calculated using the model
reported by Pecharroman et al. ( , a = 8.33 Å) and found to be a = 8.344(2) Å, and a =
8.355(1) Å respectively, revealing a small increase in the lattice parameter of the doped
-Fe2O3 nanoparticles.25
The XPS spectrum (Figure 2a) of the -Fe2O3 sample shows three peaks corresponding to Fe
(~709 eV) and a peak corresponding to O2− (~529 eV). The peak at 285 eV can be assigned to
carbon and the peaks at 785 and 495 eV can be assigned to an Fe auger and Na auger,
respectively.26
(a)
800 700 600 500 400 300 200 100 0 0
10000 20000 30000 40000 50000 60000 70000
Fe 3p Fe 3s Fe 2p
C 1s
CPS
Binding Energy (eV) O 1s
9
800 700 600 500 400 300 200 100 0 0
2500 5000 7500 10000 12500 15000 17500
F 1s
Fe 3p Fe 3s Fe 2p
C 1s
CPS
10 (c)
740 730 720 710 700
0.0 0.1 0.2 0.3 0.4 0.5 0.6 0.7 0.8 0.9 1.0
Norm
ali
se
d
CPS
[image:11.595.99.425.155.408.2]Binding Energy (eV)
Figure 2- XPS survey spectra for (a) the prepared iron oxide nanoparticles; (b) the prepared fluorinated iron oxide nanoparticles. (c) XPS spectrum of Fe 2p peaks for -Fe2O3 nanoparticles (solid line) and fluorinated iron oxide nanoparticles (dashed line).
The XPS spectrum for the fluorinated -Fe2O3 sample (Figure 2b) confirms the presence of
fluorine, with the F1s peak at 686.93 eV. Quantitative data on anion and cation atomic
[image:11.595.74.503.589.659.2]percentages were also obtained and are listed in Table 1.
Table 1. Atomic percentages determined by XPS.
Figure 2c shows the enlarged sections of the XPS spectra of -Fe2O3and fluorinated -Fe2O3.
The peaks observed relate to Fe 2p 3/2 and Fe 2p 1/2 and their satellites. From visual
comparison of the two spectra, it can be seen that the XPS spectrum of the fluorinated -Fe2O3
is shifted to higher binding energies. This indicates changes in bonding, possibly due to the
Sample Fe 2p (%) O (%) F (%)
-Fe2O3 30.8 69.2 0.0
11
presence of the more electronegative fluoride anion. In fact, it was reported by Grosvenor et
al. that the more ionic the Fe-ligand bond the higher the binding energy.27
Considering that the PXRD pattern does not show any peaks corresponding to secondary
phases it is reasonable to assume that fluoride doping of -Fe2O3 has occurred and an
oxide-fluoride was formed. It is difficult, at this preliminary stage, to clarify whether the doping
occurred via insertion of fluoride anions (Fe2O3Fx), substitution of two fluoride anions for one
oxide anion (Fe2O3xF2x) or substitution of one fluoride for one oxide anion (Fe2O3xFx). It can
be safely said that it is unlikely that the doping mechanism is insertion of a fluoride anion
(Fe2O3Fx), because this would imply a partial oxidation of the Fe cations from 3+ in maghemite
to 4+, to counteract the additional negative charge. An oxidation of iron from 3+ to 4+, though
not impossible, seems unlikely. Substitution of one fluoride for one oxide anion would imply
[image:12.595.82.500.353.648.2]a partial reduction of iron from 3+ to 2+ to counterbalance the loss of negative charge.
12
Mössbauer spectra recorded at room temperature (RT), 4.3K, and at 4.3K under a magnetic
field of 5T parallel to the -ray propagation direction are displayed in Figure 3. To make
comparisons easier, the spectra at 4.3K and RT are superimposed, with no differences being
visible at 4.3K, showing that no considerable changes in magnetic structure or Fe valence state
have been caused by the fluorination, and that no secondary iron-bearing phases have formed.
Both samples display a clear sextet spectrum, composed of the superposition of the two
sub-spectra of A- and B-sites, as discussed below in detail, showing complete magnetic ordering.
The RT spectra show a slight deviation between the two samples, mostly visible at the inner
flanks, pointing towards beginning superparamagnetic relaxation.28,29,30 As the HREM analysis
will show, the particle size of both samples is fairly identical, which indicates that this slight
difference in relaxation behaviour is mostly caused by the fluorine doping. The spectra
recorded at 5T and 4.3K are shown separately. We can see two clearly resolved sub-spectra for
the tetrahedral (A) and octahedral (B) Fe3+ sites. For ferrite systems, the presence of Fe2+ would
lead to the observation of additional spectral contributions with higher isomer shift and lower
hyperfine magnetic field, which were not observed in any of the described spectra.31,32 The lack
of Fe2+ indicates that the 1:1 = F:O substitution, i.e. the formation of an oxide-fluoride of
general composition Fe2O3xFx is an unlikely outcome, although it cannot be completely
discarded. Substitution of two fluoride for one oxide anion (Fe2O3xF2x) seems the most likely
scenario, which is also supported by the small increase in lattice parameters calculated from
the PXRD data (from 8.344(2) Å in -Fe2O3 to 8.355(1) Å in fluorinated -Fe2O3). This scenario
is also in agreement with the findings by Zhou et al., who carried out direct fluorination of
-Fe2O3 nanoparticles under fluorine gas using a fluidized bed reactor. At reaction temperatures
up to 250 C, a phase of general composition Fe2O3xF2x (x < 1) was obtained on the surface
of the nanoparticle. The PXRD patterns for the products of this fluorination process are
comparable with those we obtained, as they show that the fluorinated product maintain the
-Fe2O3 structure, there are no impurities and no noticeable shift of the diffraction peaks.13
The 5T Mössbauer spectra show no significant change in the degree of inversion, with the ratio
of spectral areas of the two Fe3+ subspectra remaining mostly unchanged for both samples.
However, a clear difference can be observed in the relative intensities of lines 2 and 5, from
which the degree of spin alignment or spin canting, respectively, can be inferred. As the particle
sizes have been determined to be very similar for the two samples, the distinctly higher intensity
of lines 2 and 5 in the spectrum of the Fe2O3xF2x can presumably be explained by this sample
13
angles of ~24° (Fe2O3xF2x) and ~17° (Fe2O3) have been extracted. The higher spin canting
may be explained in terms of an enhanced magnetic anisotropy as a result of fluorination.
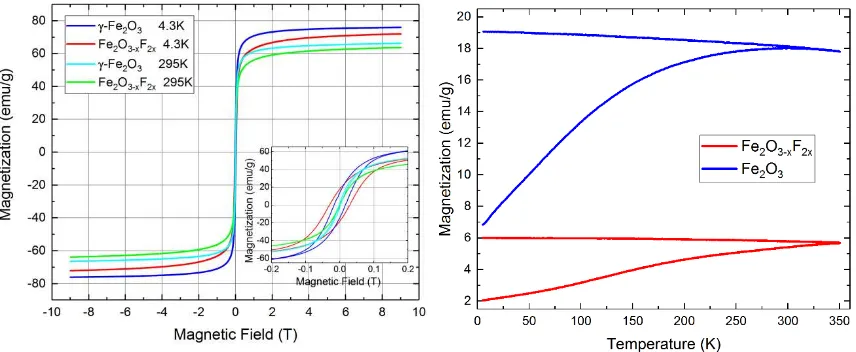
To crosscheck this claim further, magnetometry measurements were performed on both
samples, with Figure 4 showing a close-up of M(H) measurements performed up to maximum
fields of 9T at 4.3K and RT, as well as M(T) zero field cooled – field cooled (ZFC-FC)
measurements recorded between 5K and 350K at an applied field of 10mT. The 9T
magnetization is decreased by 6% for the fluorinated sample compared to the undoped material,
presumably due to the increased spin canting that was observed in the 5T Mössbauer spectra.
However, the fluorinated sample also shows a coercive field that is twice as large as that of the
undoped sample, also pointing towards a higher magnetic anisotropy constant. Furthermore,
temperature dependent measurements reveal a larger splitting between FC and
ZFC-magnetization curves, indicating overall lower blocking temperatures, i.e. lower magnetic
[image:14.595.74.502.382.558.2]anisotropy energy barriers, further substantiating this assumption.
Figure 4- M(H) curves of Fe2O3 and Fe2O3-xF2x nanoparticles (left) up to a maximum field of 9T, recorded at room temperature and 4.3K, with the inset showing a close-up of the small field region. M(T) curves (right) of the same samples were recorded in a magnetic field of 10mT.
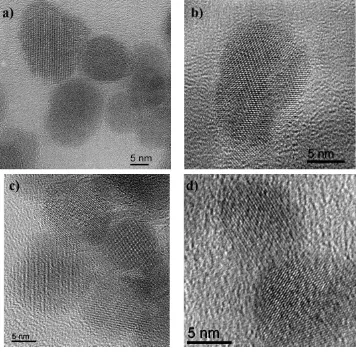
HREM images of -Fe2O3 and fluorinated -Fe2O3 nanoparticles are shown in Figure 5 with 5a
and 5c representative of the size dispersion while 5b and 5d show an enlargement of a single
particle lying in the 011 projection. From the comparison, it is apparent that there is no
14
nanoparticles. Manual measurements carried out on several HREM images of the -Fe2O3 and fluorinated -Fe2O3 nanoparticles and the average size of both sets was found to be 10-12 nm.
The particle size was also estimated using the Scherrer equation, and found to be very similar
[image:15.595.111.469.186.539.2]for the two compounds, approximately 13.1 nm.
15
Figure 6. a) Large area image of uncoated fluorinated -Fe2O3 nanoparticles by HAADF-STEM imaging mode (Z-contrast). b) Typical diffraction pattern taken on an agglomerate.
Figure 6a shows that the nanoparticles tend to agglomerate, and this makes crystallographic
studies on single particles a little difficult. Figure 6b shows a typical diffraction pattern taken
on an agglomerate. The d spacings measured from the diffraction rings correspond to the lattice
of the maghemite phase, confirming that the maghemite crystal structure is maintained after
16
Figure 7. a) HAADF-STEM image of an agglomerate of fluorinated -Fe2O3 nanoparticles, b) X-ray map obtained by using the F K line (in red), c) X-ray map obtained by using the Fe K line (in blue), d) Map obtained by the overlapping of the two individual maps
Figure 7 shows elemental maps for the fluorinated -Fe2O3 nanoparticles and provides an
indication that the distribution of iron and fluorine is homogeneous across the sample.
In order to determine the efficacy of the prepared nanoparticles as MRI contrast agents, MR
measurements were carried out at magnetic field strengths of 11.7 T and 3 T. Current standard
clinical MRI scanners use magnetic field strengths up to 3T, however further development of
the technology may result in scanners utilising much higher magnetic field strengths for routine
[image:17.595.125.473.69.490.2]17
prepared nanoparticles at both clinical field strengths and higher magnetic field strengths, in
order to determine fully the potential of our new fluorinated -Fe2O3 as MRI contrast agent.
-Fe2O3 nanoparticles and fluorinated -Fe2O3 nanoparticles were coated with citric acid to
create stable water suspensions and study the effects of fluoride doping upon the relaxivity.
The data were subsequently compared against each other.
For -Fe2O3 nanoparticles at 3 T, r1 = 0.522 mM1s1 and r2 = 8.14 mM1s1. In comparison, for
the doped -Fe2O3 nanoparticles at 3 T, r1 = 1.74 mM1s1 and r2 = 137 mM1s1. The new
Fe2O3-xF2x nanoparticles show a 3-fold increase in r1 relaxivity in comparison to -Fe2O3
nanoparticles, but more significantly, they show a 17-fold increase in the r2 relaxivity. In addition, at 11.7 T -Fe2O3 nanoparticles exhibited r1 = 3.19 mM1s1 and r2 = 11.4 mM1s1,
greatly icreased upon by the doped -Fe2O3 nanoparticles with an r1 = 18.8 mM1s1, almost a
6-fold increase, and an r2 = 167 mM1s1, a 14-fold increase. For current clinical imaging
applications, lower field strengths of 1.5 to 3 T are standard. Hence, it is important to measure
values at multiple field strengths, although, the higher field will provide improved T2 relaxivity
(r2). The values observed in this study are low to average for -Fe2O3 nanoparticles as would
be expected when the size and coating have not yet been optimised. Specifically, the synthetic
route to prepare -Fe2O3 nanoparticles did not include any templating agent that would have
assure maximum homogeneity in the size of the particle. The reason for this choice is the focus
of this work on the purity of the -Fe2O3 phase to be used as starting material for fluorination,
hence the exclusion of any additional factor that could have led to a sizeable presence of Fe3O4,
as it often occurs. Typical values for previously published and clinically approved NPs are
between 100-350 mM1s1.33 The key point is the dramatic difference on fluoride doping of the
material which has two major impacts: a 14 fold increase in the relaxivity versus the control
nanoparticles and also a significant variation in the r2/r1 ratio which indicates a pure T2 contrast
agent. The next stage will be to produce smaller nanoparticles and observe the influence on T1
relaxivity parameters. The optimisation of coating should further improve the properties. An
optimised fluoride doped iron oxide nanoparticle is likely to have significant increased value
for in vivo imaging and forms the next stage of this study.
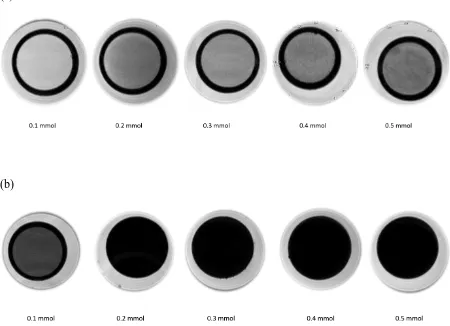
18 (a)
(b)
Figure 8 MRI T2 phantom images of aqueous solutions of -Fe2O3 (a) and Fe2O3xF2x (b) nanoparticles at different concentrations.
Figure 8a shows that, at low concentrations (i.e. 0.1 mmol) there is little difference in relaxivity
between the solution containing -Fe2O3 and the surrounding water, as shown by the similarity
of contrast in both areas of the image. As the concentration on -Fe2O3 in the inner solution
increases, the contrast becomes more negative (darker) showing an increase in the T2 relaxivity
of the -Fe2O3 solution compared to water.
The comparison between Figure 8a and 8b shows an interesting insight. At 0.1mmol
concentration, the difference in contrast between the suspension of Fe2O3xF2x nanoparticles
[image:19.595.72.522.170.496.2]-19
Fe2O3 nanoparticles and the surrounding water. This indicates that even at low concentrations
Fe2O3xF2x may be, potentially, a more effective T2 contrast agent. The images show an
increase in contrast as the concentration of Fe2O3xF2x increases.
Conclusions
IONs ( -Fe2O3 or Fe3O4 nanoparticles) are being heavily investigated for their potential as MRI
contrast agents due to their high biocompatibility in comparison to other magnetic compounds,
their high magnetic moment, low toxicity and wide availability. We prepared almost
single-phase -Fe2O3 nanoparticles (98.5 % -Fe2O3 and 1.5% Fe3O4 in weight) via a co-precipitation
method and subsequently carried out fluoride doping using a simple and low-cost methodology.
Large increases in both r1 and r2 relaxivities are found in the fluorinated nanoparticles, in
comparison to the bare -Fe2O3 nanoparticles. The PXRD patterns do not show any difference
between the -Fe2O3 nanoparticles and their fluorinated counterparts, indicating that
fluorination does not lead to any changes in crystal structure. The Mössbauer spectra reveal
that the oxidation state of iron is unchanged, following fluorination, hinting that a possible
general formula for this material may be Fe2O3-xF2x. HREM shows that the particle size is
unaffected by fluorination and STEM shows a homogeneous distribution of the fluorine
throughout the sample in the doped nanoparticles. However, Mössbauer spectra at 5T magnetic
field show a higher degree of spin canting in the fluorinated material, supporting results from
the magnetic measurements, which show a largely enhanced coercive field and a higher
magnetic anisotropy. Therefore, the large increase in the relaxivities seems to be solely due to
the increased magnetic anisotropy, which may be related to an increased ionicity of the Fe-F
bonds compared to the Fe-O bonds. However, the substitution of two fluoride anions for one
oxide anions may also lead to a stronger hydrogen bonding between the fluoride anion and the
surrounding water molecules, hence inducing changes in the relaxivities of the protons. These
findings could open up possibilities of manipulating the magnetic anisotropy by performing
20
1. R. Qiao, C. Yang, and M. Gao, J. Mater. Chem., 2009, 19, 6274.
2. R. Hufschmid, H. Arami, R. M. Ferguson, M. Gonzales, E. Teeman, L. N. Brush, N. D. Browning, and K. M. Krishnan, Nanoscale, 2015, 7, 11142–11154.
3. D. K. Kim, M. Mikhaylova, Y. Zhang, and M. Muhammed, Chem. Mater., 2003, 15, 1617–1627.
4. K. K. Koenig SH1, Magn. Reson. Med., 1995, 34, 227–33.
5. A. Figuerola, R. Di Corato, L. Manna, and T. Pellegrino, Pharmacol. Res., 2010, 62, 126–143.
6. W. Feitknecht, Rev. Pure Appl. Chem, 1964, 423 – 440.
7. C. Bárcena, A. K. Sra, G. S. Chaubey, C. Khemtong, J. P. Liu, and J. Gao, Chem. Commun. (Camb)., 2008, 2224–6.
8. H. Yang, C. Zhang, X. Shi, H. Hu, X. Du, Y. Fang, Y. Ma, H. Wu, and S. Yang, Biomaterials, 2010, 31, 3667–3673.
9. C. Hu, Z. Gao, and X. Yang, J. Magn. Magn. Mater., 2008, 320, L70–L73.
10. M. G. Francesconi, M. G. Barker, P. a. Cooke, and A. J. Blake, J. Chem. Soc. Dalt. Trans., 2000, 1709–1713.
11. C. Greaves and M. G. Francesconi, Curr. Opin. Solid State Mater. Sci., 1998, 3, 132– 136.
12. J. P. and P. H. J. Claverie, L. Lozano, J. P. Odile, J. Fluor. Chem., 1974, 4, 57–63.
13. H. Zhou, J. Nanda, S. K. Martha, J. Adcock, J. C. Idrobo, L. Baggetto, G. M. Veith, S. Dai, S. Pannala, and N. J. Dudney, J. Phys. Chem. Lett., 2013, 4, 3798–3805.
14. H. Zhou, R. E. Ruther, J. Adcock, W. Zhou, S. Dai, and J. Nanda, ACS Nano, 2015, 9, 2530–2539.
15. H.-Y. Lee, Z. Li, K. Chen, A. R. Hsu, C. Xu, J. Xie, S. Sun, and X. Chen, J. Nucl. Med., 2008, 49, 1371–1379.
16. M. D. Normandin, H. Yuan, M. Q. Wilks, H. H. Chen, J. M. Kinsella, H. Cho, N. J. Guehl, N. Absi-Halabi, S. M. Hosseini, G. El Fakhri, D. E. Sosnovik, and L.
Josephson, Angew. Chemie - Int. Ed., 2015, 54, 13002–13006.
17. B. P. Burke, N. Baghdadi, A. E. Kownacka, S. Nigam, G. S. Clemente, M. M. Al-Yassiry, J. Domarkas, M. Lorch, M. Pickles, P. Gibbs, R. Tripier, C. Cawthorne, and S. J. Archibald, Nanoscale, 2015, 7, 14889–14896.
18. B. P. Burke, N. Baghdadi, G. S. Clemente, N. Camus, A. Guillou, A. E. Kownacka, J. Domarkas, Z. Halime, R. Tripier, and S. J. Archibald, Faraday Discuss., 2014, 175, 59–71.
19. J. Cheon and J. H. Lee, Acc. Chem. Res., 2008, 41, 1630–1640.
20. R. T. M. De Rosales, J. Label. Compd. Radiopharm., 2014, 57, 298–303.
21
22. M. G. Francesconi, P. R. Slater, J. P. Hodges, C. Greaves, P. P. Edwards, and M. Slaski, J. Solid State Chem., 1998, 27, 17–27.
23. M. G. Francesconi and C. Greaves, Supercond. Sci. Technol., 1997, 10, A29–A37.
24. W. Kim, C. Y. Suh, S. W. Cho, K. M. Roh, H. Kwon, K. Song, and I. J. Shon, Talanta, 2012, 94, 348–352.
25. C. Pecharroman, T. Gonzalezcarreno, and J. E. Iglesias, Phys. Chem. Miner., 1995, 22, 21–29.
26. B. V. Crist, Handbook of Monochromatic XPS Spectra, The Elements of Native Oxides, Wiley, 2000.
27. A. P. Grosvenor, B. A. Kobe, M. C. Biesinger, and N. S. McIntyre, Surf. Interface Anal., 2004, 36, 1564–1574.
28. G. F. Goya, T. S. Berquó, F. C. Fonseca, and M. P. Morales, J. Appl. Phys., 2003, 94, 3520–3528.
29. K. Lefmann, F. Bødker, S. N. Klausen, S. Mørup, D. E. Madsen, C. Frandsen, D. E. Madsen, L. Cervera-Gontard, T. Kasama, H. Topsøe, B. S. Clausen, E. L. Duarte, R. Itri, E. Lima, M. F. Hansen, C. B. Koch, D. Predoi, V. Kuncser, E. Tronc, E. Brok, and C. Frandsen, 2000.
30. J. Landers, F. Stromberg, M. Darbandi, C. Schöppner, W. Keune, and H. Wende, J. Phys. Condens. Matter, 2015, 27.
31. R. S. Hargrove and W. Kündig, Solid State Commun., 1970, 8, 303.
32. M. Darbandi, F. Stromberg, J. Landers, N. Reckers, B. Sanyal, W. Keune, and H. Wende, J. Phys. D. Appl. Phys., 2012, 45.