Adaptation
.
White Rose Research Online URL for this paper:
http://eprints.whiterose.ac.uk/104993/
Version: Accepted Version
Proceedings Paper:
Djemame, K orcid.org/0000-0001-5811-5263, Kavanagh, R
orcid.org/0000-0002-9357-2459, Armstrong, D et al. (6 more authors) (2017) Energy
Efficiency Support through Intra-Layer Cloud Stack Adaptation. In: Lecture Notes in
Computer Science. 13th International Conference on Economics of Grids, Clouds,
Systems and Services (GECON 2016), 20-22 Sep 2016, Athens, Greece. Springer Verlag ,
pp. 129-143. ISBN 978-3-319-61919-4
https://doi.org/10.1007/978-3-319-61920-0_10
© Springer International Publishing AG 2017. This is an author produced version of a
paper published in Lecture Notes in Computer Science. The final publication is available at
Springer via https://doi.org/10.1007/978-3-319-61920-0_10. Uploaded in accordance with
the publisher's self-archiving policy.
[email protected] https://eprints.whiterose.ac.uk/
Reuse
Items deposited in White Rose Research Online are protected by copyright, with all rights reserved unless indicated otherwise. They may be downloaded and/or printed for private study, or other acts as permitted by national copyright laws. The publisher or other rights holders may allow further reproduction and re-use of the full text version. This is indicated by the licence information on the White Rose Research Online record for the item.
Takedown
If you consider content in White Rose Research Online to be in breach of UK law, please notify us by
Intra-Layer Cloud Stack Adaptation
Karim Djemame1, Richard Kavanagh1, Django Armstrong1,
Francesc Lordan2, Jorge Ejarque2, Mario Macias2,
Ra¨ul Sirvent2, Jordi Guitart2 3, and Rosa M. Badia2 4
1
School of Computing, University of Leeds, UK
2
Barcelona Supercomputing Center, Spain
3
Universitat Politecnica de Catalunya, Barcelona, Spain
4
Artificial Intelligence Research Institute (IIIA) -Spanish National Research Council (CSIC)
Abstract. Energy consumption is a key concern in cloud computing. The paper reports on a cloud architecture to support energy efficiency at service construction, deployment, and operation. This is achieved through SaaS, PaaS and IaaS intra-layer self-adaptation in isolation. The self-adaptation mechanisms are discussed, as well as their implementa-tion and evaluaimplementa-tion. The experimental results show that the overall ar-chitecture is capable of adapting to meet the energy goals of applications on a per layer basis.
Keywords: Cloud computing, Energy efficiency, Self-adaptation, Programming models.
1
Introduction
The rapid growth of cloud computing and the use of the Internet have produced a large collective electricity demand which is expected to increase by 60% or more by 2020 as the online population steadily increases [9]. Although currently moderate energy consumers, cloud data centres are continuously increasing their energy consumption share as compared to other sectors. Cloud computing offers the potential for energy saving through centralisation of computing and stor-age technologies at large data and computing centres. Some mechanisms are exploited to reduce energy consumption (e.g. server consolidation) but mainly operate at the data centre, hardware and virtual infrastructure level and do not include the platform and software application in their energy reduction ap-proaches.
cloud platform. This paper adds the capabilities required in the architecture in order to achieve dynamic energy management for each of the cloud layers thanks to adaptation, which is supported by anintra-layerapproach. The key research challenge is the ability to take adaptive actions based upon factors such as en-ergy consumption, cost and performance within each layer of the architecture and examine the effect that these have upon the running applications. Therefore, the paper’s main contribution are:
1. an energy efficiency aware cloud architecture, which is discussed in the con-text of the cloud service life cycle: construction, deployment, and operation. 2. an intra-layer self-adaptation methodology tailored for: 1) the SaaS Pro-gramming Model to make use of advanced scheduling techniques that con-sider different versions of an application’s Core Elements, target platform and consumption profile; 2) the Self-Adaptation Manager that manages ap-plications at runtime and maintains performance and energy efficiency at the PaaS layer, and 3) the Self-Adaptation Manager that performs re-scheduling of Virtual Machines (VMs) to maintain energy efficiency and performance at the IaaS layer.
The remainder of the paper is structured as follows: Section 2 describes a proposed architecture to support energy-awareness. Section 3 explains how self-adaptation is supported within the SaaS, PaaS, and IaaS layers of the archi-tecture. Section 4 presents the experimental design, and Section 5 discusses the evaluation results of intra-layer self-adaptation within the layers. Section 6 re-views some related work. In conclusion, Section 7 provides a summary of the research and plans for future work.
2
Energy Efficient Cloud Architecture
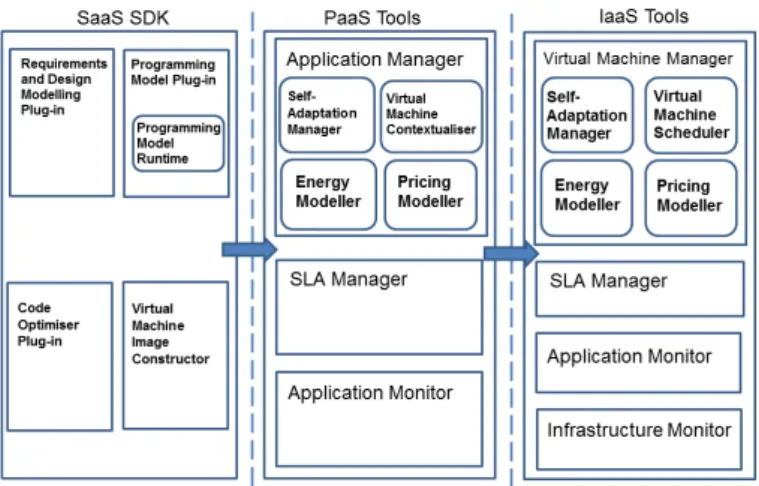
Methods and tools that consider energy efficiency are needed to manage the life cycle of cloud services from requirements to run-time through construction, de-ployment, operation, and their adaptive evolution over time. Their availability will result in an implementation of a software stack for energy efficient-aware clouds. Thus, an architecture supporting energy efficiency and capable of self-adaptation while at the same time aware of the impact on other quality char-acteristics of the overall cloud system such as performance is proposed in [8]. Figure 1 provides an overview of this architecture, which includes the high-level interactions of all components, is separated into three distinct layers and follows the standard cloud deployment model.
In the SaaS layer a set of components interact to facilitate the modelling, design and construction of a cloud application. The components aid in evaluating energy consumption of a cloud application during its construction. A number of plug-ins are provided for a frontend Integrated Development Environment
Fig. 1: Energy-Aware Architecture
energy awareness. The Programming Model Plug-in (PM plug-in) provides a graphical interface to use the Programming Model and supporting tools to enable the development, analysis and profiling of an application in order to improve energy efficiency. On the other hand, theProgramming Modelprovides the service developers with a way to implement services composed of source code, legacy applications executions and external Web Services [11].
ThePaaSlayer provides middleware functionality for a cloud application and facilitates the deployment and operation of the application as a whole. Compo-nents within this layer are responsible for selecting the most energy appropriate provider for a given set of energy requirements and tailoring the application to the selected providers hardware environment. The Application Manager(AM) manages the user applications that are described as virtual appliances, formed by a set of interconnected VMs. Application level monitoring is also accommodated for here, in addition to support for Service Level Agreement (SLA) negotiation.
The Energy Awareness provision is an important step in the architecture implementation plan as it concentrates on delivering energy awareness in all system components. Monitoring and metrics information are measured at IaaS level and propagated through the various layers of the cloud stack (PaaS, SaaS). The Cloud Stack Adaptation with regard to energy efficiency will focus on the addition of capabilities required to achieve dynamic energy management per each of the cloud layers, in other words intra-layer self-adaptation.Inter-layer
self-adaptation is the subject of future work.
3
Intra-Layer Self-Adaptation
This sections explains how dynamic energy management is achieved by the in-dividual cloud layers (SaaS, PaaS and IaaS) through a self-adaptive intra-layer approach.
3.1 SaaS Layer
The Programming Model (PM) is based on the COMPSs Model [5]. This
architectural component enables applications including a single Core Element (CE) to have different implementations together with the possibility of imple-menting energy-aware policies in the PM Runtime. Details on these techniques can be found in [11] where a greedy policy is provided as a proof-of-concept.
To support self-adaptation at the SaaS layer more complex policies are im-plemented as optimization algorithms to adapt the execution of the application at run time. The algorithm is an optimization of one parameter, but filtering out the options that surpass the boundaries defined for the rest of parameters and searches for a local optimal in the discrete search space in every scheduling step. As will be shown in Section 6, self-adaptation at software development level has already been considered in other frameworks, but have not taken into account the three parameters considered here for optimization: energy, performance and cost. Therefore, the scheduling policies at application-level to optimize these three parameters are the key novelty in this layer. More precisely, the policies proposed are: 1) Minimise energy consumption (total Wh used) of the appli-cation run, with instant boundaries for price (EUR/h) and performance (s per CE); 2) Minimise cost (total EUR spent) of the application run, with boundaries for power (W) and performance (s per CE), and 3) Maximise performance (total execution time) of the application run, with boundaries for power (W) and price (EUR/h).
the price of a VM is divided between the applications running together on that VM, and in the PM case the application price can be even divided among all CEs running.
Instant boundaries, such as maximum power, maximum EUR/hour and max-imum execution time for a CE are considered for the adaptation. This is due to the nature of the PM applications. Depending on the application the complete workflow may not always be available to make the scheduling plan in advance. In addition, service-like applications as opposed to batch-like applications do not have a clear completion time. These boundaries will drive the optimization of either: energy, performance or cost, which will be specified by the end user before the execution of the application. It is also worth mentioning that these optimization algorithms mixed with the versioning capabilities presented in [11] enable interesting options for deciding how to execute an application in a set of resources, thus, not only having different machine choices to make that optimiza-tion, but also different pieces of software implementing the same functionality.
3.2 PaaS Layer
ThePaaS Self-Adaptation manager (PaaS SAM)is the principle
compo-nent in the PaaS layer for deciding on the adaptation required to maintain SLAs. The overall aim of this component is to manage the trade-offs between energy, performance and cost during adaptation at runtime. The PaaS SAM is notified of the need to take an adaptation by the SLA manager, see Figure 1.
In this the PaaS SLA Manager, detects a breach of the SLA terms. It then notifies the PaaS SAM of the SLA breach. Notifications of SLA breaches princi-pally contain the following information: 1)Time: the timestamp of the detected violation; 2) Type of violationmessage: This is either a ”violation” if the vio-lation is detected, or ”warning” message if the guarantee is near the viovio-lation threshold; 3) SLA Agreement Term: used to distinguish between different con-straint terms, and 4)SLA Guaranteed State: provides information on the border conditions of the SLA: 1) Guarantee Id: the metric to be monitored; 2) Operator: such as greater than, less than, equal, and 3) Guaranteed Value: the value of the threshold.
The adaptation rules then run in two stages. The first stage indicates the type of adaptation to make such as: add/remove VMs by assessing the causes of the SLA breach. This runs as a match making process by which the noti-fication of the SLA term is matched against the adaptation rules. The PaaS SAM thus matches the decision rules that map between the event notifica-tions and the potential actuators. In its most basic mode of operation a tu-ple of<Agreement Term, Direction, Response Type>is utilised in a match against the SLA violation notification to determine the form of adaptation to take, e.g.<energy usage per app,LT, REMOVE VM>. The types of events that the PaaS SAM can respond to are for the guarantees on the application’s power consumption and the overall energy consumption of an application.
SLA breaches can be ignored. An example of this would be if VM power was to become too high due to a short burst of CPU utilisation. This setting of this threshold value depends on the rate at which the SLA Manager reports SLA violations events and upon how responsive the PaaS SAM is required to be to these violations. A history of recent adaptations is also recorded to ensure that the PaaS SAM will not react a second time in short succession to the same violation event, this history is kept for a shortwhile and once a recent log of adaptation has timed out the PaaS SAM is able to respond again to the same SLA term been violated. This thus puts important limits upon how quickly the PaaS SAM will perform adaptation. In a more advanced mode of operationfuzzy logic is used with the following input parameters: 1) Current metric difference: between the guaranteed value and the actual measured value; 2) Trend difference: between the first detected breaches value and the current detected breaches value, and 3) Energy usage/power usage per Application: counts the number of times the event has fired.
The second stage indicates the exact nature of this adaptation such as what type of VM to add or which VM should be deleted. The principal actuators made available to the PaaS SAM are the ability to: 1) add and remove VMs from an application; 2) scale the VM vertically in terms of its allocated memory and CPUs, and 3) terminate the application as a whole. The engine that makes the decision of the scale of adaptation can be varied but is required to look at the application’s Open Virtualization Format (OVF) document to determine constraints such as the minimum and maximum allowed VMs of a given image type. It then needs to make the selection of which VM to modify or which new type of VM to start.
3.3 IaaS Layer
The VMM is the component responsible for the deployment and life cycle of the VMs, as well as for their disk images. It also allows the IaaS layer to select different scheduling policies such as: energy-aware, cost-aware, distribution and consolidation of VMs.
The migration decision takes into account information about the infrastruc-ture and comes from several architectural components: the Energy Modeller, the Pricing Modeller, the Infrastructure Monitoring, and the SLA Manager (see Figure 1). The information from the aforementioned is used as input into the scoring functions used by OptaPlanner.
The VMM administrator can choose which scoring function will be used by OptaPlanner as a heuristic to perform a local search through all the possible VM/host allocations. Currently, four policies are supported:
Distribution. The VMs are distributed equally along all the available hosts.
This policy maximises the performance of the applications but minimises the energy efficiency.
Consolidation. The VMs are allocated to the minimum number of hosts
(without overselling resources). This policy is energy-efficient but does not con-sider the particularities of the applications that must coexist in the hosts, and how the VMs can interfere between them.
Energy-Efficiency. The VMM asks to the Energy Modeller[8] about the
predicted consumption for a VM into a given host, and chooses the allocation that minimises such consumption.
Price Minimisation. Similar to the Energy-Efficiency policy, but asking
to the Price Modeller for the allocation whose price is the lowest. The Price Modeller gets a prediction of the energy from the Energy Modeller and ponders it with the expected energy prices for a given time range.
4
Experimental Design
This section presents the experimental design. The objective of the experiments is to ascertain that the self-adaptation at SaaS, PaaS and IaaS when monitoring a service in an operation achieves dynamic energy management in each of the cloud layers.
ApplicationTwo applications are used: 1) a compute intensive simulation
application of buildings to optimize their energy, thermal quality and indoor comfort and thus achieve a sustainable design. This is performed by the jEPlus application [2], which is the EnergyPlus [1] simulation manager, a well-known simulation tool in the real estate sector. The jEPlus application implements a parameter-sweep algorithm which performs large scale executions of the Ener-gyPlus simulator with several configurations to find out the optimal setup, and 2) a 3-tier Web application comprising of 5 VMs: one MySQL database VM, one HA Proxy load balancing VM, 2 JBoss Instances/worker nodes and one JMeter based VM that acts as a set of users inducing load onto the system.
Metrics and KPIs A number of metrics and KPIs are used to drive the
monitoring the total energy consumed by the different VMs, see Application Monitor in Figure 1; 3) Application Execution Cost: KPI which is optimized when the PM deploys an application in a cost efficient mode.The PaaS layer also provides the current application total cost thanks to thePricing Modeller, see Figure 1. Other metrics include: 1)Estimated Task Execution Time by the PM Runtime based on historic data of executions; 2)Estimated Task Execution Power/Energy Consumption by the PaaS Energy Modeller; 3) Estimated Task Execution Price/costby PaaS Pricing Modeller, see Figure 1. At the IaaS level, KPIs include: 1)VM power, 2)physical host powerand 3)Datacentre power, as the spot measurement in watts for VM, host and the whole data centre.
Cloud TesbedThe cloud testbed is located at theTechnische Universit¨at
Berlin. The computing cluster consists of 32 nodes with the following attributes: Quadcore Intel Xeon CPU E3-1230 V2 3.30GHz, 16GB RAM, 3x1TB HD and 2x1 GBit Ethernet NIC. Each node is connected to a storage area network usage where storage nodes are accessible through a Distributed File Systems,
CephFS. Virtual Infrastructure Management is supported through an OpenStack Ice House distribution with Neutron and the OpenDaylight software-defined net-working (SDN) controller. Power consumption on each node is measured thanks to identical energy-meters to guarantee comparative measurements. The actual devices are Gembird EnerGenie Energy Meters that share their measurements in the local network. These devices can measure power up to 2,500 Watts with an accuracy of±2% and are able to deliver two measurements per second.
5
Results
5.1 SaaS Layer
Table 1: Application KPI measurements with different configurations
(a) Measurements without ASCETiC PM Improvements
Execution Elapsed Time Energy Consum. Cost Only Threaded Tasks 750 seconds 108.70 Wh 68 Euro-cents Only Sequential Tasks 1152 seconds 93.10 Wh 72 Euro-cents
(b) Measurements with efficient execution improvements
Execution Elapsed Time Energy Consumption Cost
Only Threaded Tasks 662 seconds (-11.7%) 95.70 Wh (-12%) 60 Euro-cents(-11.8%) Only Sequential Tasks 1008 seconds (-12.5%) 81.10 Wh (-12.9%) 63 Euro-cents (-12.5%)
(c) Single Task metrics estimations
Task Version Mean Exec. Time Estim. Mean Power Estim. Energy Consum. Estim. Cost Threaded 125 seconds 26.10 W 0.90 Wh 0.57 Euro-cents Sequential 193 seconds 14.47 W 0.78 Wh 0.60 Euro-cents
(d) Measurements with self-adaptation
Deployment Mode Elapsed Time Energy Consumption Cost Performance Mode 735 seconds 94.37 Wh 61 Euro-cents Energy-efficiency Mode 882 seconds 83.80 Wh 63 Euro-cents Cost-efficiency Mode 751 seconds 94.45 Wh 61 Euro-cents
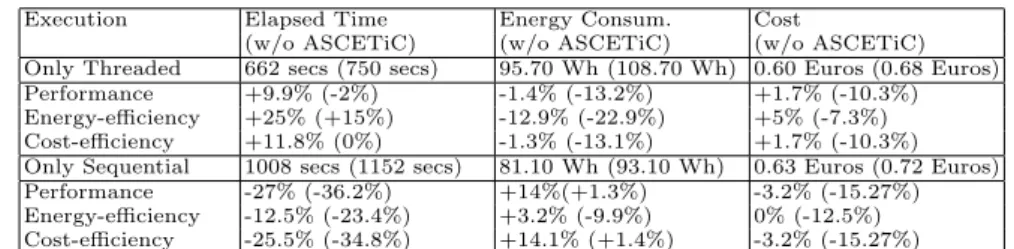
(e) Application Execution KPI comparison
Execution Elapsed Time Energy Consum. Cost
(w/o ASCETiC) (w/o ASCETiC) (w/o ASCETiC) Only Threaded 662 secs (750 secs) 95.70 Wh (108.70 Wh) 0.60 Euros (0.68 Euros) Performance +9.9% (-2%) -1.4% (-13.2%) +1.7% (-10.3%) Energy-efficiency +25% (+15%) -12.9% (-22.9%) +5% (-7.3%) Cost-efficiency +11.8% (0%) -1.3% (-13.1%) +1.7% (-10.3%) Only Sequential 1008 secs (1152 secs) 81.10 Wh (93.10 Wh) 0.63 Euros (0.72 Euros) Performance -27% (-36.2%) +14%(+1.3%) -3.2% (-15.27%) Energy-efficiency -12.5% (-23.4%) +3.2% (-9.9%) 0% (-12.5%) Cost-efficiency -25.5% (-34.8%) +14.1% (+1.4%) -3.2% (-15.27%)
real measurements, mapped to VMs, applications, and CEs, and the cost/price is calculated using fixed factors, and variable factors, such as the cost of the energy used. Afterwards, we introduced the efficient execution improvements in the PM runtime which includes the non-blocking I/O communication and per-sistent workers. We ran the same executions and measured the same KPIs which are shown in Table 1b. A general gain of 12% in all KPIs can be observed.
self-adapted scheduling. In this case, we have executed the application in the three possible modes: the Performance mode, where the elapsed time is optimized; the Energy-efficient mode, where the energy consumption is optimized; and the Cost-efficient mode, where the cost of the execution is optimized. For each of these runs, we measured the same KPIs which are shown in Table 1d. We can observe that the Performance mode gives the smaller elapsed time, the Energy-efficient mode gives the best energy consumption and the Cost-efficient mode gives the cheaper. Note that, cost and performance gives almost the same values because the sequential version has a similar behavior for duration and cost. Therefore, the solution found by the PM runtime in both cases is almost the same.
Finally, Table 1e compares the KPI values obtained in the different exper-iments with baseline. When we compare the versions with the improved PM, we can observe the cost of using the self-adaptation mechanisms. The Only Threadedexecution is the most efficient for the Elapsed time and Cost because it only uses the version which has the best performance and cost. In contrast, the
Only Sequentialexecution is the most energy-efficient because it only executes the version with the best energy consumption. When we compare with the values obtained with Performance, Energy-efficient and Cost-efficient modes, we can see that the KPI are degraded by a 9.9%, 3.2% and 1.7% respectively. This is due to the initial execution of different versions to obtain the first metric values. If we compare the results with the ones obtained without the PM improvements, we can observe that this overhead has been mitigated with the general gain ob-tained by the efficient execution mechanism. It is important to highlight that all the different improvements are obtained only by doing actuations at the SaaS layer, which means distributing the tasks execution in the available VMs, with-out changing either VMs or physical hosts, and we are able to improve some of the metrics even up to a 36%. In addition, the mechanisms give an extra degree of freedom to users, who can decide in advance if their application run will be done chasing minimum execution time, energy or cost.
5.2 PaaS Layer
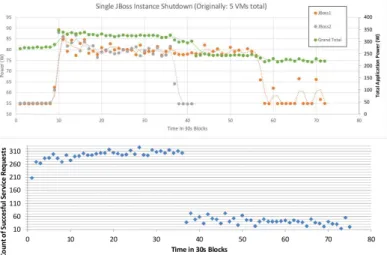
Fig. 2: VMs Trace - 30 second time units division (top); Count of Successful Service Request by JMeter (bottom)
an adaptation to the application once, within a short space of time. The PaaS SAM as part of the experimentation used its rule based threshold system, with the threshold set to first event arriving would trigger adaptation. This threshold could be configured to be higher, especially in cases where the IaaS layer is also expected to adapt. Thus the PaaS SAM could waitntime intervals of warnings from the SLA manager, thus giving the IaaS layer time to adapt before the PaaS intervenes. It has a poll interval of 5 seconds in which it observes the message queue for new events as well as cleans up any historical log of past events that had become too old to consider as still relevant. The PaaS SAM keeps a history of events that last 30 seconds. This time-span is relatively short but it allows the experiment to run smoothly without multiple adaptation events taking place simultaneously. This also limits the time to wait until any additional adaptation can be demonstrated. The PaaS SAM on deciding to remove a VM, in the mode of operation selected for the experiment removes the last VM that was created of the appropriate type. This is done to ensure which VM to be removed is predictable.
of successful service requests is shown in Figure 2 (bottom). It can be seen in the initial phase a short loading period where the induced load increases. In time interval 36 when the VM is switched off the amount of service requests is drastically reduced from an average of 294 service requests to 42 per every 30 seconds block. This therefore demonstrates a trade-off in combination by showing that although power consumption can be reduced there is an associated loss in performance.
5.3 IaaS Layer
The main purpose of this form of self-adaptation management is to demonstrate how the VMM uses the advantages of migration capabilities to reorganize the VMs at runtime, periodically or after events that could leave the testbed in a sub-optimal status to achieve the required policies, such as VM deployment or removal.
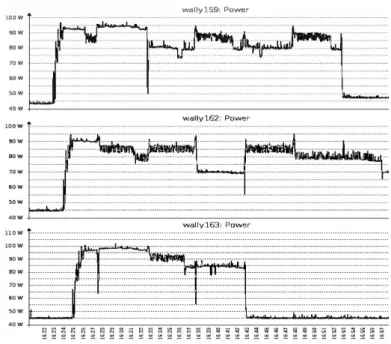
Two jEPlus experiments are performed to test the Self-Adaptation Manager capabilities. In the first experiment, three 8-CPU nodes (wally159, wally162,
wally163) progressively start a 12 VMs with 2 CPUs, 1 GB RAM and, 1 GB Disk executing a 4-thread CPU load generator that performs floating-point matrix multiplications. The VMM is configured with a consolidation policy to deploy the VMs on the lowest number of physical nodes. The OptaPlanner component is configured to look for the optimum allocation by means of Hill Climbing algo-rithm, though with a reduced number of hosts any other local search algorithm would quickly converge to an optimum solution. The intention is to save energy when it is combined with mechanisms to turn off the idle physical nodes and turn them on again when they are required. Every 5 minutes, a VM from a physical host (selected alternatively) is destroyed and the self-adaptation policy is trig-gered to re-consolidate the other VMs. The second experiment is simulated using an Energy Modeller. A set of 30 VMs are deployed progressively in 10 physi-cal hosts and then destroyed. The objective is to compare the same execution with three policies: Consolidation (but without self-adaptation), Power-Aware (allocate VMs in the host that the Energy Modeller predicts it will consume less energy) and Power-Aware with runtime self-adaptation.
First Experiment. Figure 3 shows the effects of self-adaptation in the three
Fig. 3: Historic of power consumption for the three servers
performance of the system in terms of energy efficiency. The VM migration process typically took 10-20 seconds.
Second Experiment. Figure 4 shows the evolution of the overall power
consumption since the beginning of the experiment, with no VMs deployed, until the end, where all the VMs have been undeployed. The measured results show that Power-Aware policy consumes 21% less energy than Consolidation. Savings are higher during the first half of the experiment and later, when the VMs are undeployed, the system becomes non-optimal since the VMs are not consolidated. With Power-Aware with Self Adaptation policy, the system status is optimized when the VMs are destroyed. The overall power consumption is 16% lower with self adaptation with respect to Power-Aware without self-adaptation.
Cost of migrations must not be underestimated. Migrations of memory-intensive VMs are expensive in terms of network and memory usage for the physical nodes. 10-20 seconds is not significant for batch applications, but may decrease the QoS for web services. Future versions of the self-adaptation pol-icy penalise migrations in the scoring functions. To maximise energy efficiency, nodes should provide remote sleep/wake up to allow energy saving when a host becomes idle thanks to consolidation.
6
Related Work
Research effort has targeted energy efficiency support at various stages of the cloud service lifecycle (construction, deployment, operation). Regarding self-adaptation capabilities at software development level, tools such as GreenPipe [13] consider energy as a parameter to be optimised, but it is provided by the user and tailored for a particular type of applications. The PaaS SAM is similar to the SHoWA frameworks recovery planner [12]. The recovery planner is likened to a disease database, with a set of rules on how to treat certain anomalies in performance. The PaaS SAM manager goes further and specifies conditions such as the recent violations of a similar nature and recent adaptation responses. It also avoids pure thresholds and utilises fuzzy logic in order to give a more re-fined response during adaptation. The Synthesis of Cost-effective Adaptation Plans (SCOAP) framework [15] is a similar PaaS/application oriented adapta-tion framework which focuses on the economic costs of utilising Cloud infras-tructures under various pricing models. Mistral [10] is a controller framework that optimizes power consumption, performance benefits as well as the impact of adaptations but with a focus on the IaaS layer. In the serviceoperationstage, energy efficiency has been extensively studied and has focused for example on approaches towards energy management for distributed management of VMs in cloud infrastructures, where the goal is to improve the utilization of computing resources and reduce energy consumption under workload independent quality of service constraints. This approach has been faced during VM allocation [6] and runtime migration [7][14].
7
Conclusion
Acknowledgments
This work is partly supported by the European Commission under FP7-ICT-2013.1.2 contract 610874 (ASCETiC project), by the Spanish Goverment un-der contract TIN2015-65316-P and BES-2013-067167 and by the Generalitat de Catalunya under contract 2014-SGR-1051. Thanks to GreenPreFab Italia for providing the jEPlus application and TU Berlin for their technical support.
References
1. EnergyPlus Building Energy Simulation Program, https://energyplus.net/ 2. JEPlus: EnergyPlus Simulation Manager for Parametrics, http://www.jeplus.org/ 3. OptaPlanner User Guide, http://docs.jboss.org/optaplanner/release/6.4.0.Final/
optaplanner-docs/html/index.html, Last visited on July 2016
4. OptaPlanner Web Site, http://www.optaplanner.org, Last visited on May 2016 5. Badia, R.M., Conejero, J., Diaz, C., Ejarque, J., Lezzi, D., Lordan, F.,
Ramon-Cortes, C., Sirvent, R.: Comp superscalar, an interoperable programming frame-work. SoftwareX 3, 32–36 (2015)
6. Beloglazov, A., Abawajy, J., Buyya, R.: Energy-aware resource allocation heuristics for efficient management of data centers for cloud computing. Future Generation Computer Systems 28(5), 755 – 768 (2012)
7. Dargie, W.: Estimation of the cost of VM migration. In: Computer Communication and Networks (ICCCN) 23rd International Conference. pp. 1–8 (2014)
8. Djemame, K., Armstrong, D., Kavanagh, R., et al: Energy efficiency embedded service lifecycle: Towards an energy efficient cloud computing architecture. In: Pro-ceedings of the 2nd International Conference on ICT for Sustainability 2014. vol. 1203, p. 1–6. Stockholm, Sweden (Aug 2014)
9. Greenpeace: Clicking clean: How companies are creating the green internet (Apr 2014)
10. Jung, G., Hiltunen, M.A., Joshi, K., Schlichting, R., Pu, C.: Mistral: Dynami-cally managing power, performance, and adaptation cost in cloud infrastructures. In: 2010 IEEE 30th International Conference on Distributed Computing Systems (ICDCS). pp. 62–73
11. Lordan, F., Ejarque, J., Sirvent, R., Badia, R.M.: Energy-aware programming model for distributed infrastructures. In: Proceedings of the 24th Euromicro Inter-national Conference on Parallel, Distributed, and Network-Based Processing (PDP 2016). Heraklion, Greece (Feb 2016)
12. Magalhaes, J.P., Silva, L.M.: A framework for self-healing and self-adaptation of cloud-hosted web-based applications. In: Proceedings of the 5th IEEE International Conference on Cloud Computing Technology and Science (CloudCom). pp. 555– 564 (2013)
13. Mao, Y., et al.: GreenPipe: a Hadoop based workflow system on energy-efficient clouds. In: 26th International Parallel and Distributed Processing Symposium Workshops. pp. 2211–2219. IEEE (2012)
14. Murtazaev, A., Oh, S.: Sercon: Server Consolidation Algorithm using Live Migra-tion of Virtual Machines for Green Computing. IETE Technical Review 3(28), 1–8 (2011)