White Rose Research Online URL for this paper:
http://eprints.whiterose.ac.uk/141180/
Version: Published Version
Article:
Indrarathne, Bimali orcid.org/0000-0001-7640-2565, Ratajczak, Michael and Kormos, Judit
(2018) Modelling Changes in the Cognitive Processing of Grammar in Implicit and Explicit
Learning Conditions : Insights from an Eye-Tracking Study. Language Learning. pp.
669-708. ISSN 0023-8333
https://doi.org/10.1111/lang.12290
[email protected] https://eprints.whiterose.ac.uk/ Reuse
This article is distributed under the terms of the Creative Commons Attribution (CC BY) licence. This licence allows you to distribute, remix, tweak, and build upon the work, even commercially, as long as you credit the authors for the original work. More information and the full terms of the licence here:
https://creativecommons.org/licenses/
Takedown
If you consider content in White Rose Research Online to be in breach of UK law, please notify us by
EMPIRICAL STUDY
Modelling Changes in the Cognitive
Processing of Grammar in Implicit
and Explicit Learning Conditions: Insights
From an Eye-Tracking Study
Bimali Indrarathne,a Michael Ratajczak,band Judit Kormosb
aKing’s College London andbLancaster University
This study used eye-tracking to examine changes in how second language (L2) learn-ers process target grammatical exemplars in written L2 input in implicit and explicit instructional conditions and how these changes relate to learning gains. In three sep-arate sessions, 77 L2 learners of English read a story containing seven examples of a grammatical construction. The results of a growth curve analysis indicated significant main effects for the instructional condition and test sessions on total fixation duration and a significant interaction between these two variables. There was minimal attentional processing and no improvement in processing efficiency of the target construction in the unenhanced condition. Learners’ attentional processing in the textually enhanced
A note from the journal editor (Pavel Trofimovich): This article was originally submitted on April 11, 2017 and received positive reviews, which eventually led to the final accept decision, before Judit Kormos joined the editorial team ofLanguage Learningin November 2017. This study was supported by the Economic and Social Research Council of the United King-dom (grant number ES/P00962X/1). We are grateful to the anonymous reviewers and Professor Kara Morgan-Short for their constructive comments and suggestions on previous versions of this manuscript. We also thank Dr. Simon Taylor at Lancaster University for his invaluable assistance with the statistical analysis.
This article has been awarded an Open Materials badge. All materials are pub-licly accessible via the IRIS Repository at https://www.iris-database.org. Learn more about the Open Practices badges from the Center for Open Science: https://osf.io/tvyxz/wiki.
The copyright line for this article was changed on 9 July 2018 after original online publication. Correspondence concerning this article should be addressed to Judit Kormos, Lancaster University, Department of Linguistics and English Language, Lancaster, LA1 4YL, United Kingdom. E-mail: [email protected]
This is an open access article under the terms of the Creative Commons Attribution License, which permits use, distribution and reproduction in any medium, provided the original work is properly cited.
Language Learning 68:3, September 2018, pp. 669–708 669
C
conditions decreased and, by the end of the experiment, they engaged in establish-ing and fine tunestablish-ing form–meanestablish-ing links. In the two explicit instructional conditions, participants’ attention decreased over time and form–meaning representations of the target structure were strengthened.
Keywords attention; eye-tracking; exposure; implicit instruction; explicit instruction
Introduction
Written texts can serve as rich sources of input for second language (L2) learning. Previous research has extensively examined the acquisition of lex-ical knowledge through reading and has focused on the role of frequency of exposure in successful vocabulary learning (e.g., Elgort & Warren, 2014; Pellicer-S´anchez & Schmitt, 2010; Webb, 2007). Considerably less is known, however, about how the frequency of occurrence of a novel syntactic construc-tion contributes to learning through naturalistic unguided and guided exposure to longer and meaningful written texts. Moreover, most studies that have ex-amined grammar learning in incidental and intentional conditions have used artificial or semiartificial languages (e.g., Morgan-Short, Sanz, Steinhauer, & Ullman, 2010; Rebuschat &Williams, 2012; Tagarelli, Borges-Mota, & Rebuschat, 2015), and less research has been conducted with languages for which learners have some prior knowledge (e.g., Cerezo, Caras, & Leow, 2016). Examining the role of frequency of exposure to syntactic construc-tions is crucial for understanding how grammatical knowledge develops from both pedagogical and theoretical perspectives. Such an analysis can assist in the evaluation of the effectiveness of various explicit and implicit instructional techniques used in L2 teaching and in determining how much exposure learners need for noticing and learning novel linguistic features in a written text. From a theoretical perspective, it can contribute to models of associative cognitive learning (Ellis, 2006) and clarify how L2 learners establish form–meaning as-sociations through repeated exposure to a syntactic construction and how they encode these associations in their long-term memory.
Ortega (2000), instructional conditions that have “neither rule presentation nor directions to attend to particular forms that were part of a treatment” (p. 437) can be treated as implicit instruction. The two implicit conditions in our study were (a) input flood, where the frequency of the target item was increased in the input, and (b) textual enhancement, where the target construction was highlighted in the text. The two explicit conditions included (a) instruction to pay attention to a highlighted grammatical construction and (b) an explicit metalinguistic explanation of the target construction complemented by an instruction to pay attention to it in the input (see also Spada & Tomita, 2010).
Literature Review
Cognitive Processes Involved in Acquiring Syntactic Knowledge From Written Input
In order to understand learning processes that might take place while reading a text, it is necessary to give a brief account of reading comprehension pro-cesses at the level of word and syntactic decoding. In Tunmer and Chapman’s (2012) revised simple view of reading, word-level reading skills comprise or-thographic processing (recognizing letters), phonological processing (phono-logical activation of word forms, converting letters to sounds, letter combi-nations to syllables), accessing semantic and syntactic information related to a word, and finally morphological processing to understand words with suf-fixes and presuf-fixes. Similar to the simple view of reading, Reichle, Pollatsek, Fisher, and Rayner’s (1998) E-Z reader model of eye movement control also dis-tinguishes between orthographic familiarity check and full word identification. The above word-level reading processes, also known as word-to-text integration (cf. Perfetti & Stafura, 2014), include the syntactic analysis and assembly of phrasal and clausal constructions, as well as creating a text model, that is, processing the informational content of the text, and a situation model that helps the reader to interpret information presented in the text based on relevant background knowledge (Kintsch, 1998).
its meaning (Tomasello, 2008). In associative cognitive models of L2 learning (Ellis, 2006), incidental learning of L2 grammar is also assumed to involve the establishment of form–meaning associations based on the frequency of co-occurrences in the input.
In the instance-based theory of contextual word learning through reading and in associative cognitive models of grammar learning, each encounter with a novel construction is hypothesized to create a memory trace of the construction and the context in which it occurs. Encounters in the same context strengthen the link between construction and context, whereas diverse contexts assist in fine tuning previously established form–meaning links (Bolger, Balass, Landen, & Perfetti, 2008). Recent research on adult vocabulary learning has also sug-gested that the establishment of form–meaning associations is a two-stage process (Davis & Gaskell, 2009). First, an episodic memory trace is estab-lished quickly, which is then followed by consolidation processes, “such as stabilization (strengthening of a memory trace . . . ), generalization (extraction of gist/rules . . . ), and integration (formation of new relations between novel and old knowledge)” (van der Ven, Takashima, Segers, & Verhoeven, 2015, p. 1).
The Role of Attention in Input Processing
stimuli at a given time are processed. In line with this argument, Treisman’s attenuation model (1964) suggested that stimuli unattended to in the input are not completely blocked or ignored. Instead, they become attenuated or, in other words, less effective.
An important issue concerning the role of attention in input processing is how one’s attention to stimuli changes with repeated exposure. Psychological research on infants that used either picture cards (e.g., Fantz, 1964; Slater, Morison, & Rose, 1982, 1984) or black and white checkerboard targets (e.g., Friedman, 1972) and that measured attention through eye-fixation times found that infants’ attention to repeated and familiar stimuli decreased with time while attention to novel stimuli increased. There are several reasons for this behavior. First, when stimuli become familiar, they are processed rapidly, and thus the time that one needs to spend on such stimuli decreases (Mather, 2013). Second, if stimuli are less complex, the amount of time needed for processing them is also shorter. Third, when one has prior experience in processing a certain stimulus, one needs less time to process the same stimulus on another occasion because prior experience can be applied to aid subsequent processing. Prior experience, however, does not fully explain attention decrease. Thompson and Spencer (1966), who reviewed neurophysiological research on habituation, emphasized that both infants and adults prefer stimuli with an optimal level of new information. When processing stimuli, they attend to repeated stimuli until they reach an optimal level, and then their attention shifts to novel stimuli (Hunter & Ames, 1988).
drawings, measuring attention through reaction times and target identification accuracy. Their results suggested that a decrease in response to repeated stim-uli can indicate more fluent processing, and it might also be a reflection of efficient representation of stimuli (M¨uller, Strumpf, Scholz, Baier, & Melloni, 2013).
In L2 acquisition research, it is generally accepted that paying attention to certain features in the input is necessary for language development (e.g., Leow, 2013; Robinson, Mackey, Gass, & Schmidt, 2012; Schmidt, 1990, 2010), and thus a vast number of studies have attempted to investigate the effect of attention on input processing. Some of these studies used the termattention, while some others have applied the termnoticing, which is attention that involves awareness according to Schmidt (1990). Most recently, eye-tracking methodology has been used to analyze attentional processing. In eye-tracking studies, it is assumed that attentional systems, to some extent, guide and control eye movements, and thus eye fixation duration indicates ongoing cognitive processing (Liversedge, Gilchrist, & Everling, 2011; Rayner & Pollatsek, 1989). Although critics of the method have noted that one can attend to a visual stimulus with no cognitive processes taking place and that not all eye movements are controlled by attention (Hunt & Kingstone, 2003; Juan, Shorter-Jacobi, Schall, & Sperling, 2004), to date, eye-tracking is the most precise tool available for investigating attention to input (Leow, Grey, Marijuan, & Moorman, 2014).
The Role of Frequency in Acquiring Syntactic Knowledge From Written Input
The frequency of occurrence of a hitherto unknown construction plays a key role in both contextual word learning and the acquisition of syntactic knowledge. In order to develop a rich and accurate lexical representation in incidental learning conditions, learners might need 5 to 16 repetitions of a lexical item in the input (Pellicer-S´anchez & Schmitt, 2010; Webb, 2007). Recent eye-tracking research by Elgort et al. (2017) and Godfroid et al. (2017) have also offered insights into how many exposures might be necessary for the reliable establishment of meaning representations and the elaboration of semantic information. The eye movement patterns of L2 learners in both studies indicated that the first 2 to 10 encounters with novel words embedded in a written text served to strengthen the knowledge of the form of a word, and only after 7 to 10 encounters did learners start linking the form of words with their meaning. Mohamed’s (2017) study also demonstrated a gradual decrease in total reading times for unfamiliar words with up to 11 encounters, which suggests that the integration of form– meaning links in incidental vocabulary learning is a slow process. Somewhat different findings were obtained by Pellicer-S´anchez (2016), who found that form–meaning integration had already taken place after three exposures. This relatively fast rate of learning might be explained by the fact that the target words, which were all concrete nouns, occurred in supportive contexts and that repetitions were close to each other (Elgort et al., 2017).
from 13 to 60 whereas in research that observed significant effects, the range was between 4 and 30. Among eye-tracking studies of textual enhancement, Godfroid and Uggen (2013) and Winke (2013) found increased attentional processing of highlighted structures (12 and 17 examples, respectively). Similar findings were obtained in a recent study by Issa and Morgan-Short (in press), which used 30 examples of direct object pronouns in Spanish. In Loewen and Inceoglu’s research, however, no increase in attentional processing was observed (28 target examples).
A small number of studies have investigated the role of frequency of ex-posure in a more systematic way by manipulating the number of exemplars in the input. Leow (1997) included 10 examples of a Spanish target construction in a crossword puzzle and compared learning gains from single and double exposure. He found that learners who had solved the puzzle twice learned sig-nificantly more than those who had completed the task only once. Lee (2002) analyzed differences in learning gains from texts in which a target Spanish morphological structure occurred 6, 10, and 16 times. His results indicated that for meaning recognition, 16 exposures were significantly more effective than 10 or 6 encounters. Those who had encountered the target structure 6 times performed significantly worse in form recognition than those who had read the structure 10 or 16 times. No significant exposure effects were found in a test where learners had to use the target structure productively. In a recent study, Denhovska, Serratrice, and Payne (2016) manipulated both type and token frequency of Russian morphological constructions in the input. Interestingly, their results revealed that learners in the low type (three constructions) and low token (three occurrences) frequency condition achieved the highest level of productive accuracy. The fact that fewer exemplars supported learning better than higher types (seven constructions) and tokens (seven occurrences) was most probably due to the nature of the experiment, where participants were expected to acquire eight different types of morphological endings (masculine vs. feminine in four different cases).
(Gass, Svetics, & Lemlin, 2003; Hern´andez, 2008; Reinders & Ellis, 2009) and included rule explanation conditions (Radwan, 2005; Robinson, 1997; Rosa & O’Neill, 1999; Tode, 2007). All these studies, except for Reinders and Ellis, revealed significant effects of such conditions on L2 acquisition; however, large variations in exposure were also observed, ranging from 10 to 150 items.
The Current Study
As can be seen from the review of relevant literature, there are large variations in the number of exemplars of target grammatical constructions that participants have been exposed to in implicit and explicit learning conditions in previous L2 acquisition research. Moreover, no previous research in the field of L2 acquisition has used eye-tracking to investigate how cognitive processing of grammatical constructions changes with exposure. Our study fills this research gap and addresses the following research questions:
1. How does cognitive processing across experimental sessions differ in ex-plicit and imex-plicit instructional contexts?
2. How does cognitive processing of a target syntactic construction change across exposures?
3. How does cognitive processing of a target syntactic construction change across sessions in explicit and implicit learning conditions?
4. How are total cognitive processing times and changes in cognitive processing time over sessions related to learning gains?
Kormos (2015), Rassaei (2015), and Szudarski and Carter (2016), which showed no substantial learning gains in input flood conditions. TFDs of par-ticipants in the enhanced-only condition were expected to decrease linearly due to attenuation effects in attentional processing, which have been reported in previous studies in the field of cognitive psychology (e.g., Satpute et al., 2016; Yi et al., 2006). It was also hypothesized that participants in the two explicit conditions would demonstrate an S-shaped curve, suggesting an ini-tial decline in attentional processing followed by a plateau indicative of the establishment of form–meaning associations (cf. Davis & Gaskell, 2009) and a final decline resulting from an increase in processing efficiency (cf. van der Ven et al., 2015). This hypothesis was established on the basis of recent eye-tracking studies conducted by Elgort et al. (2017), Godfroid et al. (2017), and Mohamed (2017).
We also formed hypotheses about the strength and direction of correlations between learning gains and mean TFD in each session and magnitude of change of TFD within a session, calculated using the following formula:TFD (TFD change)=TFD for Exemplar 7 – TFD for Exemplar 1. Previous research indi-cated that long TFDs reflect high-level attentional processing (Liversedge et al., 2011; Rayner & Pollatsek, 1989). Therefore, significant positive correlations between TFD and learning gains, that is, an association between long TFD and high increase in posttest scores, signals learning through conscious attentional processes. Conversely, shorter TFD can be a sign of either automatic process-ing or a rapid decrease of attention across the session (cf. Elgort et al., 2017; Godfroid et al., 2017). Consequently, significant negative correlations between TFD and learning gains, that is, when low TFD values are associated with large increases in posttest score, might point to increased automaticity.
Table 1 Hypotheses relating to correlations between eye-tracking measures and learning gains
TFD and learning gain TFD and learning gain
Attention decrease or increase in processing efficiency?
Strong and positive Positive Attention decrease Moderate and
potentially negative
Positive Increase in processing efficiency
Moderate and positive Strong and positive Attention decrease and increase in processing efficiency
Note. TFD=total fixation duration;TFD=magnitude of change of total fixation duration.
in the Supporting Information online), we did not expect to observe increased processing efficiency in the absence of initially high attentional processing. In cases where attention decreases at the same time as processing efficiency increases, there is a large change in TFD because both processes result in lower TFD values. The link between mean TFD and learning gains might be weak because an initially high TFD quickly drops. In our previous study, we found strong positive relationships between TFD and learning gains in all con-ditions except the unenhanced one. Earlier research by Godfroid et al. (2013), Godfroid and Uggen (2013), and Mohamed (2017) also showed a close link between total reading times and lexical development. This led us to assume that a decrease in TFD across sessions would primarily indicate a decrease in attentional processing.
Method
Context and Participants
university for 5 months when the data collection took place. All participants were L1 Sinhalese speakers. They were between 19 and 21 years of age and had learned English for at least 10 years. None spoke any other language except Sinhala and English or had experience of learning another foreign language. Among the 100 participants, 80 were assigned to one of four experimental con-ditions (20 each), and the remaining 20 were assigned to the control condition. All 100 participants took the pretests and posttests, but only those who were in the experimental conditions participated in the eye-tracking phase of the research.
Materials
The researchers wrote three short stories as input texts, each of which con-tained seven examples of the target construction, yielding 21 examples in total (all materials are publicly available in the IRIS repository at https://www.iris-database.org). The topics of the stories were: (a) New house, (b) Mary’s aunt’s shopping, and (c) Joe’s interview. The first was about a house renovation, the second was about a girl taking her aunt shopping, and the third was about a man getting ready for an interview. The first and third stories contained 230 words each, and the second contained 227 words. The texts were checked for lexical complexity using Vocabprofile (Heatley, Nation, & Coxhead, 2002) and for readability indices using Coh-Metrix (Graesser, McNamara, Louwerse, & Cai, 2004). The three texts had very similar readability, lexical, and syntactic characteristics (see Appendix S2 in the Supporting Information online). The texts were checked for grammatical accuracy by one British and one Canadian native speaker of English.
deliveredbecametools delivered). Each target example contained four to eight syllables (for details, see Appendix S3 in the Supporting Information online). In order to provide a purpose for reading, each text contained four comprehension questions that the participants had to answer at the end of the text. Two of the four questions sought to assess the participants’ understanding of the meaning of the target construction, and the other two measured their general comprehension of the text (see Appendix S4 in the Supporting Information online for the texts and comprehension questions and for the comprehension scores of the target construction).
The pretest and posttest included a sentence reconstruction task and a gram-maticality judgment task (available in the IRIS repository at https://www.iris-database.org; see Indrarathne & Kormos, 2017, for more information). There were 20 sentence reconstruction items, including six target items. In this task, the participants were asked to reconstruct the sentences supplied, keeping their meaning the same. The first words were given as a cue. A sample sentence reconstruction item is shown in Example 1.
Example 1
Sara got someone to print invitation cards for her party. Sara had ...
The grammaticality judgment task was aural and timed. The participants lis-tened to a recording of 40 items, including 10 target items presented with an interval of 5 seconds between items, and they were asked to tick the relevant column depending on the accuracy of the sentences. A sample grammaticality judgment item is presented in Example 2. The length of both sentence recon-struction and grammaticality judgment items was controlled, and the British National Corpus (2007) was consulted in writing target items.
Example 2
My dad had his lunch delivered to his office yesterday. Correct/Incorrect
Procedure
portable eye tracker attached to a laptop computer. The second and third input texts were presented with a 1-day interval between texts. Immediately after reading the third text, the posttest was administered. Figure 1 illustrates the experimental design of the study.
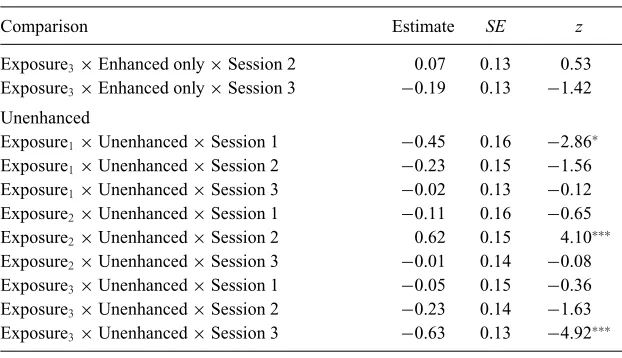
The enhanced + instructions group received input texts with the target items boldfaced, that is, with enhanced input (see Figure 2 for an enhanced sample slide). At the beginning of each input session, participants were also asked to pay attention to the boldfaced phrases. The enhanced+instructions+ explanation group received similar input to that of the enhanced+instructions group, but they were also given an explanation of the meaning and form of the target construction in a PowerPoint presentation immediately before the second session. The examples used in this presentation were taken from Text 1. The enhanced-only group also received the texts with boldfaced items; however, these participants were not asked to pay attention to the target items. The items in the texts that the unenhanced group read were not boldfaced (see Figure 2 for an unenhanced sample slide), nor were the participants in this group asked to pay attention to any particular items in the text.
At the beginning of the first eye-tracking session, the participants were informed about the function of the eye tracker and read a trial slide. At the beginning of each eye-tracking session, a 9-point calibration was performed. The data collection took place in a quiet room and the participants sat ap-proximately 67 centimeters away from the computer monitor. The three input texts were first prepared as PowerPoint slides, then were converted into eye-tracking slides for the Tobii software. The slides included text printed in a 24-point double-spaced Calibri font because this font has been found suitable for screen display (Erickson, 2013). The areas of interest, that is, examples of the target construction (e.g.,had the tools delivered), were placed in one line of the text to facilitate extracting eye-tracking data for these areas (see Figure 2). Each eye-tracking slide contained four to five lines and one or more areas of interest. It was difficult to place all areas of interest in the same lo-cation on each slide because the areas of interest occurred in different parts of sentences as the storyline required. All three stories were spread over seven slides.
R a ta jczak, and K ormos Changes in C ogniti ve P rocessing of Grammar Group A Text 1 Seven examples Enhanced With instructions Text 2 Seven examples Enhanced With instructions Text 3 Seven examples Enhanced With instructions Group B Text 1 Seven examples Enhanced With instructions Text 2 Seven examples Enhanced With instructions Text 3 Seven examples Enhanced With instructions PowerPoint presentation Group C Text 1 Seven examples Enhanced Without instructions Text 2 Seven examples Enhanced Without instructions Text 3 Seven examples Enhanced Without instructions Group D Text 1 Seven examples Unenhanced Without instructions Text 2 Seven examples Unenhanced Without instructions Text 3 Seven examples Unenhanced Without instructions
Figure 1Experimental design.
Figure 2 Example of the enhanced (left) and unenhanced (right) input slides. [Color figure can be viewed at wileyonlinelibrary.com]
experimental groups received condition-specific instructions regarding what they needed to attend to.
Data Analysis
The eye-tracking variable assessed in this study was the TFD (described pre-viously), a commonly used measure to investigate overall cognitive processing load. For the analysis of the relationship between learning gains and eye-tracking measures (see Research Question 4), we calculated the mean TFD and the magnitude of change in TFD in each session using the formula forTFD given previously. TheTFD and TFD values for the separate sessions were av-eraged and used in Spearman rank-order correlations with learning gains in the sentence reconstruction and grammaticality judgment tasks.1 These learning gains were calculated by deducting the pretest scores from the posttest scores (see Appendix S1 for descriptive statistics).
In order to answer our first three research questions, we used growth curve analysis (Mirman, 2014) and analyzed the effects of repeated exposure to a target syntactic construction on TFDs over three reading sessions. The fixed effects included: group (enhanced+instructions, enhanced+instructions+ explanation, enhanced only, and unenhanced) and session (1, 2, and 3). The unenhanced group and the first reading session were considered as the baseline. Exposure was treated as a continuous time-course variable, with each occur-rence of the target construction representing one point in time. Because changes over time are often nonlinear (Mirman), in addition to linear term of exposure (Exposure1), we included higher-order polynomial terms such as quadratic
(Exposure2) and cubic (Exposure3). Following Mirman’s recommendations,
between them. We used natural logarithm transformation to account for the positive skewness of the TFDs. Considering this, the coefficients of our model are interpreted as changes in log-transformed TFDs.
We fitted our models with random effects due to variation in the log TFDs (random intercepts) and in the slopes of fixed effects (random slopes) associated with differences between participants or the materials used (Baayen, Davidson, & Bates, 2008). This allowed us to accurately estimate the fixed effects while accounting for random variations in the log TFDs associated with the differ-ences between participants. Consequently, we minimized the chance of Type I errors because our approach was much less likely to detect spurious significant results than analyses that do not consider random effects (Matuschek, Kliegl, Vasishth, Baayen, & Bates, 2017).
Three participants had to be excluded from the data analysis because they were found to have existing knowledge of the target condition in the sentence reconstruction task on the pretest, that is, they scored 2 or above on this test. The data set also contained several missing responses. Unfortunately, in each testing session, some data had to be omitted because participants’ eye fixations went beyond the screen for a considerable amount of time. Overall, we ana-lyzed 1,309 observations out of the possible 1,617 data points—77 participants reading three texts with seven target constructions per text. This represents approximately 80% of the originally collected eye-tracking data relevant to the target constructions. The lmer function in the lme4 package (Bates, Maechler, Bolker, & Walker, 2015) in R (R Core Team, 2016) was used for the statistical analyses. We tested whether the addition of fixed effects and interactions im-proved the model fit with pairwise likelihood ratio test comparisons of simpler models with more complex models (Baayen, 2008). We summarize the results of the likelihood ratio test comparisons, but we report the estimates of the final model only.
A series of models had been tested. We started with a minimal model containing just the random effects of participants on intercepts and then pro-gressively increasing the model complexity by adding fixed effects, polynomial terms of exposure (Exposure1, Exposure2, Exposure3) and interaction terms.
The minimal model (Model 1) was compared to a model with the effects of: Exposure1, group, and session (Model 2). The likelihood ratio test revealed
that the additional complexity of the model was justified. Model 2 provided a better fit to the data than Model 1, X2(6) =225.27, p <.001. Next, we included all the polynomial terms of exposure to improve the model fit. The model with Exposure1and Exposure2(Model 2i) had a significantly better fit
the model with Exposure1, Exposure2, and Exposure3 (Model 2ii) offered a
better fit than the model with Exposure2 and Exposure1 only,X2(1)=14.85, p<.001. The quartic polynomial term of exposure (Exposure4) did not
im-prove the fit further, X2(1) = 1.60, p = .21, thus we removed it from the model.
To investigate the explanatory value of interaction terms, we compared Model 2ii to a model that added Exposure1, 2, and 3×Group; Exposure1, 2, and 3×
Session; and Group×Session interactions (Model 3). We found that Model 3 was a better fit to the data than Model 2ii,X2(20)=126.52,p<.001. Thus, the inclusion of two-way interactions was justified. Following this, we com-pared Model 3 to a model with added Exposure1, 2, and 3 ×Group ×Session
interactions (Model 4). Once again, increasing the model complexity further improved the model fit, and Model 4 was significantly closer in approximating to reality than Model 3,X2(18)=59.60,p<.001.
Following the recommendations of Bates, Kliegl, Vasishth, and Baayen (2015) for creating a parsimonious model supported by the data, we established the utility of random effects in our model. First, as suggested by Mirman (2014), we tried to nest the participants within the four different experimental groups. However, this led to convergence problems, so consequently, we did not nest participants within the four groups. Next, we determined whether the inclusion of random slopes, that is, random differences between participants in the slopes of fixed effects, improved the model fit to the data. This approach was motivated by the wish to provide stringent tests for the significance of main effects and interactions, allowing us to balance Type I error rate and power (Matuschek et al., 2017). We used pairwise likelihood ratio test comparisons to examine whether the goodness of fit of the model was improved after the addition of terms corresponding to random effects of participants on the slopes of fixed effects. Treating the difference between groups as a random slope did not resolve this problem because, even with this more flexible random effect structure, the model did not converge (Mirman). We found that the inclusion of random effects of participants on the slopes of session significantly improved the goodness of fit of Model 4,X2(5)=67.92,p<.001. Moreover, the addition of random effects of participants on the slopes of Exposure1, Exposure2, and
Exposure3 also improved the goodness of fit,X2(15)= 26.83, p <.05. We report a summary of the final model in Table 2 and show the code used to fit the final model below.
logTFD∼(Exposure1+Exposure2+Exposure3)∗Group∗Session
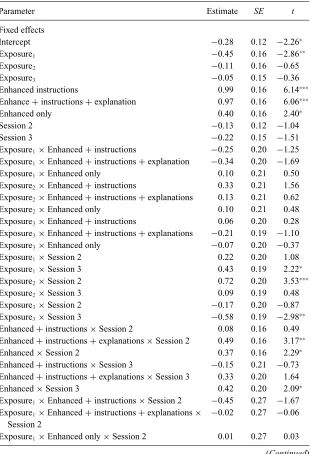
Table 2 Summary of the final statistical model with unenhanced group as the reference level
Parameter Estimate SE t
Fixed effects
Intercept −0.28 0.12 −2.26∗ Exposure1 −0.45 0.16 −2.86∗∗ Exposure2 −0.11 0.16 −0.65 Exposure3 −0.05 0.15 −0.36 Enhanced instructions 0.99 0.16 6.14∗∗∗ Enhance+instructions+explanation 0.97 0.16 6.06∗∗∗ Enhanced only 0.40 0.16 2.40∗ Session 2 −0.13 0.12 −1.04 Session 3 −0.22 0.15 −1.51 Exposure1×Enhanced+instructions −0.25 0.20 −1.25 Exposure1×Enhanced+instructions+explanation −0.34 0.20 −1.69 Exposure1×Enhanced only 0.10 0.21 0.50 Exposure2×Enhanced+instructions 0.33 0.21 1.56 Exposure2×Enhanced+instructions+explanations 0.13 0.21 0.62 Exposure2×Enhanced only 0.10 0.21 0.48 Exposure3×Enhanced+instructions 0.06 0.20 0.28 Exposure3×Enhanced+instructions+explanations −0.21 0.19 −1.10 Exposure3×Enhanced only −0.07 0.20 −0.37 Exposure1×Session 2 0.22 0.20 1.08 Exposure1×Session 3 0.43 0.19 2.22∗ Exposure2×Session 2 0.72 0.20 3.53∗∗∗ Exposure2×Session 3 0.09 0.19 0.48 Exposure3×Session 2 −0.17 0.20 −0.87 Exposure3×Session 3 −0.58 0.19 −2.98∗∗ Enhanced+instructions×Session 2 0.08 0.16 0.49 Enhanced+instructions+explanations×Session 2 0.49 0.16 3.17∗∗ Enhanced×Session 2 0.37 0.16 2.29∗ Enhanced+instructions×Session 3 −0.15 0.21 −0.73 Enhanced+instructions+explanations×Session 3 0.33 0.20 1.64 Enhanced×Session 3 0.42 0.20 2.09∗ Exposure1×Enhanced+instructions×Session 2 −0.45 0.27 −1.67 Exposure1×Enhanced+instructions+explanations×
Session 2
−0.02 0.27 −0.06
Exposure1×Enhanced only×Session 2 0.01 0.27 0.03
Table 2 Continued
Parameter Estimate SE t
Exposure1×Enhanced+instructions×Session 3 −1.32 0.28 −4.78∗∗∗ Exposure1×Enhanced+instructions+explanations×
Session 3
−0.40 0.26 −1.51
Exposure1×Enhanced only×Session 3 −0.05 0.27 −0.18 Exposure2×Enhanced+instructions×Session 2 −0.91 0.27 −3.36∗∗∗ Exposure2×Enhanced+instructions+explanations×
Session 2
−0.44 0.27 −1.66
Exposure2×Enhanced only×Session 2 −0.76 0.27 −2.76∗∗ Exposure2×Enhanced+instructions×Session 3 −0.48 0.28 −1.73 Exposure2×Enhanced+instructions+explanations×
Session 3
0.19 0.26 0.72
Exposure2×Enhanced only×Session 3 0.30 0.27 1.11 Exposure3×Enhanced+instructions×Session 2 0.17 0.27 0.63 Exposure3×Enhanced+instructions+explanations×
Session 2
0.31 0.26 1.19
Exposure3×Enhanced only×Session 2 0.37 0.27 1.37 Exposure3×Enhanced+instructions×Session 3 0.04 0.28 0.14 Exposure3×Enhanced+instructions+explanations×
Session 3
0.81 0.26 3.10∗∗
Exposure3×Enhanced only×Session 3 0.52 0.27 1.95
Random effects (intercept)
Random
slopes Variance SD
Participants 0.16 0.40
Session 2 0.09 0.31 Session 3 0.22 0.47 Exposure1 0.04 0.19 Exposure2 0.06 0.25 Exposure3 0.02 0.14
Information criteria Estimate
Log-Likelihood −1106.60 Defiance information criterion 2213.30 Akaike information criterion 2353.30 Bayesian information criterion 2715.70
Table 2 Continued
R2 Estimate
Marginala .43
Conditionalb .64
Notes. Exposure1 = the linear term of exposure; Exposure2 = the quadratic term of exposure; Exposure3 = the cubic term of exposure. aMarginal R2 describes the proportion of variance explained by the fixed factors alone.bConditionalR2describes the proportion of variance explained by both the fixed and random factors.∗p
<.05; ∗∗p
<.01;∗∗∗p <.001.
Results
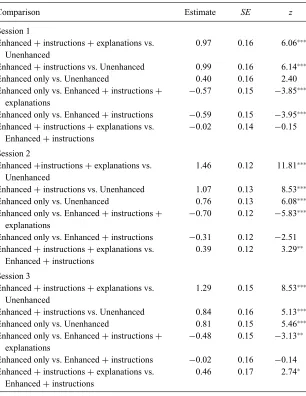
Differences in Eye-Tracking Measures Across Groups and Sessions
In our first research question, we asked how the cognitive processing of a target syntactic construction differs in explicit and implicit instructional con-ditions and across experimental sessions. We adjusted thepvalue for multiple comparisons using the single-step method, in which p values are computed from the joint normal ortdistribution of the linear function. Using these ad-justments, we found several differences in TFD between groups and across sessions. In every session, participants in both explicit groups fixated for sig-nificantly longer on target constructions than did those in the unenhanced group (see Table 3). In the same way, across all sessions, those in the en-hanced+instructions+explanation group looked at the target constructions significantly longer than those in the enhanced-only group. In contrast, only in Session 1 did participants in the enhanced +instructions group fixate for significantly longer on target constructions than those in the enhanced-only group. In the remaining two sessions, there were no significant differences between these two groups. In Sessions 2 and 3 in the two implicit groups, participants in the enhanced-only group fixated for longer on the target con-structions than participants in the unenhanced group. However, there were no significant differences between unenhanced and enhanced-only groups in Session 1.
Table 3 Multiple comparisons of groups within sessions
Comparison Estimate SE z
Session 1
Enhanced+instructions+explanations vs. Unenhanced
0.97 0.16 6.06∗∗∗
Enhanced+instructions vs. Unenhanced 0.99 0.16 6.14∗∗∗ Enhanced only vs. Unenhanced 0.40 0.16 2.40 Enhanced only vs. Enhanced+instructions+
explanations
−0.57 0.15 −3.85∗∗∗
Enhanced only vs. Enhanced+instructions −0.59 0.15 −3.95∗∗∗ Enhanced+instructions+explanations vs.
Enhanced+instructions
−0.02 0.14 −0.15
Session 2
Enhanced+instructions+explanations vs. Unenhanced
1.46 0.12 11.81∗∗∗
Enhanced+instructions vs. Unenhanced 1.07 0.13 8.53∗∗∗ Enhanced only vs. Unenhanced 0.76 0.13 6.08∗∗∗ Enhanced only vs. Enhanced+instructions+
explanations
−0.70 0.12 −5.83∗∗∗
Enhanced only vs. Enhanced+instructions −0.31 0.12 −2.51 Enhanced+instructions+explanations vs.
Enhanced+instructions
0.39 0.12 3.29∗∗
Session 3
Enhanced+instructions+explanations vs. Unenhanced
1.29 0.15 8.53∗∗∗
Enhanced+instructions vs. Unenhanced 0.84 0.16 5.13∗∗∗ Enhanced only vs. Unenhanced 0.81 0.15 5.46∗∗∗ Enhanced only vs. Enhanced+instructions+
explanations
−0.48 0.15 −3.13∗∗
Enhanced only vs. Enhanced+instructions −0.02 0.16 −0.14 Enhanced+instructions+explanations vs.
Enhanced+instructions
0.46 0.17 2.74∗
∗p
<.05;∗∗p
<.01;∗∗∗p <.001.
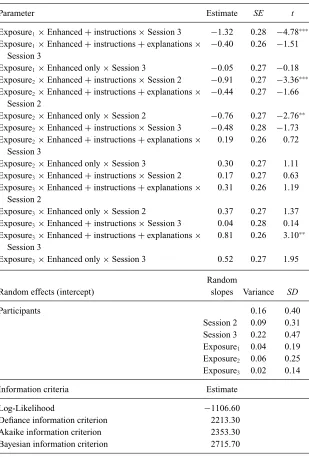
Change in Cognitive Processing Across Exposures
Table 4 Multiple comparisons: Sessions within groups
Comparison Estimate SE z
Enhanced+instructions+explanations
Session 2 vs. Session 1 0.37 0.10 3.74∗∗∗ Session 3 vs. Session 1 0.10 0.13 0.78 Session 3 vs. Session 2 −0.26 0.11 −2.39∗
Enhanced+instructions:
Session 2 vs. Session 1 −0.05 0.10 −0.47 Session 3 vs. Session 1 −0.37 0.15 −2.51∗ Session 3 vs. Session 2 −0.32 0.13 −2.57∗
Enhanced only
Session 2 vs. Session 1 0.24 0.10 2.30 Session 3 vs. Session 1 0.20 0.14 1.45 Session 3 vs. Session 2 −0.04 0.11 −0.38
Unenhanced
Session 2 vs. Session 1 −0.13 0.12 −1.04 Session 3 vs. Session 1 −0.22 0.15 −1.51 Session 3 vs. Session 2 −0.10 0.11 −0.86
∗p
<.05;∗∗p
<.01;∗∗∗p <.001.
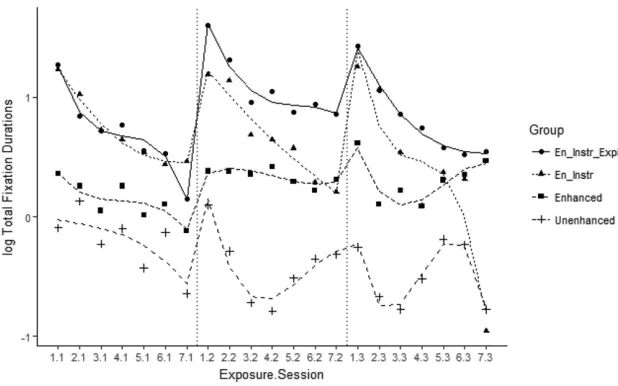
of Exposure1, 2, and, 3×Group×Session (see Table 5) illustrate that the rate of
change in log TFDs varied by group and session. Figure 4 and Table 5 show a difference in systematicity between the explicit and implicit groups.
Figure 3 The effects of exposure on total fixation durations averaged across groups and sessions. Error bars represent 95% confidence intervals.
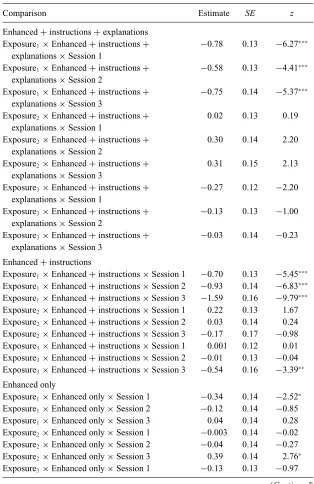
[image:25.432.55.364.314.507.2]Table 5 Multiple comparisons: Interactions of exposure, group, and session
Comparison Estimate SE z
Enhanced+instructions+explanations Exposure1×Enhanced+instructions+
explanations×Session 1
−0.78 0.13 −6.27∗∗∗
Exposure1×Enhanced+instructions+ explanations×Session 2
−0.58 0.13 −4.41∗∗∗
Exposure1×Enhanced+instructions+ explanations×Session 3
−0.75 0.14 −5.37∗∗∗
Exposure2×Enhanced+instructions+ explanations×Session 1
0.02 0.13 0.19
Exposure2×Enhanced+instructions+ explanations×Session 2
0.30 0.14 2.20
Exposure2×Enhanced+instructions+ explanations×Session 3
0.31 0.15 2.13
Exposure3×Enhanced+instructions+ explanations×Session 1
−0.27 0.12 −2.20
Exposure3×Enhanced+instructions+ explanations×Session 2
−0.13 0.13 −1.00
Exposure3×Enhanced+instructions+ explanations×Session 3
−0.03 0.14 −0.23
Enhanced+instructions
Exposure1×Enhanced+instructions×Session 1 −0.70 0.13 −5.45∗∗∗ Exposure1×Enhanced+instructions×Session 2 −0.93 0.14 −6.83∗∗∗ Exposure1×Enhanced+instructions×Session 3 −1.59 0.16 −9.79∗∗∗ Exposure2×Enhanced+instructions×Session 1 0.22 0.13 1.67 Exposure2×Enhanced+instructions×Session 2 0.03 0.14 0.24 Exposure2×Enhanced+instructions×Session 3 −0.17 0.17 −0.98 Exposure3×Enhanced+instructions×Session 1 0.001 0.12 0.01 Exposure3×Enhanced+instructions×Session 2 −0.01 0.13 −0.04 Exposure3×Enhanced+instructions×Session 3 −0.54 0.16 −3.39∗∗
Enhanced only
Exposure1×Enhanced only×Session 1 −0.34 0.14 −2.52∗ Exposure1×Enhanced only×Session 2 −0.12 0.14 −0.85 Exposure1×Enhanced only×Session 3 0.04 0.14 0.28 Exposure2×Enhanced only×Session 1 −0.003 0.14 −0.02 Exposure2×Enhanced only×Session 2 −0.04 0.14 −0.27 Exposure2×Enhanced only×Session 3 0.39 0.14 2.76∗ Exposure3×Enhanced only×Session 1 −0.13 0.13 −0.97
Table 5 Continued
Comparison Estimate SE z
Exposure3×Enhanced only×Session 2 0.07 0.13 0.53 Exposure3×Enhanced only×Session 3 −0.19 0.13 −1.42
Unenhanced
Exposure1×Unenhanced×Session 1 −0.45 0.16 −2.86∗ Exposure1×Unenhanced×Session 2 −0.23 0.15 −1.56 Exposure1×Unenhanced×Session 3 −0.02 0.13 −0.12 Exposure2×Unenhanced×Session 1 −0.11 0.16 −0.65 Exposure2×Unenhanced×Session 2 0.62 0.15 4.10∗∗∗ Exposure2×Unenhanced×Session 3 −0.01 0.14 −0.08 Exposure3×Unenhanced×Session 1 −0.05 0.15 −0.36 Exposure3×Unenhanced×Session 2 −0.23 0.14 −1.63 Exposure3×Unenhanced×Session 3 −0.63 0.13 −4.92∗∗∗
Note. Exposure1 =the linear term of exposure; Exposure2 = the quadratic term of exposure; Exposure3=the cubic term of exposure.∗p
<.05;∗∗p
<.01;∗∗∗p <.001.
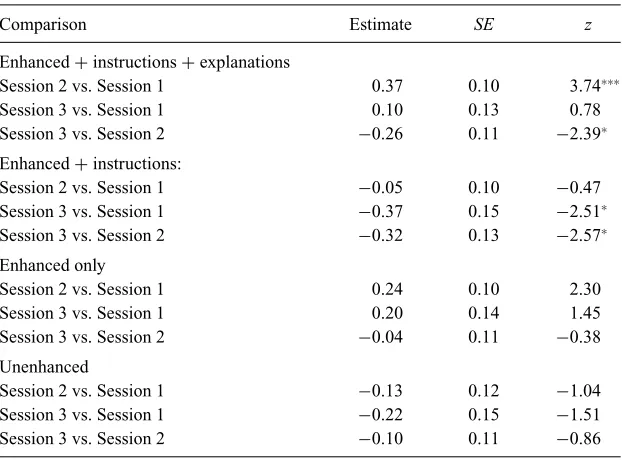
Relationship Between Eye-Tracking Measures and Learning Gains
Table 6 shows that the mean TFD value across sessions correlated signifi-cantly with the gains in the sentence reconstruction task in all experimental groups, except in the unenhanced condition.2Improvement in grammaticality
judgment scores was significantly associated with the mean TFD values in the enhanced+instructions+explanation group and in the enhanced group. The mean TFD across sessions showed significant correlations with sentence reconstruction and grammaticality judgment gains only in the enhanced + instructions group.
Discussion
Differences in Cognitive Processing Across Groups and Sessions
R
a
ta
jczak,
and
K
ormos
Changes
in
C
ogniti
ve
P
rocessing
of
[image:28.432.83.573.157.292.2]Grammar
Table 6 Correlations between sentence reconstruction (SR) and grammaticality judgment (GJ) learning gains and mean total fixation duration (TDF) and mean magnitude of change of total fixation duration (TFD) across sessions
Group (n)
Eye-tracking
M
SR gain
rho
GJ gain
rho Psycholinguistic process
Enhanced+instructions+explanations (14) TFD .793∗∗∗ .761∗∗∗ Attention decrease and establishment
of form-meaning links
TFD .521 .530
Enhanced+instructions (10) TFD .583∗ .281 Attention decrease and increase in
processing efficiency
TFD .647∗ .798∗∗∗
Enhanced only (11) TFD .612∗ .654∗ Attention decrease and establishment
of form-meaning links
TFD −.256 −.040
Unenhanced (10) TFD −.242 −.272 Minimal attentional processing
TFD .316 .077
∗p
<.05;∗∗∗p
<.001.
Language
L
e
arning
68:3,
September
2018,
pp.
conditions. This yields evidence for the important role of explicit instructional conditions in drawing attention to a target grammatical construction in written input (see also Indrarathne & Kormos, 2017). The lack of any significant differ-ence between the enhanced and unenhanced conditions in Session 1 is similar to the results of Loewen and Inceoglu (2016), who did not find increased atten-tional processing when exemplars were visually enhanced. Addiatten-tional evidence that textual enhancement might have had benefits for the participants can also be seen in the comparisons of the enhanced-only and unenhanced groups in Sessions 2 and 3. Similar to the findings of Godfroid and Uggen (2013), Winke (2013), and Issa and Morgan-Short (in press), the results show that in these ses-sions the enhanced-only group fixated on the target constructions significantly longer than the unenhanced group. Based on these results, we can draw the tentative conclusion that the effects of visual enhancement might take longer to manifest themselves and might not be strong enough to be detected in the first exposure session or in the first few exemplars.
As regards the two-way interactions between experimental condition and session, our results provide support for our initial hypothesis and point to the beneficial effects of the explicit explanation in the enhanced+instructions+ explanation group between Sessions 1 and 2. The results show that the enhanced + instructions + explanation group fixated longer on exemplars in Session 2 than in Sessions 1 and 3. This increased eye-fixation measure suggests that participants in this group might have engaged in a deeper level of cognitive processing while reading Text 2. This might have involved “cognitive effort, level of analysis, elaboration of intake together with the usage of prior knowledge, hypothesis testing and rule formation” (Leow, 2015, p. 204). There was no difference, however, between the TFDs in Sessions 1 and 3, which sug-gests that the effect of the explanation on attention may dissipate when learners encounter the target construction later. However, some kind of carryover effect can be seen because the enhanced +instructions +explanation group had higher TFD than the enhanced+instructions group in Session 3. This con-trasts with the results of the enhanced+instructions group, where participants fixated on exemplars in Session 3 for a shorter time than in Sessions 1 and 2.
Changes in Cognitive Processing and Relationship to Learning Gains
et al., 2015) and L2 syntax research (Denhovska et al., 2016) as well as with the associative cognitive model of L2 learning (Ellis, 2006), which has shown that there is a period of stabilization after a relatively short period of intensive cognitive processing when a memory trace of the item is created following a familiarity check. During this period, a form–meaning link is established by extracting regularities and fine tuning frequency-based associations. The fact that the curve became flatter after the third exposure resembles the results of Pellicer-S´anchez’s vocabulary study, which was similar to our research in that nonwords also occurred in supportive contexts and were embedded in relatively short texts. The contextual word-learning studies in more naturalistic contexts by Godfroid et al. (2017) and Elgort et al. (2017) detected a flattening curve at much later points and indicated the need for a higher number of exposures than does Pellicer-S´anchez’s and our research.
We examined the growth curve for the separate groups in order to answer our third research question, which addressed the possible changes in cognitive processing of a target syntactic construction across sessions in explicit and im-plicit learning conditions. The analyses revealed a complex interaction between changes in processing efficiency and attention decrease. First, the results show that the decrease in TFD in Session 1 was linear for all groups. Significant linear reductions in TFD might be explained with reference to the process of habit-uation rather than by increases in processing efficiency, which usually follow an S-shaped curve (for a recent discussion, see Murre, 2014). As the novelty of the target construction decreases, less attention is paid to it (Turk-Browne, Scholl, & Chun, 2008). The gradual linear decrease up to seventh exposure also indicates that subsequent presentations of stimuli were still within the focus of attention because participants perceived that it contained some new information for further processing. This result is similar to that reported by M¨uller et al. (2013) in the field of cognitive psychology, which showed that the response to a stimulus only decreases after the sixth presentation occasion. The linear decrease in Session 1 is also in line with the research of Elgort et al. (2017) and Godfroid (2017), in which a speed-up in processing only took place between 6 and 10 exposures.
in little cognitive processing other than decoding the form of the target exemplars.
In the enhanced-only group, the patterns of change in TFD showed some-what more systematicity, but fixation durations remained short and learning gains only appeared in the grammaticality judgment task, which required the recognition of accurate target items under time constraints. There is a strong link, however, between TFD and learning gains in both tasks, and a stable speed of cognitive processing was observed in Session 2. By complementing these results with the negative correlation betweenTFD and grammaticality judgment gain scores in Session 2,rho= −.538;p=.03, one can argue that those participants who were able to maintain their cognitive processing efforts in Session 2, when seeing visually enhanced exemplars, improved their recog-nition knowledge more than those who paid less attention to these exemplars. The U-shaped curve in Session 3 might indicate that participants recognized the form of the construction relatively quickly at the beginning of the session, and by the end they might have started to engage in establishing and fine tuning form–meaning links. Although this is a tentative conclusion that would need to be followed up with further observations, this explanation seems similar to the interpretation of the patterns seen in Elgort et al.’s (2017) study. In Elgort et al.’s research, their participants encountered nonwords embedded in a text, which might have raised their attentional processing due to the unexpected nature of the nonwords, just as textual enhancement might have directed our participants’ attention to unfamiliar target items. Elgort et al.’s results, like ours, suggest that integrating meaning with context might only commence after 10 exposures and last well beyond 20 encounters.
that the S-shaped curve in the last session represents not only an attenuation of attention but an observable increase in processing efficiency. The number of exposures after which this high level of processing efficiency seems to be achieved bears very close resemblance to the findings of Godfroid et al.’s (2017) study, where they also detected a sudden drop in TFD between Exemplars 16 and 23.
In the case of the enhanced+instructions+explanation group, we found only linear patterns of decrease. Each session was characterized by an initial high level of attention, with Session 2 demonstrating an even more elevated TFD due to the explicit metalinguistic explanation. The analysis of the links between learning gains and TFD and TFD values also suggests that the change in TFD across exposure was primarily a reflection of the attenuation of attention and participants’ conscious efforts to establish form–meaning links. Although the gains in both tasks were similar in the enhanced+instructions + explanation and enhanced + instructions conditions (see Indrarathne & Kormos, 2017), the metalinguistic explanation did not result in a sudden increase in the level of processing efficiency that we observed in the enhanced + instructions condition. A possible reason for this might be that, because there was a one-to-one form–meaning mapping in the target construction, the rule search condition and visual enhancement might have been sufficient to assist participants, and the relatively short explicit metalinguistic information might have facilitated processing only in Session 2 (cf. VanPatten, Collopy, & Qualin, 2012).
Implications for Theory and Practice
The results of our study indicate that increased cognitive processing of visually enhanced examples of a target structure might take place only after encountering a few exemplars or after initial exposure to a short text. Therefore, when studying the effects of textual enhancement, it is important to examine the patterns of change in eye-tracking measures across exemplars and ses-sions and not only to consider averaged values during the whole experiment. The findings also provide evidence for the benefits of explicit metalinguistic information such as that which we provided before Session 2 for increased at-tentional processing. It is important to note, however, that only the participants in the guided discovery condition, that is, those in the enhanced+instructions group, demonstrated an S-shaped curve of development, which is indicative of change in processing efficiency. Although this potential difference in cognitive processing between the two explicit learning conditions did not manifest it-self in differences in immediate learning gains, it would be worth exploring the long-term benefits of guided discovery and explicit metalinguistic explanations with delayed posttests.
From a pedagogical perspective, our research is important because it sug-gests that subsequent input sessions within a few days, with a different reading text, and different exemplars of the target structure, can sustain learners’ atten-tion if learners receive some scaffolding either in the form of textual enhance-ment or through guided discovery. This finding also lends support to studies demonstrating the usefulness of distributed practice (e.g., Rogers, 2015). Our study reveals that while 21 exposures divided into three sessions over a week might be sufficient for participants in explicit learning conditions to establish form–meaning links and to speed up the processing of these links, they need further opportunities for practice and feedback to develop strong represen-tations of grammatical constructions and to be able to use them efficiently. The number of exemplars and the distributed input we provided in the un-enhanced condition seemed to engage participants in decoding the form of the structure only and did not assist them in establishing form–meaning links. Textual enhancement was found to help participants maintain their attention after an initial exposure and to lead them to establish some preliminary form– meaning representations. However, these participants would have needed either more exposure or additional guidance to fully understand these form–meaning links.
to confirm our findings. Previous studies in the field of cognitive psychology have shown that the complexity of the stimulus plays an important role in influencing a decrease in attention (Mather, 2013). Consequently, it is impor-tant to replicate our study with different syntactic constructions. In our study, we repeatedly presented the target construction with different verbs and nouns to the participants. In further studies, it would also be necessary to examine how the cognitive processing of the same token of the target construction changes through exposures and whether type and token frequency exert different influ-ences on eye-tracking measures and on learning outcomes. In our study, the order of experimental sessions was not counterbalanced. Although we ensured that the input texts had highly similar readability statistics and linguistic char-acteristics, a replication study where the order of sessions is controlled is also desirable.
Conclusion
In summary, our findings lend support to the assumption that the establishment of form–meaning links in the acquisition of L2 syntactic constructions shares a number of similarities with how L2 vocabulary knowledge develops through exposure to written input (e.g., Davis & Gaskell, 2009; Pellicer-S´anchez, 2016; van der Ven et al., 2015). The observed S-shaped pattern of the growth curve suggests that when L2 learners first encounter a novel syntactic construction in a reading text, they actively engage in decoding the form and start an-alyzing its meaning. During the second and third exposures learners make attempts at fine tuning the form–meaning links (Bolger et al., 2008) and ex-tracting patterns of regularities (Tomasello, 2008). Following this, in line with the associative cognitive models of L2 learning (Ellis, 2006), the flattening shape of the curve indicates that on further encounters L2 learners strengthen the form–meaning associations and accelerate the speed with which they rec-ognize the target construction. Nevertheless, the development of the productive and receptive knowledge of the target syntactic construction seems to be a slow process similar to the process of incidental vocabulary learning. As our research indicates, after 21 exposures, even participants in the explicit instruc-tional conditions achieved relatively modest learning gains (see Appendix S1; cf. Indrarathne & Kormos, 2017). This underscores the need for providing L2 learners not only with input but also with meaningful output and interaction opportunities to apply novel syntactic constructions, to gain feedback, and ultimately to develop automaticity in using these constructions.
Notes
1 It would have been interesting to investigate the associations betweenTFD, TFD, and learning gains separately for the three sessions across experimental groups. However, this would have resulted in a large number of correlational analyses. Because our sample size for these analyses was relatively low, it could have substantially increased the chances of a Type I error.
2 Group sizes in these analyses are much smaller than the group sizes in the analyses reported earlier because of data loss in the eye-tracking study. For these analyses, we only considered participants for whom reliable eye-tracking data were available for each of the three sessions.
References
Baayen, R. H. (2008).Analyzing linguistic data. A practical introduction to statistics using R. Cambridge, UK: Cambridge University Press.
Baayen, R. H., Davidson, D. J., & Bates, D. M. (2008). Mixed-effects modeling with crossed random effects for subjects and items.Journal of Memory and Language, 59, 390–412. https://doi.org/10.1016/j.jml.2007.12.005
Bates, D., Kliegl, R., Vasishth, S., & Baayen, H. (2015).Parsimonious mixed models. Retrieved November 1, 2016, from https://arXiv.org/abs/1506.04967
Bates, D., Maechler, M., Bolker, B., & Walker, S. (2015). Fitting linear mixed-effects models using lme4.Journal of Statistical Software,67, 1–48. https://doi.org/10. 18637/jss.v067.i01
Bolger, D. J., Balass, M., Landen, E., & Perfetti, C. A. (2008). Context variation and definitions in learning the meanings of words: An instance-based learning approach. Discourse Processes,45, 122–159. https://doi.org/10.1080/01638530701792826 British National Corpus. (2007). Distributed by Bodleian Libraries, University of
Oxford, on behalf of the BNC Consortium (Version 3).
Cerezo, L., Caras, A., & Leow, R. (2016). The effectiveness of guided induction versus deductive instruction on the development of complex Spanish gustar structures: An analysis of learning outcomes and processes.Studies in Second Language
Acquisition,38, 265–291. https://doi.org/10.1017/S0272263116000139
Chun, M. M., Golomb, J. D., & Turk-Browne, N. B. (2011). A taxonomy of external and internal attention.Annual Review of Psychology,62, 73–101. https://doi.org/ 10.1146/annurev.psych.093008.100427
Council of Europe. (2001).Common European Framework of Reference for Languages. Strasbourg, France: Language Policy Division, Council of Europe. Retrieved August 14, 2017, from https://www.coe.int/t/dg4/linguistic/Source/ Framework_EN.pdf
Denhovska, N., Serratrice, L., & Payne, J. (2016). Acquisition of second language grammar under incidental learning conditions: The role of frequency and working memory.Language Learning,66, 159–190. https://doi.org/10.1111/lang. 12142
Elgort, I., Brysbaert, M., Stevens, M., & Van Assche, E. (2017). Contextual word learning during reading in a second language: An eye-movement study.Studies in Second Language Acquisition. Published online June 21, 2017. https://doi.org/10. 1017/S0272263117000109
Elgort, I., & Warren, P. (2014). L2 vocabulary learning from reading: Explicit and tacit lexical knowledge and the role of learner and item variables.Language Learning, 64, 365–414. https://doi.org/10.1111/lang.12052
Ellis, N. C. (2006). Selective attention and transfer phenomena in L2 acquisition: Contingency, cue competition, salience, interference, overshadowing, blocking and perceptual learning.Applied Linguistics,27, 164–194. https://doi.org/10.1093/ applin/aml015
Erickson, A. P. (2013).The ABC’s of font: Effects of changing default fonts. Master’s thesis. Retrieved November 1, 2016, from EWU Masters Thesis Collection. (Paper 108).
Fantz, R. L. (1964). Visual experience in infants: Decreased attention to familiar patterns relative to novel ones.Science,146, 668–670. https://doi.org/10.1126/ science.146.3644.668
Friedman, S. (1972). Habituation and recovery of visual response in the alert human newborn.Journal of. Experimental Child Psychology,13, 339–349. https://doi.org/ 10.1016/0022-0965(72)90095-1
Fuster, J. M. (2005). The cortical substrate of general intelligence.Cortex,41, 228–229. https://doi.org/10.1016/S0010-9452(08)70901-8
Gass, S., Svetics, I., & Lemelin, S. (2003). Differential effects of attention.Language Learning,53, 497–545. https://doi.org/10.1111/1467-9922.00233
Godfroid, A., Ahn, J., Choi, I., Ballard, L., Cui, Y., Johnston, S., et al. (2017). Incidental vocabulary learning in a natural reading context: An eye-tracking study. Bilingualism: Language and Cognition. Published online June 9, 2017. https://doi. org/10.1017/S1366728917000219
Godfroid, A., Boers, F., & Housen, A. (2013). An eye for word: Gauging the role of attention in incidental L2 vocabulary acquisition by means of eye-tracking.Studies in Second Language Acquisition,35, 483–517. https://doi.org/10.1017/
S0272263113000119
Godfroid, A., & Uggen, M. S. (2013). Attention to irregular verbs by beginning learners of German: An eye-movement study.Studies in Second Language Acquisition,35, 291–322. https://doi.org/10.1017/S0272263112000897
Heatley, A., Nation, I. S. P., & Coxhead, A. (2002).Range and frequency programs. Retrieved June 12, 2016, from http://www.victoria.ac.nz/lals/staff/paul-nation.aspx Hern´andez, T. A. (2008). The effect of explicit instruction and input flood on students’
use of discourse markers on a simulated oral proficiency interview.Hispania,91, 665–675.
Hunt, A. R., & Kingstone, A. (2003). Covert and overt voluntary attention: Linked or independent?Cognitive Brain Research,18, 102–105.
Hunter, M. A., & Ames, E. W. (1988). A multifactor model of infant preferences for novel and familiar stimuli. In C. Rovee-Collierand & L. P. Lipsitt (Eds.),Advances in infancy research(Vol.5, pp. 69–95). Stamford, CT: Ablex.
Indrarathne, B., & Kormos, J. (2017). Attentional processing of input in explicit and implicit conditions: An eye-tracking study.Studies in Second Language
Acquisition,39, 401–430. https://doi.org/10.1017/S027226311600019X Issa, B., & Morgan-Short, K. (in press). Effects of internal and external attentional
manipulations on second language grammar development: An eye-tracking study. Studies in Second Language Acquisition.
Izumi, S. (2002). Output, input enhancement, and the noticing hypothesis: An experimental study on ESL relativization.Studies in Second Language Acquisition, 24, 541–577. https://doi.org/10.1017/S0272263102004023
Izumi, S. (2003). Visual input enhancement as focus on form.Sophia Linguistica,13, 1–30.
Jahan, A., & Kormos, J. (2015). The impact of textual enhancement on EFL learners’ grammatical awareness of future plans and intentions.International Journal of Applied Linguistics,25, 46–66. https://doi.org/10.1111/ijal.12049
Juan, C., Shorter-Jacobi, S., Schall, J., & Sperling, G. (2004). Dissociation of spatial attention and saccade preparation.Proceedings of the National Academy of Sciences of the United States of America,101, 15541–15544. https://doi.org/10.1073/pnas. 0403507101
Kahneman, D. (1973).Attention and effort. Englewood Cliffs, NJ: Prentice-Hall. Kintsch, W. (1998).Comprehension: A paradigm for cognition. Cambridge, UK:
Cambridge University Press.
Lee, J. F. (2002). The incidental acquisition of Spanish: Future tense morphology through reading in a second language.Studies in Second Language Acquisition,24, 55–80. https://dx.org/10.1017/S0272263102001031
Lee, S. K., & Huang, H. T. (2008). Visual input enhancement and grammar learning: A meta-analytic review.Studies in Second Language Acquisition,30, 307–331. https://doi.org/10.1017/S0272263108080479
Leow, R. (1997). Attention, awareness and foreign language behavior.Language Learning,47, 467–505. https://doi.org/10.1111/j.1467-1770.2001.tb00016.x Leow, R. (2013). Attention, noticing, and awareness in second language acquisition. In

![Figure 2 Example of the enhanced (left) and unenhanced (right) input slides. [Colorfigure can be viewed at wileyonlinelibrary.com]](https://thumb-us.123doks.com/thumbv2/123dok_us/1981173.159637/17.432.57.367.72.184/figure-example-enhanced-unenhanced-slides-colorgure-viewed-wileyonlinelibrary.webp)