Int. J. Electrochem. Sci., 5 (2010) 116 - 130
International Journal of
ELECTROCHEMICAL
SCIENCE
www.electrochemsci.orgSimultaneous Determination of Ascorbic Acid, Dopamine, and
Uric Acid by Differential Pulse Voltammetry using Tiron
Modified Glassy Carbon Electrode
Ali A. Ensafi*, M. Taei, Taghi Khayamian
Department of Chemistry, Isfahan University of Technology, Isfahan 84156-83111, Iran *
E-mail: [email protected]
Received: 6 December 2009 / Accepted: 11 January 2010 / Published: 31 January 2010
A highly selective voltammetric method was developed for the simultaneous determination of ascorbic acid (AA), dopamine (DA), and uric acid (UA) using Tiron polymer film modified on glassy carbon electrode. The modified electrode separated the anodic oxidation peaks potential of AA, DA and UA with a well-defined peak separation in the present of each other to measure AA, DA and UA individually or simultaneously without any intermolecular effect. The calibration curves were obtained over the range of 4.0-792.0 µmol/L AA, 0.2-45.8 µ mol/L DA, and 0.06-166.0 µmol/L UA. Detection limits of 1.79 µ mol/L AA, 0.07 µ mol/L DA, and 0.021 µ mol/L UA were obtained at pH 3.0. The interference of potential interfering substances on the determination of AA, DA and UA were studied, and the results confirm the selectivity of the method. The modified electrode was used for the determination of AA, DA, and UA simultaneously in real samples such as drugs, urine, and synthesis samples, with satisfactory results.
Keywords: Electrochemical determination; Ascorbic acid; Dopamine; Uric acid; Voltammetry
1. INTRODUCTION
compound. The electrochemical oxidation of DA has been studied to show that it is a two-electron irreversible process with transfer of two protons. Uric acid is the primary end product of purine metabolism. Abnormal levels of UA are symptoms of several diseases such as gout, hyperuricemina, and Lesch-Nyan disease [1]. In general, electroactive UA can irreversibly oxidize in aqueous solutions with the major product being allantion [2,3]. UA and AA are co-present in biological fluids such as blood and urine. It is important to develop a technique to selectively detect UA in the presence of AA conveniently in a routine assay. However, the direct electro-oxidation of UA and AA at bare electrodes requires high overpotentials. The oxidation potential of UA and AA are too close to be separately determined by the use of bare electrodes.
It is known that the oxidation peaks of DA and AA at a bare electrode are at nearly the same potential, which results in overlapped voltammetric responses making their discrimination greatly difficult [4,5]. Literature numbers of studies have reported on new modified electrodes employed for simultaneous determination of DA and AA [5-8]. Moreover, at bare electrodes, DA, AA, and UA are oxidized at nearly the same potential resulting in overlapped voltammetric responses.
To overcome the above problems, modified electrodes are reported to have been developed for the single detection of AA, DA, and UA by modifying bare glassy carbon electrode (GCE), as well as platinum and gold electrode [9-11]. In recent years, substantial efforts have been devoted to the development of electrochemical sensors based on electrodes modified by electro-synthesized polymeric films. Polymeric films of 3-methylthiophene [12], aniline and pyrrole [13] and p -nitrobenzene resorcinol [14] are reported to be useful in the selective detection of DA in excess of AA. Poly(cresol-red) modified electrodes [15] poly(oracet blue) modified electrode [16], poly(eriochrom black T) modified electrode [17], poly(naphthalene sulfunic acid) modified electrode [18], poly(evans blue) modified electrode [19], poly(vinyl alcohol) and poly(chromotrope 2B)-modified electrodes [20] are used to detect DA and/or DA, AA, and UA, simultaneously. Ruthenium oxide-modified electrode could attain the capability for simultaneous determination of AA and DA in the presence of UA [21]. More recently, poly(4-amino-1,1′-azobenzene-3,4′-disulfonic acid)-coated electrode has been reported for the selective detection of DA in the presence of AA, UA and NADH [22] while poly(acrylic acid) multiwall carbon nanotube composite-covered GCE [23], Pt-Au hybrid film-modified electrode [24], pyrolitic graphite electrode modified [25], zinc oxide composite film [26], palladium nanoparticle-loaded carbon nanofibers [27], poly (3-(3-pyridyl) acrylic acid) [28], and 3-(5-chloro-2-hydroxyphenylazo)-4,5-dihydroxynaphthalene-2,7-disulfonic acid [29] have been reported for simultaneous determination of AA, DA, and UA
.
Table 1. Comparison of some characteristics of the different modified electrodes for the determination of AA, DA and UA.
Sensitivity
(µA (µmol L-1)
Limit of detection
(µmol L-1)
Determination range
(µmol L-1)
Interferences Reference
AA DA UA AA DA UA AA DA UA
0.052 - 0.054 0.92 - 1.1 1-400 - 2-400 Not reported [3]
- 0.048 - - 1.2 - - 1.8-460 - Not reported [5]
- 0.34 - - 0.005 - - 0.55-110 - Glucose, Tartaric acid, Citric acid [8]
0.89 0.96 3.11 7.6 1.4 0.6 10-250 2.0-70 2.0-50 Glucose, Lysine, Cysteine [10]
- 1.18 - - 0.02 - - 0.1-100 - Glucose, Cysteine [11]
- 0.087 - - 0.3 - - 5-25 - Not reported [14]
- - - 0.5 1.5 - 50-500 10-100 - Not reported [15]
0.0022 0.147 0.0071 1.3 0.02 0.4 65-2000 0.22-7.0 12.5-400 Not reported [16]
0.017 1.0728 0.091 10 0.02 1.0 150-1000 0.1-200 10-130 Not reported [17]
- 1.0 - - 0.5 - - 2-10 - Not reported [18]
0.18 0.33 0.038 0.3 0.25 2.0 5-105 1-10 30-110 Lysine, Glucose, Cystein [19]
0.0136 0.095 - - 0.3 - 50-400 2-80 - Lysine, Glucose, Cystein [20]
- 0.796 - - 0.1 - - 1-100 - Not reported [23]
- - - - 0.02 0.01 - 0.04-3 0.3-10 Not reported [24]
0.008 0.05 0.016 103 24 21 103-165 24-384 21-336 Not reported [25]
0.012 1.87 1.52 13 0.11 1.4 25-500 1-20 2.5-30 Not reported [26]
- 0.25 - 1.4 0.7 4.5 15-240 6.0-960 50-800 Not reported [27]
- - - 15 0.2 0.7 50-4000 0.5-160 2-200 Not reported [28]
0.11 0.054 0.35 1.43 0.29 0.016 5-240 5-280 0.1-18 Asprin, Tyrosine, Copper(II) [29]
0.16 - - 2.52 - - 5-50 - - Formaldehyde [34]
5.285 - - 0.51 - - 6-800 - - Not reported [35]
- - - - 20 50 - 100-300 60-600 Not reported [36]
- 0.0074 - - 0.1 - - 50-250 - Not reported [37]
0.007 0.33 0.093 1.78 0.075 0.021 4.0-792 0.2-45.8 0.06-166 Not found This work
2. EXPERIMENTAL PART
2.1. Reagents and Apparatus
(Milwaukee, USA). Dopamine and ascorbic acid were obtained from Merck (Merck, Darmstadt, Germany). Phosphate buffer solutions (PBS) with different pH values were prepared by mixing 0.20 mol/L Na2HPO4 and 0.20 mol/L NaH2PO4. pH values were adjusted by addition of 1.0 mol/L H3PO4 and/or NaOH solution.
The stock solutions of dopamine (0.010 mol/L) and ascorbic acid (0.010 mol/L) were prepared daily by dissolving dopamine hydrochloride and ascorbic acid in water. Uric acid solution (0.010 mol/L) was prepared by dissolving the solid in a small volume of 0.1 mol/L NaOH solution and diluted to desired concentration. Other dilute standard solutions were prepared by appropriate dilution of the stock solutions in PBS, pH 3.0.
A Corning pH-meter, Model 140 (Switzerland), with a glass electrode (conjugated with an Ag/AgCl reference electrode, Model 6.0232.100) was used to determine pH levels of the solutions.
Voltamograms were obtained using a Metrohm instrument, Model 797 VA (Switzerland) processor, with three electrodes consisting of a platinum wire as an auxiliary electrode, the poly-Tiron film modified glassy carbon electrode (PTFMGCE) as a working electrode, and with Ag/AgCl as a reference electrode.
2.2. Preparation of poly-Tiron Modified Glassy Carbon Electrode
Prior to each experiment, the glassy carbon electrode (GCE) was polished with 0.05-µm alumina in a water surrey using a polishing cloth. The GCE was subsequently sonicated in a mixture of water/ethanol after each polishing step to be electrochemically pretreated later by cycling at a scan rate of 100 mV/s for 10 cycles in 0.1 mol/L H2SO4 solution (Yao et al. 2007)in the potential range of -0.40 to 1.50 V. Subsequently, the electrode was placed in a solution containing 0.2 mol/L NaOH and 1.0 mmol/L Tiron and cyclic potential sweep was applied in the range of +0.10 and +1.30 at a scan rate of 100 mV/s for 20 times. After the polymerization, the modified electrode was washed with water and scan cycled in pH 3.0 (PBS) between -0.30 and 0.80 for 20 times to increase its reproducibility.
2.3. Procedure
2.4. Real Sample Preparation
Ten tablets of vitamin C (labeled 500 mg vitamin C per tablet, 10 tablets) were completely ground and homogenized, 140 mg of which was accurately weighed and dissolved with ultrasonication in 25 mL of water. Then, 100 µ L of the solution plus 5 mL of the buffer (pH 3.0) was diluted with water in a 10-mL volume flask and the resulting solution was used for analysis. Dopamine hydrochloride injection solution (40 mg mL-1) was analyzed directly after it was diluted 100 timeswith water. 0.10 mL of the diluted solution was injected into a 10-mL volumetric flask and made up to volume with the buffer solution (pH 3.0). The test solution was then transferred into the electrochemical cell and the AA, DA, and UA contents were determined according to the recommended procedure. Urine samples were analyzed directly after dilution for 25 times with the buffer solution (pH 3.0) without any further pretreatment. Then, an aliquot 10 mL of this test solution was transferred into the electrochemical cell and the AA, DA, and UA contents were determined according to the recommended procedure.
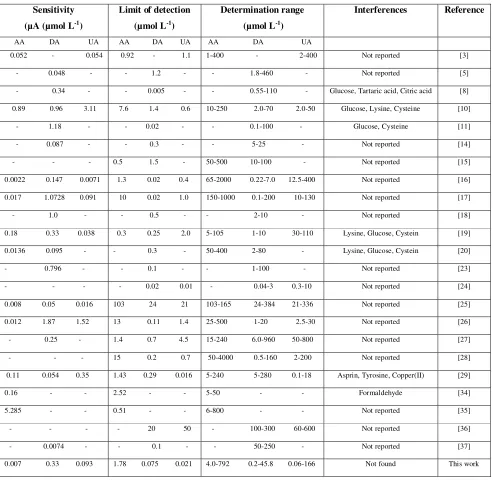
Figure 1. Cyclic voltammetry of electropolymerization of Tiron at 100 mV/s.
3. RESULTS AND DISCUSSION
3.1. Electrochemical Properties Of Poly-Tiron Film Modified GCE
[image:5.612.129.472.320.545.2][image:6.612.80.523.184.482.2]
at a potential of 0.33 V. These anodic and cathodic peak potentials tended to be stable after 20 scans. These suggest that the initially-formed oligomer and/or Tiron film had a leaching process with the scan cycle increasing up to 20 times, which may imply a self-adjustment of the polymer film thickness at the GCE(Yao et al. 2007) During the polymerization of Tiron, Tiron was first deposited at the surface of GCE and oxidized to form quinine, whose structure was subsequently reduced to Tiron at the reverse scan.
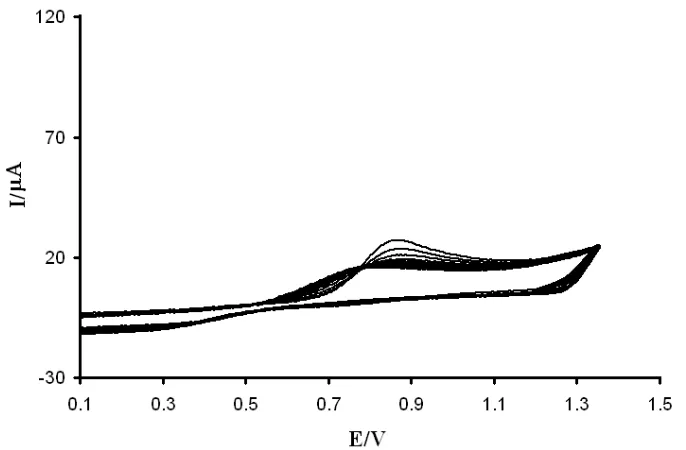
Figure 2. Cyclic voltammograms of poly-Tiron modified GCE in PBS (pH 3.0) at various scan rates; a) 10 mV/s,b) 30 mV/s,c) 50 mV/s,d) 70 mV/s, e) 90 mV/s, f) 110 mV/s, and g) 130 mV/s.
Cyclic voltammograms of PTFMGCE in PBS (pH 3.0) at different scan rates are shown in Fig. 2. Two pairs of reduction and oxidation peak currents obtained in each cycle. The anodic peak current (IPa) was linearly dependent on the scan rate (v) with the regression equation I(µA) = 0.0209 + 12.42v
IP =n2F2AΓν 4RT (1)
where, n represents the number of electrons involved in the reaction (n = 1), A is the surface area of the electrode (0.0314 cm2), IP is the peak current, Γ represents the surface coverage concentration (mol cm-2), and v is the scan rate. From the slope of the anodic peak currents vs. scan rate, the calculated surface concentration of Tiron is 4.2 × 10⁻¹⁰ mol cm-2.
The electrochemical response of PTFMGCE depends on the pH value of the supporting electrolyte solution. By increasing the pH level of the supporting electrolyte (from 2.0 to 8.0), the oxidation peak potentials shifted to negative values linearly. The slope of the linear equation was -54.7 mV pH-1, implying the ratio of the precipitated protons to the transferred through the poly-Tiron film was 1:1.
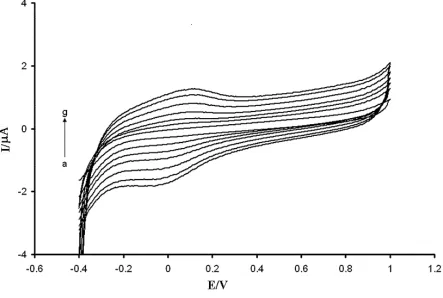
Figure 3. Cyclic voltammograms of 100.0 µmol L UA, 200.0 µmol/LAA and 50.0 µmol/L DA at a) a bare GCE; b) the modified glassy carbon electrode in buffer solution (pH 3.0) with voltage step 5 mV and scan rate of 100 mV/s.
3.2. Electrooxidation of AA, DA and UA at the Surface of Poly-Tiron GCE
[image:7.612.114.517.298.576.2]
sharp peak potentials. On the other hand, the indistinguishable and broad peak potentials at a bare GCE indicate a slow electron transfer kinetic. The oxidation peak potentials of AA, DA, and UA on the modified electrode separated completely into three well-defined peaks with 0.19, 0.41, and 0.59 V vs. Ag/AgCl, respectively. In addition, all the three peak potentials in PTFMGCE had positive potential shifts. These shifts in the oxidation peak potentials and enhanced currents of the oxidation peak potential with PTFMGCE indicate that the modified electrode plays a catalytic effect on the oxidation of AA, DA, and UA, but the catalytic role of PTFMGCE for AA is stronger than DA and UA. Our studied showed that the oxidation peak potentials were 0.41, 0.43, and 0.60 V at pH= 3.0 at the bare GCE for AA, DA, and UA, respectively.
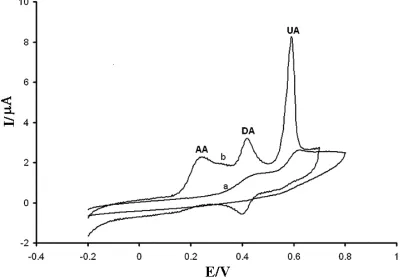
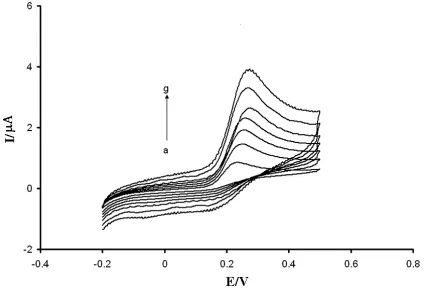
The influence of the scan rate on the anodic peak current of AA was studied by cyclic voltammetry (Fig. 4). The results showed that the peak current increased by increasing the scan rate. The good linear relationship between
ν
1/2 [image:8.612.99.523.296.586.2]and IPa within the scan rate of 10 to 170 mV s-1 confirms a diffusion-controlled process on the modified electrode (r2 = 0.9993).
Figure 4. Cyclic voltammograms of 200.0 µmol/LAA at the polymer modified electrode with various scan rates as: a) 10; b) 30; c) 50; d) 70; e) 90; f) 130; and g) 170 mV/s.
3.3. Experimental Variables
of the pH level of the electrolyte and DPV parameter on peak separation and peak current were studied. The results showed that the peak current of AA decreased from a pH level of 3.0 to higher pH values, whereas for DA and UA it decreased the signal by up to a pH level of 5.0. As is known, the pKa values of R-SO3H (R = aryl group) are usually about 4; therefore, the -SO3Na of poly-Tiron film could dissociate favorably into a negative charge group –SO3– under this condition. The alkaline –NH2 group of DA (pKa = 8.9) could obtain a proton and form of a positive ion of DA. This has a great affinity toward the poly-Tiron film. In addition, for AA, the maximum current obtains at a pH level of 3.0 (pK1 = 4.17) and for UA, the anodic current also reaches its maximum at a pH level of 3.0. Therefore, for simultaneous determination of these compounds a pH value of 3.0 (PBS, 0.05 mol/L) was selected for further study.
The DPV parameters including pulse amplitude, pulse time, and voltage step time changed when the concentration of AA, DA, and UA on the cell were 150, 160, and 20 µmol/L. The results showed that maximum peak current obtained when the pulse amplitude was 50 mV, the pulse time was 0.05 s, and the voltage step time was 0.1 s. These values were selected for further study.
4. SIMULTANEOUS DETERMINATION of AA, DA, and UA
[image:9.612.68.549.523.658.2]As our results showed, the PTFMGCE possessed a higher active surface area and excellent electrocatalytic activity for AA, DA, and UA. The difference in the oxidation peak potentials for AA-DA and AA-DA-UA were 0.21 and 0.18 V respectively, which were large enough separations to allow for the simultaneous determination of AA, DA, and UA in a mixture. The electrooxidation processes of AA, DA, and UA in the mixture evaluated by varying the concentration of the individual analytic species. The analytical parameters for the simultaneous determination of AA, DA, and UA are presented in Table 2.
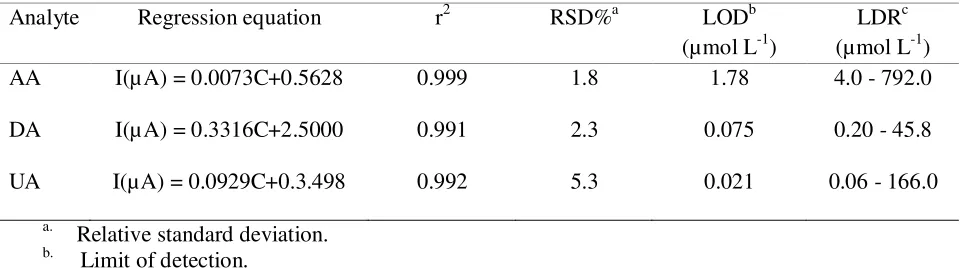
Table 2. Calibration curves parameters for determination of DA, AA and UA.
Analyte Regression equation r2 RSD%a LODb
(µmol L-1)
LDRc (µmol L-1)
AA I(µ A) = 0.0073C+0.5628 0.999 1.8 1.78 4.0 - 792.0
DA I(µ A) = 0.3316C+2.5000 0.991 2.3 0.075 0.20 - 45.8
UA I(µA) = 0.0929C+0.3.498 0.992 5.3 0.021 0.06 - 166.0
a.
Relative standard deviation. b. Limit of detection.
c.
Detection limits of 1.78 µmol L-1 AA, 0.075 µmol L-1 DA, and 0.021 µ mol L-1 UA were obtained at pH 3.0.
(A)
(C)
Figure 5. (A): DPV graphs of a) 196.0; b) 291.0; c) 384.0; d) 470.6; e) 566.0; and f) 655.0 µmol/L AA, in the presence of 10.0 µmol/LDA and 10.0 µmol/L UA. (B): DPV graphs of a) 9.0; b) 11.8; c) 23.5; d) 29.0; e) 40.5; and f) 45.8 µmol/L DA in the presence of 100.0 AA and 20.0 µmol/L UA. (C): DPV graphs of a) 15.0; b) 30.0; c) 45.0; d) 55.0; and e) 85.0 µmol/L UA in the presence of 100.0 AA and 4.0 µmol/L DAin buffer solution (pH 3.0) at the PTFMGCE.
In order to check the intermolecular effects between AA, DA, and UA, three different experiments were carried out under optimum conditions at a pH 3.0. In each experiment, the concentration of one of the three compounds was changed while keeping the concentrations of the other two constant. The results are shown in Figs. 5A, 5B and 5C. The peak currents for AA, DA, and UA increase linearly with increases in their respective concentrations without remarkably affecting the other peak currents. They also indicate that the peak current of AA increased linearity with a correlation coefficient of 0.999 while AA concentration increased (Fig. 5A). In addition, different concentrations of DA in the presence of 100.0 µ mol/L AA and 20.0 µmol/L UA exhibit excellent DPV responses to AA, DA, and UA without any obvious intermolecular effects among them, with a correlation coefficient of 0.991 when DA concentration increased (Fig. 5B).
[image:11.612.144.480.76.339.2]
5. INTERFERENCE STUDY
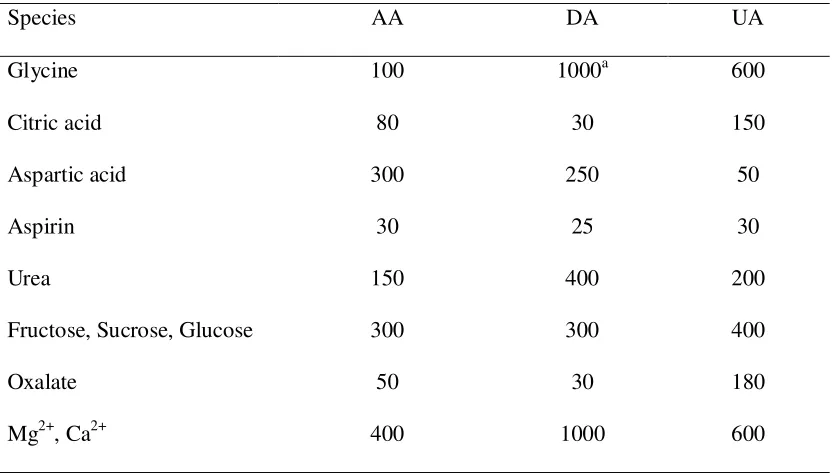
[image:12.612.99.515.238.475.2]The influence of potential interfering substances on the determination of these compounds were investigated. The tolerance limit was defined as the maximum concentration of foreign substances, with a relative error of less than 5%. Interference studies were conducted by exposing the PTFMGCE in a solution containing 100.0 µ mol/L AA, 20.0 µmol/L DA and 50.0 µmol/L UA plus the interfering substance at a pH 3.0. The DPV responses resulting from the presence of interfering substances were obtained for AA and DA plus UA. The results are presented in Table 3.
Table 3. Interference of some foreign substances for 20.0 µmol/L DA, 100.0 µmol L-1 AA, and 50.0 µmol L-1 UA.
Species AA DA UA
Glycine 100 1000a 600
Citric acid 80 30 150
Aspartic acid 300 250 50
Aspirin 30 25 30
Urea 150 400 200
Fructose, Sucrose, Glucose 300 300 400
Oxalate 50 30 180
Mg2+, Ca2+ 400 1000 600
a. Maximum concentration of the substances used.
6. REAL AND SYNTHESIS SAMPLES ANALYSIS
Table 4.Simultaneous determination of DA, AA and UA in mixtures synthesis samplesa.
Sample Added (µmol L-1) Found (µmol L-1) Recovery (%) AA DA UA AA DA UA AA DA UA 1
2 3
200.0 10.0 30.0 600.0 30.0 60.0 400.0 20.0 100.0
201.4(±4.0) 9.7(±0.6) 31.7(±2.3) 568.0(±6.0) 29.5(±2.0) 61.1(±5.6) 398.0(±4.1) 21.0(±0.7) 94.8(±8.0)
100.9 97.1 105.6 94.7 98.3 101.8 99.5 105.1 94.8 a
. Number in the parenthesis show the standard deviation for n = 3.
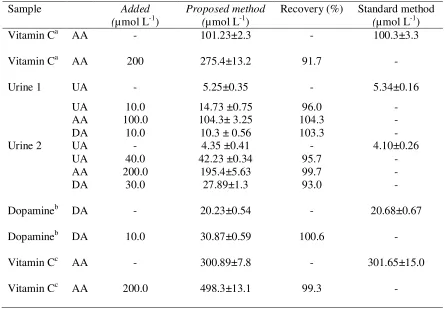
Table 5. Determination DA, AA and UA in real samples.
Sample Added
(µmol L-1)
Proposed method (µmol L-1)
Recovery (%) Standard method
(µmol L-1)
Vitamin Ca AA - 101.23±2.3 - 100.3±3.3
Vitamin Ca AA 200 275.4±13.2 91.7 -
Urine 1 UA - 5.25±0.35 - 5.34±0.16
UA AA DA 10.0 100.0 10.0 14.73 ±0.75 104.3± 3.25 10.3 ± 0.56
96.0 104.3 103.3 - - -
Urine 2 UA - 4.35 ±0.41 - 4.10±0.26
UA AA DA 40.0 200.0 30.0 42.23 ±0.34 195.4±5.63 27.89±1.3 95.7 99.7 93.0 - - -
Dopamineb DA - 20.23±0.54 - 20.68±0.67
Dopamineb DA 10.0 30.87±0.59 100.6 -
Vitamin Cc AA - 300.89±7.8 - 301.65±15.0
Vitamin Cc AA 200.0 498.3±13.1 99.3 -
a.
Vitamin C: Swiss Natural Sources (500 mg). b.
Dopamine ampoule, 200 mg/5mL, Caspian Tamin Pharmaceutical Co., Rasht, Iran. c.
Vitamin C ampoule, 500mg/5mL, Darou Pakhsh Co., Iran.
7. CONCLUSION
[image:13.612.83.528.274.583.2]
electrochemical catalytic oxidation of AA, DA, and UA, but also resolved the overlapping anodic peaks. The results in Table 1 confirmed that although the proposed method has a lower sensitivity for AA than the other electrochemical methods, its sensitivity and detection limit are better for DA and UA analysis. Moreover, the proposed method was successfully applied for the determination of these compounds in real samples.
ACKNOWLEDGEMENTS
The authors gratefully acknowledge support of this work by the Research Council of Isfahan University of Technology (IUT) and Center of Excellence in Sensor.
References
1. V. S. E. Dutt, H. A. Mottola, Anal. Chem. 46 (1974) 1777. 2. J. M. Zen, J. S. Tang, Anal. Chem. 67 (1995) 1892. 3. L. Zhang, X. Lin, Analyst 126 (2001) 367.
4. H. Zaho, Y. Zhang, Z. Yuan, Analyst 126 (2001) 358. 5. L. Zhang, X. Lin, Anal. Bioanal. Chem. 382 (2005) 1669.
6. J. Wang, V. A. Pamidi, G. Cepria, S. Basak, K. Rajeshwar, Analyst 122 (1997) 981. 7. J. Wang, P. Tuzhi, T. Golden, Anal. Chim. Acta 194 (1987) 129.
8. H. Zaho, Y. Zhang, Z. Yuan, Anal. Chim. Acta 441 (2001) 117. 9. A. Cizewski, G. Milzarek, Anal. Chem. 71 (1999) 1055. 10.Y. Li, X. Lin, Sens. Actuators B 115 (2006) 134.
11.G. Y. Jin, Y. Z. Zahang, W. X. Cheng, Sens. Actuators B 107 (2005) 528. 12.H. T. Xu, F. Kitamura, T. Ohsaka, K. Tokuda, Anal. Sci. 10 (1994) 399. 13.G. Erdogdu, H. B. Mark Jr., E. Karagozler, Anal. Lett. 29 (1996) 221. 14.X. Lin, Y. Zhang, W. Chen, P. Wu, Sens. Actuators B 122 (2007) 309.
15.W. Chen, X. H. Lin, L. Y. Huang, H. B. Luo, Microchim. Acta 151 (2005) 101.
16.H. R. Zare, N. Rajabzadeh, N. Nasirizadeh, M. Mazloum Ardakani, J. Electroanal. Chem. 589 (2006) 60.
17.H. Yao, Y. Sun, X. Lin, Y. Tang, L. Huang, Electrochim. Acta 52 (2007) 6165. 18.A. Balamurugan, S.M. Chen, Anal. Chim. Acta 596 (2007) 92.
19.L. Lin, J. Chen, H. Yao, Y. Chen, Y. Zheng, X. Lin, Bioelectrochemistry 73 (2008) 11. 20.X. Lin, Q. Zahuang, J. Chen, S. Zhang, Y. Zheng, Sens. Actuators B 125 (2007) 240. 21.P. Shakkthivel, S. M. Chen, Biosens. Bioelectron. 22 (2007) 1680.
22.S. A. Kumar, C. F. Tang, C. M. Chen, Talanta 74 (2008) 860. 23.A. Liu, I. Honma, H. Zhou, Biosens. Bioelectron. 23 (2007) 74. 24.S. Thiagarajan, S. M. Chen, Talanta 74 (2007) 212.
25.R. P. da Silva, A. W. O. Lima, S. H. P. Serano, Anal. Chim. Acta 612 (2008) 89. 26.C. F. Tang, S. A. Kumar, S. M. Chen, Anal. Biochem. 380 (2008) 174.
27.J. Huang, Y. Liu, H. Hou, T. You, Biosens. Bioelectron. 24 (2008) 632. 28.Y. Zhang, S. Su, Y. Pan, L. Zhang, Y. Cai, Annali di Chimica, 97 (2007) 665. 29.A. A. Ensafi, M. Taei, T. Khayamian, J. Electroanal. Chem. 633 (20090 212. 30.A. Eriksson, L. Nyholm, Electrochim. Acta 46 (2001) 1113.
33. L. Eb, W. Hq, A Service of the U.S. National Library of Medicineand the National Institutes of
Health 25 (2005) 1213.
34.H. Razmi, M. Harasi, Int. J. Electrochem. Sci. 3 (2008) 82.
35.S. Yilmaz, M. Sadikoglu, G. Saglikoglu, S. Yagmur, G. Askin, Int. J. Electrochem. Sci. 3 (2008) 1534.
36.S. S. Shankar, B. E. K. Swamy, U. Chandra, J. G. Manjunatha, B. S. Sherigara, Int. J. Electrochem. Sci. 4 (2009) 592.
37.M. Pandurangachar, B. E. K. Swamy, U. Chandra, O. Gilbert, B.S. Sherigara, Int. J. Electrochem. Sci. 4 (2009) 672.