Int. J. Electrochem. Sci., 5 (2010) 267 - 277
International Journal of
ELECTROCHEMICAL
SCIENCE
www.electrochemsci.orgLumped Model for Proton Exchange Membrane Fuel Cell
(PEMFC)
M. ELSayed Youssef 1,*, Khairia E.AL-NAdi2, Moataz H.Khalil1 1
Computer Based Engineering Applications Department, IRI, Mubarak city, Egypt 2
Mathematical Department, Faculty of Science, Alexandria University, Egypt. *
E-mail: [email protected]
Received: 10 August 2009 / Accepted: 25 February 2010 / Published: 1 February 2010
This work aimed to develop lumped model for proton exchange membrane fuel cells (PEMFCs). The developed lumped model has been validated with published experimental results. The model has been developed depend on linear algebra equations. This model is used to study the effects of several operating and design parameters on fuel cell performance. The parameters have been studied their effects on cell. These parameters are input temperature, pressure, stoichiometric ratio, membrane thickness and gas diffusion layer thickness. The lumped model has been programmed using software MATLAB.
Keywords: PEM fuel cell, PEM modeling, lumped model, parametric study.
1. INTRODUCTION
A fuel cell is a device that can directly transfer chemical energy to electric and thermal energy. There are different types of fuel cells. Among this different fuel cell types a proton exchange membrane fuel cell (PEMFC) [1-4] has been selected. Proton exchange membrane fuel cell can be operated at low temperature (about 80 °K) with high power density product and at same time without impact environment. Proton exchange membrane has high startup system and shadow system performance [5].
These advantages have been attended amount of research in last years, especially in stationary and mobile power generators and electric vehicles [5].
mathematical is principle device in this work. Where, the mathematical model is important tool in simulation and modeling [1]. The development of physical models allows dependable simulation process under practical conditions parameters, where it is necessary in fuel cell development and optimization [2].
This study presents lumped model for proton exchange member fuel cell. Proton exchange membrane fuel cell (PEMFC) systems consist from thermodynamics, electrochemistry, hydrodynamics and mass transfer theory. So, it is very difficult to deign completed mathematical model. The lumped model allow to study fuel cell model by know the input and output of fuel cell. The linear algebraic equations have been used on lumped model. Parametric study for this lumped model has been developed. The parametric study on fuel cell performance has been discussed.
2. MODEL DESCRIPTION
Lumped model has been developed in this study. Lumped model is model with zero dimensions. The model was developed with some assumptions such as, the transport process is steady-state which resolves coupled transport in membrane, all gases obey the ideal gas low, the gas flow channels is laminar ,the catalysts is very thin ,the change phase of water was neglected ,the heat transport cross solid medium as gas medium, the output temperature is cell temperature. The developed model has five major sections. Theses included mass transport, heat transport, electrical characterization, water management and losses product.
2.1. Computational domain
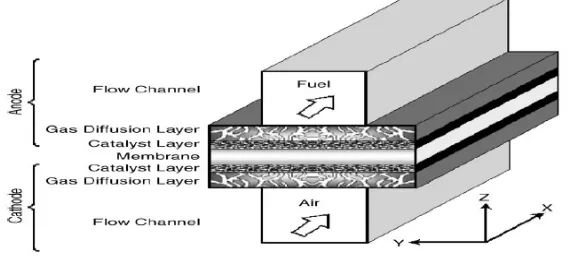
A computational model of an entire cell would needed very huge computing memory and very long simulation time. The complete computational domain contains cathode, anode, gas diffusion layer channels and membrane electrode. A schematic diagram of a PEM fuel cell with the reactant and product gases and ion conduction flow is shown in Fig. 1.
[image:2.612.169.454.552.682.2]
2.2. Model equations
The developed model has been controlled by set of equations. They are mass conversation equation, energy balance equation, power cell and cell potential.
2.3. Mass conversation equation
[image:3.612.189.423.252.343.2]First, the mass balance of cell should be estimated. Because the flow calculations are important for determining the correct fuel rate of cell [6]. The mass conservation calculations are all depended on current flow [7]. Fig. 2 depicts the mass flow rate of input and output of fuel cell.
Figure 2. Conservation of mass diagram illustrating two bi-polar plates, MEA, and the product flows between them.
Mass flow rate of hydrogen at anode can be calculated as following:
F M I S
mH H H
× × × =
•
2
2 2
2 (1)
Where mH2
•
is the mass flow of hydrogen from anode,
2 H
S is the stoichiometric flow ratio of hydrogen, Iis the current flow,
2 H
M is the molecular weight and Fis the faraday’s constant (96487 mol Coulomb
). While the mass flow rate of oxygen from cathode can calculate as following:
F M I S
mO O O
× × × =
•
4
2 2
2 (2)
By using conservation mass low, the amount of water generation can be calculated by
F M I F M I
mH gen H O
× × + × × =
•
4 2
2 2
2, (3)
out O H v O H l O
H m m
m ) ( ) ( )
( 2 2 2
• •
•
=
+ (4)
Where (mH2O)l •
is the mass flow rate of water at liquid state (mH2O)v •
is the mass flow rate of water at vapor state. The mass flow rate of vapor water can be calculated as following:
+ = • • • 2 2 2 2 2 2 2 ) ( ) ( ) ( ) ( N sys N O out o cathode V O H O H v O H M m M m P P M
m (5)
Where MHO
2 ,MO2,MN2 are the molecular weight of water, oxygen ,nitrogen ,PH2O(V) is the partial
pressure of water,Pcathode is the pressure of cathode,(mO2)out
•
is the mass flow rate of oxygen output from cell and (mN )sys
2
•
is the mass flow rate of nitrogen .
2.4. Energy balance equation
The energy balance on fuel cell is the total amount of energy input to cell equals the total amount of energy product from cell [6].
The general energy balance equation can be formulated as following:
∑
∑
(hi)in =Wel + (hi)out+Q (6)Where
∑
( )
hi inis the total input enthalpy to cell,∑
( )
hi outis the total output enthalpy from cell, Welis electrical power and Q is the heat leaving cell by convection, radiation or coolant. The electrical power can be expressed as following:V I
Wel = × (7)
2.5. Cell power
The fuel is providing cell by power as fuel power, which can be formulated as following:
LHV m
Pfuel = H × •
2 (8)
Where Pfuel is the fuel power and LHV is the low heating value.
The power provided by fuel in reacted hydrogen is converted into two types; electricity and heat. Therefore,
heat W
2.6. Cell potential
The Nernst equation allows one to determine the voltage of an electrochemical Cell (∆E). It is derivation from thermodynamic principles. Nernst equation is shown as general formal as following [8].
[ ] [ ]
[
]
× × × × − = O H O H P P P lin F N T R E E 2 2 2 2 1o (11)
Where R is the universal gas constant, T is the absolute temperature, n is the charge number of the electrode reaction and PH2,PO2,PH2Oare the partial pressure of hydrogen, oxygen and water respectively. While Eo is standard electrode Potential, The standard electrode potential is actual cell potentials different under standard condition, the standard condition which mean here, there temperature at 298 °K and pressure about 1.0 bar. It calculated as shown by Maher [2].
)) ( 5 . 0 ) ( ( 10 3085 . 4 ) 15 . 298 ( 10 83 . 0 229 . 1 2 2 5 3 O H linP
P lin T T
Eo = − × − × − + × − × × + × (11)
Once of important output a source is the electrical energy. The actual cell potentialVact is lower than the stranded cell potential Eo because cell losses. Fuel cell has three types of losses are activation loss, concentration loss and ohmic loss, which can be calculated as following:
ohmic con activation
act E V V V
V = o− − − (12)
The activation losses can estimate from the following:
× × × × + × × × × = c c a a activation i i F T R i i F T R V ln 4 ln
2 α α (13)
Where i current density and αis transfer coefficient. The ohmic losses can be formulated as following:
r I
Vohmic= × (14)
Where r is the resistance. It can be computed from the following equation:
c e c m m m A l A l r × + × = λ
λ (15)
Where lc,lm are the gas diffusion layer thickness, is the wet membrane thick-ness,
λ
m,λ
e is the membrane ionic conductivity ,the electrode ionic conductivity, Am,Acare the cross sections of membrane and cross section of electrode.
) ln 2 1 (ln
2
2
× + × ×
× =
c O
a H cocn
P P P
P F
T R
V h (16)
By solving equations (11), (13), (14), (16) in equation (12) can get the actual volt of cell.
3. SOLUTION ALGORITHM
[image:6.612.121.489.333.516.2]The previous equations have been solved by using MATLAB software. The values of molecular weight and range of current density and stoichiometric are used as input parameters. The mass conversation has been solved. The mass flow rate of input/output was produced. By Compensation on heat balance equation and with merged the fuel power and electrical power the input/output heat was produced and the output temperature of gas can be calculated. Then losses of cell can be calculated with standard electrode potentials calculations. The actual cell voltage can be estimated and cell power too.
Figure 3. Comparison between experimental data and model data
4. RESULTS AND DISCUSSION
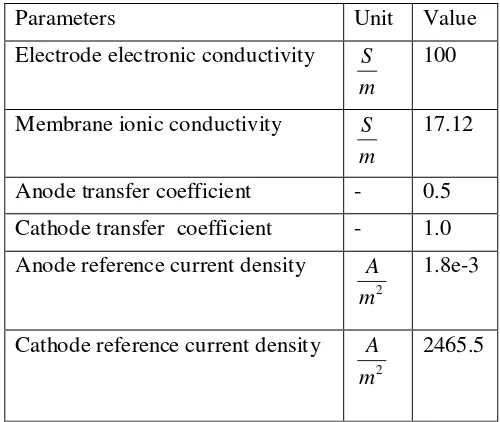
The values of geometric details of cell are listed in Table 1. Table 2 shows theelectrochemical transport parameters values for base case operating condition as given by Maher A.R [2].The results for base case operating conditions were verified with experimental results provided by Wang et al. [9].
However, the lumped model has been deviated form experimental result when current densities in the mass transport limited region (>1.25 A/cm2) or higher . This divergence is a common characteristic of single-phase models where the effect of reduced oxygen transports due to water flooding at the cathode at high current density cannot be accounted for [10]. In addition to this flooding effect, anode drying can also be a contributing factor to the reduced performance at high current density [11].
[image:7.612.121.496.280.469.2]On another hand, for simplification local current density has been used instead of a limiting current density .the lumped model has been more validated form region (current density = 1000 A.m-2 to 13000 A.m-2). Fig. 4 shows the power curve of model with current density. It was noted that with increasing current density the power was increasing .So, the high power value would be in high current density value.
Table 1. Geometrical and operational parameters for base case conditions
Parameters Unit Value
Channel length m 0.05
Channel weight m 1e-3
Channel height m 1e-3
Gas diffusion layer thickness m 0.26e-3
Membrane thickness m 0.23e-3
Hydrogen reference mole fraction - 0.84639
oxygen reference mole fraction - 0.17774
Intel pressure atm 3
Intel temperature K 353.15
Humidity % 100
Air stoichiometric flow ratio - 2
Fuel stoichiometric flow ratio - 2
Table 2. Electrode and membrane parameters for base case operating conditions
Parameters Unit Value
Electrode electronic conductivity m
S 100
Membrane ionic conductivity
m
S 17.12
Anode transfer coefficient - 0.5 Cathode transfer coefficient - 1.0 Anode reference current density
2
m
A 1.8e-3
Cathode reference current density
2
m
[image:7.612.180.430.514.725.2]
4.1. Temperature effect on PEMFC Performance
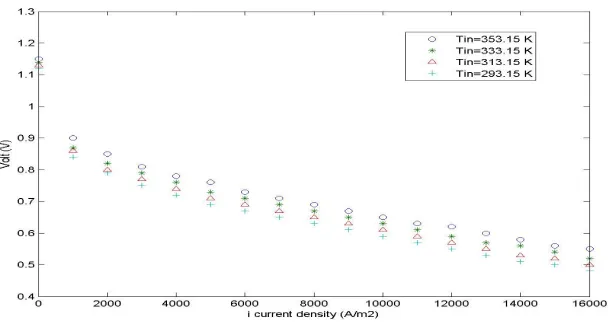
[image:8.612.143.446.180.356.2]The temperature has basic effect in the different transport phenomena inside the fuel cell, and open circuit voltage. The composition of the incoming gas streams depends strongly on the temperature. Fig 6 shows I-V curve at different temperature values 353.15°K, 353.15 °K, 333.15 °K, 313.15 °K and 293.15 °K.
Figure 4. Power density of PEMFC Versus cell current density
It was found that at temperature increasing the cell voltage increasing due to losses voltage decreasing. The activation loss decreases with increasing temperature. This is due to the exchange current density of the oxygen reduction reaction increases rapidly with temperature due to the enhanced reaction kinetics, which reduces activation losses. At the same time, the open circuit voltage (E) is function on temperature and pressure .So, when temperature increasing the open circuit voltage increasing. It was observed that at temperature increasing by 20 ° K the voltage increasing by about 0.2V.
[image:8.612.155.459.531.694.2]
4.2. Pressure effect on PEMFC Performance
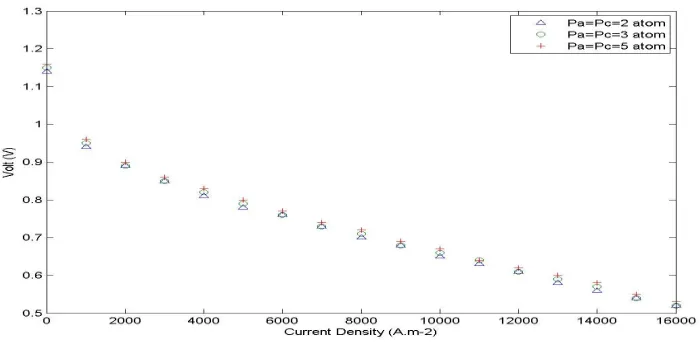
Pressure is one of effective basic operating parameter similar to the temperature. The operating pressure has an effect on many transport parameters that are important for the fuel cell operation. The saturation pressure of water vapor depends only on the temperature and it remains constant for a variation of the inlet pressure. The open circuit volt is function on input temperature and input pressure. From equation described in previous section, it was found that the change in pressure effects in open circuit volt ,but the variation would be have small effect because the pressure factor multiple in very small number. The pressure has major effect on amount of water vapor water product from cathode and amount of vapor water enter with hydrogen at anode side. Pressure would be increasing leads to mass flow rate increasing in due to increasing in output heat. Fig.6 shows I-V curve for different pressure values 2, 3, 5 bar variation at cell polarization curve. It was noted that the activation losses decreases when pressure increasing, due to increasing the cell voltage with pressure increasing. On another hand, unlimited pressure increasing could not achieve higher voltage. Because, with increasing pressure the cell voltage increasing very small value. Furthermore, the cost used for increasing pressure doesn’t produce higher voltage as expected. And, the cell could be damaged in case pressure more than 12 bars.
4.3. Effect of membrane thickness on PEMFC Performance
[image:9.612.132.482.472.644.2]The effect of membrane thickness has been studied on the fuel cell Performance. From relation between the membrane thickness and cell resistance, it was observed that the major effect of thickness variation would be appeared at ohmic losses. The ohmic loss is function on membrane thickness, current density, cross section area, electronic conductivity and ionic conductivity.
Figure 6. PEMFC performance at different fuel cell pressure
[image:10.612.143.470.136.308.2]
decreasing the cell output voltage. It was found that the effect of membrane thickness on polarization curve has been cleared starting from the ohmic losses region to end of polarization curve.
Figure 7. PEMFC performance at different fuel cell membrane thickness
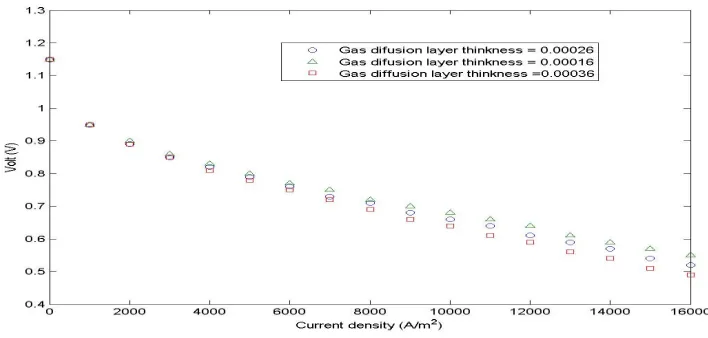
Figure 8. PEMFC Performance at different GDL
4.4. Effect of gas diffusion thickness (GDL) on PEMFC Performance
[image:10.612.128.482.371.540.2]
lead to cell voltage drop. And, it was found that the divergence has been cleared at ohmic losses region on polarization as is shown in the figure. There another loss has been affected by variation gas diffusion layer. It is concentration losses, because concentration losses are losses of proton transport which depends on gas diffusion layer.
5. CONCLUSIONS
Lumped model for proton exchange membrane fuel cell has been developed. The lumped model has been validated by published experimental results. Good agreement has been obtained between lumped model and experimental data. It has been observed that there is small deviation at higher current density .This deviation is common in all polarization curve at 1.25 A/cm2 or higher .Because the oxygen transport reduced due to the water flooding at cathode at high current density cannot be accounted-for. Beside that, anode drying can also be a contributed factor to the reduce performance at higher current density. Parametric and optimization study using this model has been performed. The study quantifies the impact of operating and design parameters on fuel cell performance. It was observed that, (1) the voltage of fuel cell has been increased with increasing the input temperature of fuel cell. (2) Increasing pressure of gases leads to increase of the voltage and power of cell. (3) At increasing membrane thickness or gas diffusion layer, the voltage of cell and its power were decreasing.
References
1. Shaoduan Ou, Luke E.K. Achenie, Journal of Power Sources, 140 (2005) 31.
2. Maher A.R.Sadiq Al-Baghdadi,Haroun A.K. Shahad Al-Janabi, Renewable energy, 32 (2007) 1077.
3. J. Arun kumar, P. Kalyaniand R. Saravanan, Int. J. Electrochem. Sci., 3 (2008) 961. 4. Balaji Krishnamurthy and S. Deepalochani, Int. J. Electrochem. Sci., 4 (2009) 386.
5. Laurencelle F, Chahine R, Hamelin J, Agbossou K, Fournier M, Bose TK, et al. Fuel Cells J, 1 (2001) 66.
6. Collen Spiegel,”PEM Fuel Cell Modeling and Simulation Using Matlab” ElSEVIER, 2008. 7. Bryan W.Shevock,”Sytstem level modeling of theremal transients in PEMFC systems”, 2008. 8. EG&G Services Parsons,” Fuel Cell Handbook”, 2000, fifth edition.
9. Wang L, Husar A, Zhou T, Liu H.,Int J Hydrogen Energy,28(11) (2003)1263.
10.WANG Rui-min, CAO Guang-yi, ZHU Xin-jian, Journal of Zhejiang University SCIENCE A
,2006, 5,741-747.
11.Phong Thanh Nguyen, Torsten Berning, Ned Djilali, Journal of Power Sources, 130(2004) 149.