City, University of London Institutional Repository
Citation
:
Guo, Shijing (2016). Systemic analysis and modelling of diagnostic errors in medicine. (Unpublished Doctoral thesis, City University London)This is the accepted version of the paper.
This version of the publication may differ from the final published
version.
Permanent repository link:
http://openaccess.city.ac.uk/15125/Link to published version
:
Copyright and reuse:
City Research Online aims to make research
outputs of City, University of London available to a wider audience.
Copyright and Moral Rights remain with the author(s) and/or copyright
holders. URLs from City Research Online may be freely distributed and
linked to.
City Research Online: http://openaccess.city.ac.uk/ [email protected]
Systemic Analysis and
Modelling of Diagnostic
Errors in Medicine
by
Shijing Guo
A thesis submitted for the degree of Doctor of Philosophy
Centre for Health Informatics
School
of Mathematics, Computer Science & Engineering
City
University London
2
Acknowledgments
I would like to express my greatest appreciation to my supervisor Prof. Abdul Roudsari. I am always motivated by his full support and his knowledge of the field during the whole period of my doctoral studies. My thesis work would not have been accomplished without his encouragement, aspiring advice and expert guidance. Also, I would like to express my special gratitude to Dr. Artur d'Avila Garcez. He is always patient, and his encouragement and advice are valued greatly.
I would like to extend my appreciation to all the people from Health Informatics centre and Computer Science department for insightful advice and help. Thanks also go to Dr. Xiang Li for sharing his knowledge in data analysis.
I also wish to thank all clinicians who participated the studies in this thesis. Their feedback is valuable.
3
ABSTRACT
Diagnostic accuracy is an important index of the quality of health care service. Missed, wrong or delayed diagnosis has a direct effect on patient safety. Diagnostic errors have been discussed at length; however it still lacks a systemic research approach.
This thesis takes the diagnostic process as a system and develops a systemic model of diagnostic errors by implementing system dynamics modelling combined with regression analysis. It aims to propose a better way of studying diagnostic errors as well as a deeper understanding of how factors affect the number of possible errors at each step of the diagnostic process and how factors contribute to patient outcomes in the end.
It is executed following two parts:
In the first part, a qualitative model is developed to demonstrate how errors can happen during the diagnostic process; in other words, the model illustrates the connections among key factors and dependent variables. It starts from discovering key factors of diagnostic errors, producing a hierarchical list of factors, and then illustrates interrelation loops that show how relevant factors are linked with errors. The qualitative model is based on the findings of a systematic literature review and further refined by experts’ reviews.
In the second part, a quantitative model is developed to provide system behaviour
simulations, which demonstrates the quantitative relations among factors and errors during the diagnostic process. Regression modelling analysis is used to estimate the quantitative relationships among multi factors and their dependent variables during the diagnostic phase
of history taking and physical examinations. The regression models are further applied into
quantitative system dynamics modelling ‘stock and flow diagrams’. The quantitative model traces error flows during the diagnostic process, and simulates how the change of one or more variables affects the diagnostic errors and patient outcomes over time. The change of the variables may reflect a change in demand from policy or a proposed external
intervention.
4
Contents
ABSTRACT ... 3
LIST OF FIGURES ... 8
LIST OF TABLES ... 10
Chapter 1 Introduction ... 12
1.1 Background and motivation ... 12
1.2 Aims ... 13
1.3 Objectives ... 14
1.4 Organisation of the thesis ... 15
Chapter 2 Preliminary Literature Review ... 17
2.1 Introduction ... 17
2.2 Medical errors and diagnostic errors ... 17
2.3 Diagnostic error characteristics ... 18
2.4 Summary ... 21
Chapter 3 Methods ... 23
3.1 Introduction ... 23
3.2 System modelling ... 23
3.3 Comparing models of errors in healthcare ... 24
3.4 System dynamics modelling ... 26
3.4.1 Introduction of system dynamics modelling and its applications ... 26
3.4.2 Two phases of system dynamics ... 28
3.4.3 Its application hypothesis ... 30
3.4.4 Why use system dynamics modelling ... 31
3.5 Regression analysis ... 33
3.5.1 Introduction of regression analysis and its applications ... 33
3.5.2 Its application hypothesis ... 34
3.5.3 Why use regression analysis? ... 35
3.6 Software ... 35
3.7 Data collection methods ... 35
3.8 Summary of methods used in the thesis ... 36
3.9 Conclusion ... 40
Chapter 4 A Systematic Review of Literature ... 41
4.1 Introduction ... 41
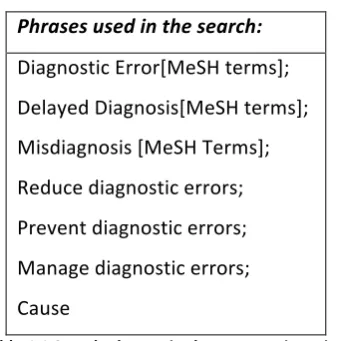
4.2 Searching method ... 41
4.2.1 Searching questions ... 41
5
4.2.3 Literature selection criteria ... 42
4.2.4 Process of retrieving articles ... 42
4.3 Findings ... 43
4.3.1 Factors of diagnostic errors ... 44
4.3.2 Methods for diagnostic error reduction ... 50
4.4 Summary ... 55
Chapter 5 Qualitative System Dynamics Modelling ... 57
5.1 Introduction ... 57
5.2 Introducing the qualitative model ... 57
5.3 The purpose and the boundary of the qualitative model ... 58
5.4 Developing the initial qualitative model based on systematic review ... 58
5.5 Amending the initial qualitative model ... 59
5.5.1 The process of discussions with experts ... 59
5.5.2 Feedback from experts ... 60
5.5.3 Final causal loop diagram for diagnostic errors ... 60
5.6 Discussion of how to map possible strategies into the qualitative model ... 64
5.7 Summary ... 65
Chapter 6 Quantitative System Dynamics Model Development ... 67
6.1 Introduction ... 67
6.2 How quantitative system dynamics works in terms of diagnostic errors ... 67
6.3 Steps ... 69
6.4 Develop the structure of the quantitative model ... 70
6.4.1 Model frame ... 70
6.4.2 How diagnostic reasoning works ... 72
6.4.3 Diagnostic sensitivity ... 72
6.5 Model for Phase1 history taking and physical examination ... 75
6.6 Model for Phase2 tests ... 77
6.7 Model for Phase3 referrals ... 79
6.8 Model for error effects ... 79
6.9 Quantitative model structure of diagnostic errors in the diagnostic process ... 81
6.10 Summary ... 84
Chapter 7 Regression Modelling ... 85
7.1 Introduction ... 85
7.2 Steps of regression modelling ... 85
7.3 Methods used to quantify non-numerical variables ... 85
7.3.1 Likert scaling of non-numerical variables ... 86
7.3.2 Data representation of categories ... 87
6
7.3.4 Computing the non-numerical variables ... 90
7.3.5 Further discussion ... 92
7.4 Data for regression modelling ... 93
7.4.1 Data acquisition ... 93
7.4.2 Data preparation ... 95
7.5 Methods used to build relationship functions ... 97
7.6 Variable correlation analysis ... 98
7.7 Univariate regression analysis ... 103
7.7.1 Relationship between v1 and v2 ... 104
7.7.2 Relationship between v1 and v3 ... 108
7.7.3 Relationship between v1 and v4 ... 111
7.7.4 Relationship between y1 and y2 ... 113
7.8 Multiple regression analysis of the relationship between y1 and v2,v3,v4 ... 116
7.8.1 Bivariate scatterplot ... 117
7.8.2 Multiple linear regression results ... 118
7.9 Principal components analysis ... 120
7.9.1 PCA introduction ... 120
7.9.2 PCA process ... 122
7.9.3 Component rotation: ... 124
7.9.4 Regression model after PCA ... 129
7.10 Discussion ... 130
7.11 Summary ... 131
Chapter 8 Model Simulation ... 132
8.1 Introduction ... 132
8.2 Data for model simulation ... 132
8.2.1 Public data ... 132
8.2.2 Estimated data from experts or “expert elicitation” ... 135
8.3 Model simulation results ... 141
8.3.1 Model summary of equations and data: ... 142
8.3.2 Scenario 1: one year overview ... 146
8.3.3 Scenario 2: changing one factor ... 150
8.3.4 Scenario 3: changing two factors at the same time ... 156
8.4 Discussion and summary ... 158
Chapter 9 Model Evaluation ... 160
9.1 Introduction ... 160
9.2 Evaluation for regression models and system dynamics models ... 160
9.3 Introduction to evaluation approaches for system dynamics models ... 161
9.4 Evaluation assessments for system dynamics modelling ... 162
9.5 Discussion and Summary ... 166
7
Chapter 11 Conclusion ... 170
11.1 A discussion of the extent to which each of the objectives has been achieved ... 170
11.2 Contributions to knowledge ... 171
11.3 Recommendations for future research ... 173
APPENDIX I Initial quantitative model based on the systematic review ... 174
APPENDIX II Discussions with experts ... 176
APPENDIX III Causes trees of diagnostic errors ... 177
APPENDIX V Loops of diagnostic errors in the qualitative model ... 178
APPENDIX VI Questionnaires for regression modelling data ... 181
a. English translated document: ... 181
b. Original document: ... 184
APPENDIX VII Interview Documents ... 186
a. Introduction information ... 186
b. Semi-structured questions ... 187
APPENDIX VIII Variable Equation List ... 191
8
LIST OF FIGURES
Figure 2.1 Where and what errors may occur20 ... 20
Figure 2.2 Swiss cheese model31 ... 21
Figure 3.1 A causal loop diagram example ... 29
Figure 3.2 A simple stock and flow diagram ... 29
Figure 3.3 How system dynamics models implement to real world problems51 ... 30
Figure 3.4 Hypothesis of applying stock and flow diagrams for diagnostic errors ... 31
Figure 3.5 Modelling process of this thesis ... 37
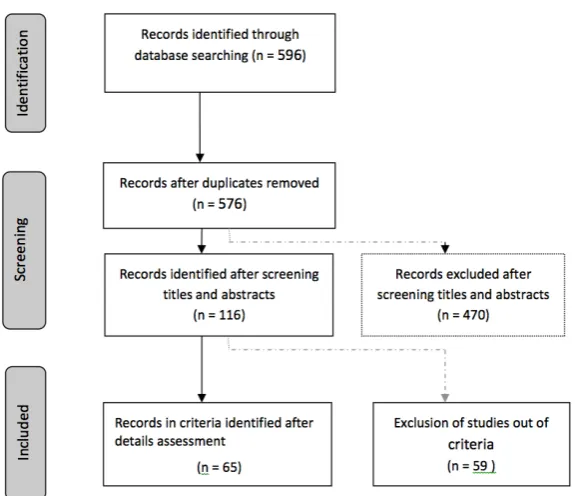
Figure 4.1 Flow diagram of study selection ... 43
Figure 4.2 Paper distribution ... 43
Figure 4.3 What can be done during diagnostic process ... 55
Figure 5.1 Process of developing the qualitative model ... 58
Figure 5.2 The causal loop diagram for diagnostic errors ... 61
Figure 5.3 3-level of causes tree of diagnostic errors ... 62
Figure 5.4 Causes tree 1 of the 3rd level factors ... 63
Figure 5.5 Causes tree 2 of the 3rd level factors ... 63
Figure 5.6 Causes tree 3 of the 3rd level factors ... 63
Figure 5.7 Uses tree of diagnostic errors ... 63
Figure 5.8 CLD of diagnostic errors adding an intervention ... 65
Figure 6.1 Interpreting diagnostic errors in a system dynamics model ... 67
Figure 6.2 Recognition-primed decision model138 ... 70
Figure 6.3 Diagnostic phases ... 71
Figure 6.4 The frame of the quantitative model structure ... 72
Figure 6.5 Hypothetical distributions of diagnostic test results140 ... 73
Figure 6.6 Receiver-Operator Characteristic (ROC) Curve140 ... 74
Figure 6.7 Factors and errors in diagnostic hypotheses ... 75
Figure 6.8 Model for errors from phase1 history taking and physical examination ... 77
Figure 6.9. Model for errors from Phase2 tests ... 78
Figure 6.10 Model for errors from phase3 referrals ... 79
Figure 6.11 Model for error effects ... 81
Figure 6.12 Quantitative model structure for diagnostic errors ... 83
Figure 7.1 Process flow of quantifying non-numerical variables ... 91
Figure 7.2 Data cleansing using SPSS modeler ... 96
Figure 7.3 Different graphs of v2 as a function of v1 ... 105
Figure 7.4 v1-v2 scatterplot with the regression line ... 108
Figure 7.5 v1-v3 scatterplot with the regression line ... 111
Figure 7.6 v1-v4 scatterplot with the regression line ... 113
Figure 7.7 y1-y2 scatterplot with the regression line ... 116
Figure 7.8 Bivariate scatterplots for y1 on its individual factor ... 118
Figure 7.9 Finding principal components in PCA ... 122
Figure 7.10 Eigenvalue graph ... 123
9
Figure 8.1 Seven steps for a formal expert elicitation ... 135
Figure 8.2 Simulation model ... 145
Figure 8.3 Cases with decision making errors (missed or wrongly diagnosis) ... 147
Figure 8.4 The change of “cases with decision making errors” plotted every day ... 152
Figure 8.5. The change of “cases with decision making errors” plotted every 30 days ... 152
Figure 8.6 The continuity of care impact on missed or wrongly hypothesised diagnosis ... 154
Figure 8.7 Sensitivity graphs for continuity of care ... 155
Figure 8.8 The patient medical history impact on missed or wrongly hypothesised diagnosis ... 156
10
LIST OF TABLES
Table 1.1 Links between each aim and its objectives ... 14
Table 2.1 Categories of diagnostic errors13 ... 18
Table 4.1 Search phrases in the systematic review ... 42
Table 4.2 Number of papers initially retrieved from databases ... 42
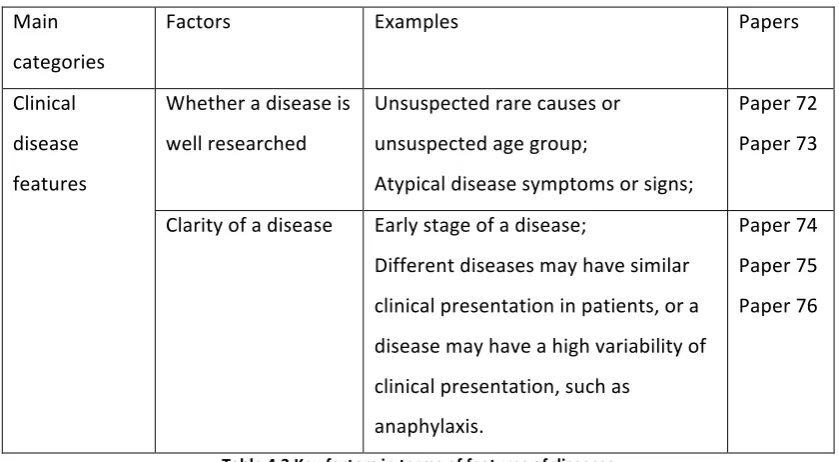
Table 4.3 Key factors in terms of features of diseases ... 46
Table 4.4 Key factors in terms of educational background ... 47
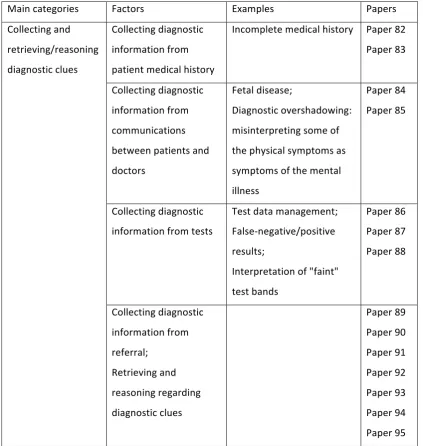
Table 4.5 Key factors in terms of diagnostic clues ... 48
Table 4.6 Psychological factors ... 49
Table 4.7 Follow-up factors ... 49
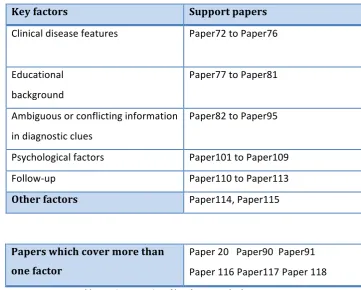
Table 4.8 Six categories of key factors and relevant papers ... 50
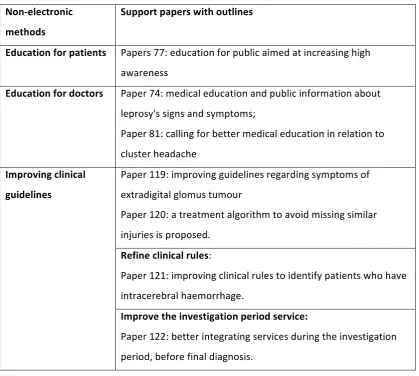
Table 4.9 Non-electronic methods and relevant papers ... 52
Table 4.10 Electronic methods and relevant papers ... 54
Table 6.1 Relations of test outcome and disease state ... 73
Table 7.1 List of the non-numerical variables and relevant dependent variables ... 86
Table 7.2 Non-numerical variables and scales ... 87
Table 7.3 Correlated dependent variables ... 87
Table 7.4 A descriptive table format showing patient cases and its category ... 87
Table 7.5 A table format showing individual doctors and his patient distribution within 3 categories ... 88
Table 7.6 The categories and its weighted score ... 88
Table 7.7 Non-numerical variables with assigned categories and scores. ... 89
Table 7.8 Doctor’s knowledge and experience scales and scores ... 90
Table 7.9 Data transformation ... 92
Table 7.10 Methods for data imputation ... 95
Table 7.11 Summary of the variables for the regression analysis ... 98
Table 7.12 Pearson’s correlation results ... 101
Table 7.13 Kendall’s correlation results ... 101
Table 7.14 Curve estimation for v2 as a function of v1 ... 105
Table 7.15 Curve standard error summary for v2 as a function of v1 ... 106
Table 7.16 ANOVA for the relational equation in v1 and v2 ... 108
Table 7.17 Curve estimation for v3 as a function of v1 ... 109
Table 7.18 Curve standard error summary for v3 as a function of v1 ... 109
Table 7.19 ANOVA for the relational equation in v1 and v3 ... 110
Table 7.20 Curve estimation for v4 as a function of v1 ... 112
Table 7.21 Curve standard error summary for v4 as a function of v1 ... 112
Table 7.22 ANOVA for the relational equation in v1 and v4 ... 112
Table 7.23 Curve estimation for y2 as a function of y1 ... 114
Table 7.24 Curve standard error summary for y2 as a function of y1 ... 114
Table 7.25 ANOVA for the relational equation in y1 and y2 ... 115
Table 7.26 Residuals statistics for y1 as a function of v2, v3 and v4 ... 119
11
Table 7.28. Coefficients analysis ... 119
Table 7.29. Pearson correlation anlysis for v2, v3 and v4 ... 120
Table 7.30 Descriptive statistics of v2, v3, v4 ... 122
Table 7.31 Component variance analysis ... 123
Table 7.32 Component pattern matrix before rotation ... 127
Table 7.33 Pattern/loading matrix - Oblimin with Kaiser normalization ... 128
Table 7.34 Structure/correlation matrix –Oblimin with Kaiser normalization ... 128
Table 7.35 Component/loading matrix - Varimax with Kaiser normalization ... 129
Table 7.36 Regression model of y1 and new components ... 129
Table 7.37 Comparison of two regression models ... 130
Table 8.1 Data for laboratory test errors from literature ... 134
Table 8.2 Patient outcome flows of diagnostic error cases ... 135
Table 8.3 A summary of target variables and seed variables ... 137
Table 8.4 Resulting solution (combined DM distribution of values assessed by experts) .... 141
Table 8.5 Results of ratios ... 141
Table 8.6 Statistical results of number of cases with decision-making errors over 300 days ... 147
Table 8.7 Three outflows from phase2 ... 148
Table 8.8 Comparison of three input error flows ... 149
Table 8.9 Four patient outcomes ... 150
Table 8.10 System outputs when changing “the continuity of care” ... 152
Table 8.11. System outputs when changing “patient medical history” ... 153
Table 8.12 Test repetition percentage impact on patient outcomes ... 157
Table 8.13 Follow-up percentage impact on patient outcomes ... 157
Table 8.14. Outcomes when changing two factors together ... 158
Table 9.1 Extreme testing results ... 163
12
Chapter 1
Introduction
1.1
Background and motivation
Diagnostic errors are the incorrect diagnoses after clinical examination or technical
diagnostic procedures1, which are widely recognised as missed, wrong or unintentionally
delayed diagnosis2. Diagnostic errors are taken as frequent errors with negative outcomes in
medical care. The rate of diagnostic errors occurring in medicine can reach up to 10% ~ 15%,
which is determined in the relevant autopsy studies 3 4 5. At the same time, some
researchers67 claim that about 40% ~ 60% errors may be still undetected by autopsies.
Diagnostic errors not only induce severe consequences to patient safety, which sometimes is irreparable, but also cause large extra finance payouts. Relevant tort shows it was nearly
twice as common as claims for other medication errors and resulted in the largest payouts8.
It is also claimed that diagnostic errors take the largest part in the ambulatory malpractice
claims and can cost up to $300 000 per claim approximately on average in the US.9
According to the research done by CRICO10, it was discovered that diagnosis-related claims
were the highest in frequency and severity of all malpractice cases11. In terms of these
diagnosis-related claims, cancer was the most common missed or misdiagnosis- related
disease, while myocardial infarctions lay in the second position.11 Meanwhile, diagnostic
errors are usually undiscovered and easily unreported. The medical incident reporting
system is still the essential way of reporting diagnostic errors 6, although it has some
limitations and unsatisfied outcomes in reporting them. The limitations of reporting them, such as insufficient records and poor quality of records, make the further analysing or detecting work even harder.
Many researchers believe diagnostic errors could be potentially reduced. 12 An increasing
number of researches about diagnostic errors were witnessed during the last decade. Most of these methods focus on one of the causes or a specific disease, which analyse diagnostic
errors at length1314, and the results are diverse and limited 15161718. A systemic view of
diagnostic errors and diagnostic process errors has not known and the possibility of analysing diagnostic errors from a system level has received little attention, although system-level solution is suggested by the Institute of Medicine as the most powerful way to
reduce medicine errors19.
Moreover, diagnosis is a complex process and is commonly multifactorial2. The diagnostic
13
affect each other. Errors that can happen at any phase of the diagnostic process may lead to
a diagnostic error directly or indirectly 20, and these errors are usually referred to as
diagnostic process errors. The causes of the errors at each phase may also affect the final decision-making, and can be the causes of diagnostic errors. Causes of diagnostic errors bring about both positive cause-effect relations and negative cause-effect relations. A positive cause-effect relation means the cause is positive to the effect. In other words, if the cause increases (decreases), then the effect, which is the diagnostic errors or diagnostic process errors, increases (decreases). A positive cause-effect relation means that if the cause increases (decreases), then the effect decreases (increases).
Therefore, diagnostic errors need to systemically analyse the causes, and illustrate the whole picture of causes and errors in the diagnostic process, and provide a way to seek system-level solutions.
1.2
Aims
This thesis aims to take the diagnostic process as a system, and systemically model
diagnostic errors. The qualitative model is to provide a structured and hierarchical picture of the causes of diagnostic errors. The quantitative model aims to study errors in a system of the diagnostic process, and to understand interrelations of model variables: the factors, which are the causes having either positive effect or negative effect on diagnostic errors; the errors, which are diagnostic errors, diagnostic process errors; and patient outcomes. It is to provide a way of observing model response to the changes of model variables using simulation experiments. The changes of model variables could indicate the effect of projected changes in demand or proposed interventions; thus, it can present the guidance of possible strategies in terms of diagnostic error reduction.
Specifically, the following aims are to be achieved:
• To identify the key factors or the leading causes of diagnostic errors and to provide
a structured and hierarchical picture of the causes/factors of diagnostic errors
• To represent errors in a system of diagnostic process from where errors initially
occur, how errors are delivered out of the model, to error effect on patient outcomes, and to identify quantitative interrelations between model variables.
• To understand the model behaviours and analyse diagnostic errors through the
whole picture of the diagnostic process.
14
1.3
Objectives
To achieve the above aims, this thesis seeks to accomplish the following specific objectives:
• To conduct a systematic review of recent researches and methods to reduce
diagnostic errors in order to identify the key factors of diagnostic errors.
• To design a qualitative model that reflects the interrelations between factors, as
well as the interrelations between factors and errors, in order to provide a structured and hierarchical picture of the factors of diagnostic errors.
• To collect feedback from clinicians to refine the multifactor model in order to
increase the reliability of the qualitative model.
• To further represent the qualitative model into the structure of a quantitative
model showing interrelations between model variables in order to quantitatively represent errors in the entire diagnostic process.
• To conduct regression analysis and to apply the algorithms in the system dynamics
modelling to determine quantitative interrelations between model variables.
• To conduct risk-free simulation experiments under different scenarios and to
observe the changes of model outputs when changing one or more model variables in order to observe model behaviours and analyse diagnostic errors through the whole picture of the diagnostic process.
• To adopt a comprehensive evaluation assessment for the quantitative model in
[image:15.595.119.529.561.751.2]order to evaluate the model and determine model applicability.
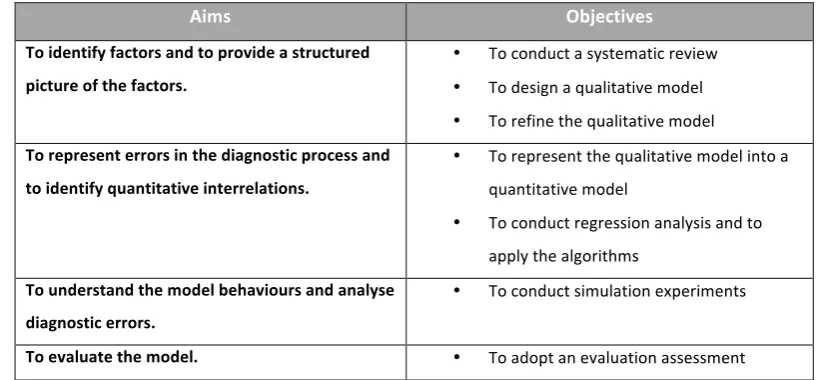
Table 1.1 shows the links between each aim and its objectives of this thesis.
Aims Objectives
To identify factors and to provide a structured picture of the factors.
• To conduct a systematic review
• To design a qualitative model
• To refine the qualitative model To represent errors in the diagnostic process and
to identify quantitative interrelations.
• To represent the qualitative model into a
quantitative model
• To conduct regression analysis and to
apply the algorithms
To understand the model behaviours and analyse diagnostic errors.
• To conduct simulation experiments
15
1.4
Organisation of the thesis
The rest of the thesis is organised as below:
Chapter 2 contains the primary literature review about the background of diagnostic errors.
Chapter 3 introduces the relevant methods, and summarises all methods used in the thesis.
Chapter 4 starts with a systematic literature review of diagnostic errors, and then enters in the discovery of key factors and relevant methods reducing diagnostic errors.
Chapter 5 uses the findings from the previous chapter to illustrate a qualitative multi-factor model by causal loop diagrams. Relevant factors and cause-effect relations are further revised based on clinicians’ opinions.
Chapter 6 shows the development of the quantitative model for diagnostic errors. It discusses individual phases of the diagnostic process covering the phases of the diagnostic process as well as the phase of after-diagnosis, and maps the key factors from the
qualitative model and errors into different phases.
Chapter 7 is devoted to the regression analysis of the interrelations of factors and the
number of errors in the diagnostic hypotheses during the first diagnostic phase: history
taking and physical examinations. It first introduces how to quantify the non-numerical
variables, and then collects the relevant data for the analysis. Regression modelling is carried out in this chapter, and the results of the regression models are described and evaluated using different metrics. The equations of regression models are further applied to the system dynamics modelling to accomplish the quantitative relations between system elements, considering that system dynamics modelling has limitations in determining the quantitative relational equations when it is implemented alone.
Chapter 8 presents the model simulation. The first part is to collect data for model simulation, and the later part is to perform simulation experiments. Simulation results of error flows and patient outcomes are discussed, and model behaviours are observed under different scenarios.
Chapter 9 focuses on model evaluation. It summaries the evaluation methods for regression models, and further implements a list of evaluation assessments for system dynamics models. The results of the assessments are provided and discussed.
16
Chapter 11 concludes the work of the thesis.
The original work presented in this thesis is based on the following peer-reviewed publications:
• Full paper: Guo, S., Roudsari, A. and Garcez, A. (May 2015) A System Dynamics
Approach to Analyze Laboratory Test Errors. Studies in health technology and
informatics, 26th European Medical Informatics Conference (MIE2015), 210,
266-270
• Full paper: Guo, S., Roudsari, A. and Garcez, A. (Jan 2015). Modelling clinical
diagnostic errors: a system dynamics approach. Studies in health technology and informatics, 208, 160-164.
• Full paper: Guo, S., Roudsari, A. and Garcez, A. (2014). A causal loop approach to the
study of diagnostic errors. Studies in health technology and informatics, 25th
17
Chapter 2
Preliminary Literature Review
2.1
Introduction
This chapter starts by introducing general medical errors to help understand the role of diagnostic errors from the aspect of patient safety in healthcare. Then, it further describes the background and characteristics of diagnostic errors in detail, which provides the information about the current situation and specific challenges for researchers.
2.2
Medical errors and diagnostic errors
A medical error is “the failure to complete a planned action as intended or the use of a
wrong plan to achieve an aim”, defined by the US Institute of Medicine21. In other words, all
actions which are committed by health professionals and cause harm to patients are taken as medical errors, including “diagnostic errors, medication errors, errors in the performance of surgical procedures, in the use of other types of therapy, in the use of equipment, and in
the interpretation of laboratory findings”22. The frequency and magnitude of medical errors
were not well known until the 1990s, and after recognising that medical errors impact on one in ten patients in the world; the World Health Organisation calls patient safety an
endemic concern.23 Nevertheless, diagnostic errors, as a part of medical errors, started to
come to public attention in the last decade. Most relevant researches have been conducted
since the beginning of the 21st century, and they aimed to understand the causes of
diagnostic errors and the ways of reducing diagnostic errors. However, most studies are in-depth partial analysis of the diagnostic error problem, such as improving doctor education to avoid diagnostic errors and finding the most efficient educational methods in terms of diagnostic errors, and few studies observe the entire diagnostic process or patient pathway in terms of diagnostic errors. The particular characteristics of diagnostic errors make the problem analysis and solution seeking even harder.
Diagnostic errors are the missed, wrong or delayed diagnosis, based on a classification used by the Australian Patient Safety Foundation. It is the errors happening after clinical
examination or technical diagnostic procedures. Graber et al in 200213 showed that
18
Table 2.1 Categories of diagnostic errors13
“No-fault errors” are the cases where the illness is silent, or masked, or presented in an atypical presentation such that the correct diagnosis, with the current state of medical
knowledge, would not be expected.24 ‘‘Cognitive errors’’ are the errors cause by adequate
knowledge or faulty data gathering, or inaccurate clinical reasoning, or faulty verification.13
24 “No-fault errors” and ‘‘Cognitive errors’’ are usually considered as more harmful errors,
whilst little has been known to reduce them79.‘‘System errors’’ are related to the system,
including faults of technologies or flaws of relevant systems, such as faulty tests or patients with abnormal test results being neglected.
2.3
Diagnostic error characteristics
Compared to other medical errors, diagnostic errors have their special characteristics, which are discussed as below.
• Diagnostic errors indicate severe harm in relation to patient safety. Relevant
research25 in the UK shows 25% of diagnostic incidents resulted in death, 23% in
disability and 15% in cognitive impairment and/or disability6. One research result26
of hospitalised patient samples from 21 hospitals in the Netherlands showed that 23% of adverse events related to diagnostic process contributed to death. But still it
is believed that diagnostic errors are potentially preventable.12
• Diagnostic errors are usually undetected, recognised late and easily unreported to
the current incident reporting system.
In the primary care service, general practitioners (GPs) are not only the important executor during the diagnosis, but also have an essential role of preventing and
reporting diagnostic errors 27.
No-fault errors
• Unusual presentaqon of disease
• Uncertainty regarding the state of the world
• Lack of paqent cooperaqon • Limitaqons of medical
knowledge
• Failure of noremaqve precesses
System errors
• Technical failure • Organisaqonal failure
Cogniqve errors
19
Incident reporting systems, such as the National Reporting and Learning System (NRLS) in the UK, are the essential tools currently used for reporting and detecting diagnostic errors, and also provide the main source of diagnostic errors for further
analysis6. Nevertheless, incident reporting systems have obvious limitations and
unsatisfied outcomes in reporting diagnostic errors, mainly because the systems are challenged in reporting every diagnostic error, and recording high-quality records. For the diagnostic error cases that have been successfully reported, the report quality is variable. Reports can hardly avoid unintended false information, and the accuracy and clarity of the reports should be improved.
The other ways of finding diagnostic errors are usually through clinical follow-ups or
necropsies28. Specially, autopsy is considered by many researchers to play an
important role in providing reliable information for misdiagnosed cases.3 4
Thus, poorly reported diagnostic errors and lack of high-quality records make the relevant studies more challenging.
• Diagnosis sometimes can be under time constraint especially in emergency
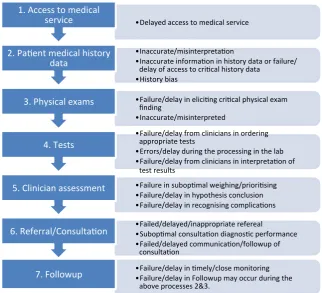
departments, and is a complex process involving many phases and factors. These factors have an impact on the actions during the diagnostic process and then affect the diagnostic decisions directly or indirectly, while, at the same time, the factors may be related to each other as well. The entire diagnostic process can be reflected in the diagnostic process, which includes initial access to the patient, history taking, physical exams, tests, doctor assessment, consultation and follow-up procedures. Schiff et al in 2005 illustrated where and what errors may occur during the
diagnostic process20, as shown in Figure 2.1.
20
Figure 2.1 Where and what errors may occur20
• In spite of many relevant researches about diagnostic errors, more effort still needs
to be made to find effective ways of reducing diagnostic errors and improving patient safety, especially in terms of systemic analysis. Many studies focus on the individual health provider or single factor for error-improvement strategies. However, diagnostic errors should be observed from the entire diagnostic process as a system, and methods for changes from a system view, which reflect the impact of all key health providers and key factors, are believed to be a more effective way
of seeking solutions.2930 Relevant works from Reason3132 reflect that systemic
analysis has its advantage of reducing errors, using the “Swiss Cheese model”31,
shown as Figure 2.2. The model illustrates that although many layers lie between hazards and losses, errors can happen if flaws in each layer are aligned.
• Delayed access to medical service
1. Access to medical service
• Inaccurate/misinterpretaqon
• Inaccurate informaqon in history data or failure/ delay of access to criqcal history data
• History bias 2. Paqent medical history
data
• Failure/delay in eliciqng criqcal physical exam finding
• Inaccurate/misinterpreted 3. Physical exams
• Failure/delay from clinicians in ordering appropriate tests
• Errors/delay during the processing in the lab • Failure/delay from clinicians in interpretaqon of
test results 4. Tests
• Failure in subopqmal weighing/prioriqsing
• Failure/delay in hypothesis conclusion
• Failure/delay in recognising complicaqons
5. Clinician assessment
• Failed/delayed/inappropriate refereal
• Subopqmal consultaqon diagnosqc performance • Failed/delayed communicaqon/followup of
consultaqon 6. Referral/Consultaqon
• Failure/delay in qmely/close monitoring • Failure/delay in Followup may occur during the
21
Figure 2.2 Swiss cheese model31
Additionally, one research33 in 2002 suggests that methods of reducing diagnostic
errors from a view of the entire diagnostic process, such as either avoiding diagnostic errors or correcting diagnostic errors in the early stage, represent a possible and effective way of preventing harm to patients, and fail-safe methods will
fail to improve patient outcomes.
Thus, the diagnostic error problem requires the analysis of the entire diagnostic process as a system.
• The way of measuring diagnostic errors remains unknown. A more scientific and
precise method or magnitude to measure diagnostic errors is needed34.
2.4
Summary
Five characteristics of diagnostic error are discussed in this chapter. It has been shown that diagnostic errors have negative impact on patient safety and trigger the demand to reduce its occurrence and impact, and diagnosis is a complex diagnostic process covering different factors at each phase. Although many researches have been carried on seeking ways of reducing diagnostic errors, most are either disease-focused or individual provider-focused. According to the primary literature review, few studies provide systemic analysis of factors and errors during each phase of diagnostic process. Current ways of reducing diagnostic
error need to be further reviewed and summarised.What is more, no study was found in
22
23
Chapter 3
Methods
3.1
Introduction
This chapter introduces the methods used in the thesis. It begins by comparing models of errors in healthcare. Then, it introduces system dynamics modelling and regression modelling, including their application hypotheses of how they might help with the diagnostic error problem. Data collection methods are also presented in this chapter.
3.2
System modelling
System modelling is an essential tool of analysing the elements or components in the system. It has significant benefits in managing the interactions of the elements, and understanding the functionality of the system, and it especially enables the analyst to
predict the effect of changes to the system. 35
System modelling has been widely applied, and can represent a system in various ways with different aims. It is often classified into the following types: data processing model which shows how the data are processed at different phases; composition model showing how entities are composed of other entities; architectural model showing principal sub-systems; classification model showing how entities have common characteristics; and
stimulus/response model showing the system’s reaction to events. 36
The downside of modelling may be considered as some types of modelling may produce too much documentation, and a model with too many details may be difficult for users to
understand sometimes. 36
A typical modelling and simulation process mainly involves developing a simulation model, designing a simulation experiment, and performing simulation analysis. Specifically, the
process covers the possible steps as below35:
• Identify the problem.
• Formulate the problem.
• Collect and process real system data.
• Formulate and develop a model
• Validate the model, and iterate between model refinement and validation.
• Document the model for future use.
24
• Establish experimental conditions for runs.
• Perform simulation runs.
• Interpret and present results.
• Recommend further course of action.
Diagnosis is a complex process involving multiple phases and many factors. Studying diagnostic errors requires a way of showing the correlations of the factors, analysing the problem from the entire diagnostic process. Modelling errors in the diagnostic process can help analysing root causes by constructing the structure of cause and effect variables. At the same time, it is a method of describing the entire system and analysing the problem from a system viewpoint. It is a systemic approach to discover how errors happen, as well as to
propose better management policies and organisational structures37. Models in healthcare
provide a constructive way of discovering real causes and offer theoretical underpinnings for both researchers and clinicians.
3.3
Comparing models of errors in healthcare
Based on the searching of models in error management or error control in healthcare and complex systems, several models were found in the studies of modelling medical errors; these models are structural-equation models (SEM), Bayesian hierarchical models, and system dynamics models. This section discusses these three types of modelling methods separately.
a. Structural-equation modelling
SEM is “a comprehensive statistical approach to testing hypotheses about relations”38
among observed (measured) variables and unobserved (latent) variables. It usually includes
two parts: a "measurement model" and a "structural regression model"3940. A
"measurement model" defines latent variables, which are not directly observed but rather inferred from one or more observed variables. A "structural regression model" links latent variables together, via statistical methods, to observe the quantitative impact of inputs on the outputs and to estimate relations between inputs and outputs.
25
Root Mean Squared Error of Approximation (RMSEA), to the determination of the model fit.41
It was used to explore the factors of medical errors as well as the estimation of factor
impact in a prospective cohort study in 201242. The study was designed to find the
cause-and-effect relationship between potential predictors from nurses, such as age and degree of depression, and medical errors. The outputs suggested SEM could be a countermeasure for the factors of medical errors.
Generally speaking, SEM provides a reliable way of determining cause-and-effect
relationships, especially for unobserved variables. However, it requires a good quantity of data to perform and it is not applicable to reflecting the component structure of a system. In addition, the potential causes have to be predicted first.
b. Bayesian hierarchical modelling
Bayesian hierarchical modelling, a particular type of Bayesian network, is also a type of
statistical model that represents the probabilistic relationships. One study43 in 2010 using a
Bayesian hierarchical model discovered causes of a type of medical error, called “near misses” which had the potential to cause serious harm but did not. This model, using a mathematical approach, analysed clinical evidence or data to find out the causes or the contributing factors of the error.
Compared to the SEM model, the relationships in the Bayesian hierarchical model are not limited to the cause-effect relationship, but it requires a much larger amount of evidence as the input data to determine the relationships in a quantitative way.
c. System dynamics modelling
System dynamics modelling is different from statistically based SEM and Bayesian hierarchical modelling methods. It uses simulations to provide the relevant data flow information in the system components over time. It not only illustrates complex internal relationships that affect system behaviours, but also reflects the component structure of a
system. Thus, it is an approach widely employed for complex systems.44 Eric Wolstenholme
explained system dynamics as “problem solving and analysis of complex real world systems
by methodological means, where the emphasis is on promoting holistic understanding rather
than piecemeal solutions”63. By simulating an over-time look of the output flow under both
26
System dynamic modelling has a significant advantage in representing known relations and reflecting components in complex systems. However, as with SEM, it also requires the causes to be determined first. Moreover, it has limitations in identifying the relationship functions between multi-variables and their effect variables. Moreover, it requires real-time data to plot real-time simulation outputs.
3.4
System dynamics modelling
This section introduces the system dynamics modelling method in further detail, explains the reason to implement system dynamics modelling in diagnostic error analysis, and shows how system dynamics modelling can perform systemic analysis of diagnostic errors.
3.4.1 Introduction of system dynamics modelling and its applications
Jay W. Forrester of the Massachusetts Institute of Technology firstly proposed the system
dynamic modelling during mid-1950s, and published his work in the book Industrial
Dynamics37, where system dynamics modelling was described in length in the application of
helping General Electric (GE) manager better understand industrial processes
.
Until the late1960s, system dynamics modelling had been applied almost exclusively to corporate or
managerial problems.45
Since the late 1960s, Jay W. Forrester had been working with John Collins and they
published a book titled Urban Dynamics, which served as the sign that system dynamics
started to broaden its application into non-corporate areas.52 It was the key that led to the
later two well-known projects in the early 1970s in system dynamics area: World Dynamics
and the Limits to Growth. In 1970, Jay Forrester was invited to a meeting in Bern by a group
called the Club of Rome, and the world problems discussed at the meeting became the basis
for the model in World Dynamics.52 World Dynamics was published in 1971, which extended
system dynamics application into modelling important interrelationships between world
population, industrial production, pollution, resources, and food.45 The model also predicted
a collapse of the world socioeconomic system sometime during the twenty-first century.
The Club of Rome further funded Meadows and her associates to conduct the Limits to
Growth where system dynamics modeling was applied in explaining world population
growth and economic growth. It was published in 1972, and discussed the growth,
27
The Fifth Discipline by Peter Senge in 199047, which described systems thinking in helping to
convert companies into learning organizations, popularized the qualitative systems dynamics in organizational learning and managerial application. At about the same time,
Eric Wolstenholme developed “System Enquiry”63 and gave its definition by combining its
original definitions and its later broadening of applications: “ A rigorous method for qualitative description, exploration and analysis of complex systems in terms of their processes, information, organisational boundaries and strategies; which facilitates quantitative simulation modelling and analysis for the design of system structure and
control”63. Since 1990, a number of researchers of system dynamics, including Richardson48,
Richmond49, and Vennix50, started to recognize the issue of client involvement and develop
protocols for group model building that is a method for analyzing data with a group of people. John Sterman further promoted system thinking in the analysis of policy and
strategy in 2000.51
System dynamics modelling can be applied to any dynamic system with any time and spatial
scale51. System dynamics modelling initially arose in relation to corporate or managerial
problems37 and then has broadened its application into non-corporate areas since the late
1960s52. Nowadays it has been used widely in real life, including healthcare. It was
implemented in healthcare applications since the 1970s, and has been witnessed in a large number of applications of healthcare researches in recent years. These researches involves
several aspects of health and social care53, such as health reform54, capacity planning55,
older people’s services56, disease management57 and mental health58. The health interest
group in International System Dynamics Society established in 1983, was organized in
2003.62 Its applications in healthcare and social care system aim to illustrate the structure of
system resources and give suggestions on significant resource that can be saved, without
influencing performance59. Furthermore, its applications in disease researches help to
interpret experimental results and understand the dynamics of results, for example research
into HIV and human immune system60. System dynamics modelling is currently adopted as
the major tool in the modelling kit for the Operational Research(OR) Group in the Department Health, England and has been used in a wide range of health policy and
programme development and implementations61, including: assessing public health risks;
28
Homer and Hirsch in 2006 summarised its current application in healthcare into five aspects62:
1) Disease epidemiology
2) Substance abuse epidemiology
3) Patient flows in emergency and extended care
4) Health care capacity and delivery
5) Interactions between health care or public health capacity and disease
epidemiology.
The system dynamics modelling can be both “solution oriented” and “learning oriented”. It is commonly recognised as a tool for discovering problems and suggesting solutions. At the
same time, it is also a tool for learning about the system61. In particular, when there is no
single optimal solution, it helps to learn system behaviours and to propose possible strategies.
3.4.2 Two phases of system dynamics
System dynamics involves two phases: “qualitative system dynamics” and “quantitative
system dynamics”.51
Qualitative system dynamics:
The qualitative system dynamics phase is the model construction and analysis. It defines how individual variables are working in the system, via visualising the interrelations among variables, and makes clear how interrelated variables affect each other using arrow links. It can be implemented in order to “quickly capture hypotheses about the causes of dynamics; elicit and capture the mental models of individuals or teams; and ccommunicate the
important feedbacks which you believe are responsible for a problem.”51
A qualitative system dynamics model is often known as a “Causal Loop Diagram”(CLD), as it
29
Figure 3.1 A causal loop diagram example
Figure 3.1 is a CLD example. Three variables A, B, C are represented in nodes in the figure, and arrows show cause-effect links or relationships between the two linked variables. The arrow polarities indicate link polarities. A points to B with a positive polarity at the end of the arrow, which means A is the cause of B and A has positive effect to B. In other words, if A increases, B would increase. On the other hand, C has an arrow with a negative polarity to B, which indicates C has negative effect to B. Following the arrows, B also gives feedback to A &C and feedback loops are formed. By tracing the effect of a change around the loop, the loop polarity can be determined. Loops, such as loop 1, that can reinforce change are named as positive loops or reinforcing loops, while loops that are self-correcting are negative loops or balancing loops, such as loop 2.
Quantitative system dynamics:
Quantitative system dynamics represents the system using “Stock and Flow Diagrams”. A simple diagram is shown as Figure 3.2.
Figure 3.2 A simple stock and flow diagram
As we can see, the above diagram is made from a rectangle with an input arrow and an output arrow. The rectangle, referring to as “Stock”, indicates a quantitative stock. The input arrow indicates the inflow of the stock, and it increases the stock level. On the other
hand, output arrow indicates the outflow of the stock, and it decreases the stock level.63
Mathematical representations, shown as an integral equation in Eq. (3.1) and a differential equation in Eq. (3.2), can be exploited to explain level changes of the stock over a period of time from initial time t0 to current time t. Stocks are known as integrals or state variables, and flows are known as rates or derivatives.
Variable A Variable B Variable C
+
+ +
-Loop 1 Loop 2
stock
30
𝑠𝑡𝑜𝑐𝑘 𝑡 = ! 𝑖𝑛𝑓𝑙𝑜𝑤 𝑠 −𝑜𝑢𝑡𝑓𝑙𝑜𝑤 𝑠 𝑑𝑠+𝑠𝑡𝑜𝑐𝑘 𝑡!
!!
(3.1)
where s represents any time between the initial time t0 and the current time t.
𝑑 𝑠𝑡𝑜𝑐𝑘
𝑑𝑡 =𝑖𝑛𝑓𝑙𝑜𝑤 𝑡 −𝑜𝑢𝑡𝑓𝑙𝑜𝑤(𝑡)
(3.2)
3.4.3 Its application hypothesis
A basic structure of decision making for real world problems follows a circular loop, and includes three components: 1, recognising real world problems; 2, collecting or retrieving for decision makers reliable qualitative and quantitative information from the real world; 3, decision makers making decisions, and decisions implemented back into the real world system.
How system dynamics models are applied to real world problems is illustrated in Figure 3.3,
introduced by Sterman in 2000 51. System dynamics modelling represents the dynamics of a
system in the second component “Information Feedback” by discovering and representing the feedback process. System dynamics modelling simulation is the stage of proposing possible strategy, structure and decision rules, which helps decision makers with making decisions.
Figure 3.3 How system dynamics models implement to real world problems51
Similarly with other applications in complex systems, system dynamics modelling can contribute to a systemic analysis of diagnostic errors in many ways from both “solution oriented” and “learning oriented” aspects. The following hypotheses can be used in implementing system dynamics modelling in the context of diagnostic error analysis.
Real World
Decisions Information
Feedback
Strategy, Structure, Decision
rules
Mental Models
Simulation to infer dynamics of models
31
• It helps with learning the relations between factors and effect variables, as well as
understanding factors, especially for factors not readily quantified.
Diagnostic errors involve many factors during the whole diagnostic process. After discovering all key factors of diagnostic errors, CLDs can help illustrating the links between the factors and relevant effect variables. Also, further quantitative analysis helps to understand how the individual factor contributes to the system.
• It provides a systemic analysis of the diagnostic error problem.
The diagnostic process can be used as a guide in mapping the key phases, and links phases together. System dynamics modelling can follow the process and provide a whole picture for tracing errors in the process and how it is linked to decision-making errors as well as patient outcomes.
• System dynamics modelling, linking different phases of the system together,
performs simulation of the number of errors in all phases and then suggests potential strategies for reducing diagnostic errors.
During each phase, new errors may occur when doctors collect diagnostic information or diagnostic clues. At the same time, errors may be realized or corrected in the following phases. As shown in Figure 3.4, stock and flow diagrams can be used to interpret the number of errors at each phase and error flows in the system. The simulation of the quantitative model helps to analyse how the level will be changed by the changes of relevant variables over a period of time.
Figure 3.4 Hypothesis of applying stock and flow diagrams for diagnostic errors
Chapter 5 and Chapter 6 will give further explanations on the application of system dynamics modelling including both the qualitative model and the quantitative model.
3.4.4 Why use system dynamics modelling
The reasons to choose the system dynamics modelling method is mainly because of the following considerations:
32
Diagnosis is a complex process. Many factors involved in the diagnostic process can affect the final decision making directly or indirectly, and many phases in the diagnostic process are connected and sometimes worked together. System dynamics modelling is adapted to complex systems. It could help to analyse the causes, identify or structure the internal relationships of model elements, and link all phases together in order to conduct the analysis and to observe the whole system behaviours.
2. Its coverage of both positive and negative factors.
System dynamics models can present both positive and negative factors. Specifically, The
factors are called “causes” in the CLDs, where the “causes” can have both positive effect and
negative effect.
3. Its both “solution oriented” and “learning oriented” applications.
By performing simulation experiments, it helps to discover system behaviours. Especially, when one or more factors of the system are changed, it provides a clear view of the changes in the relevant key variables. For the system with variables that can be readily quantified, it
is known as a way of predicting an optimal solution to a problem64. If the system is closely
associated with variables that cannot be readily quantified and there will be no single
optimal solution, system dynamics modelling becomes a tool for learning.61
4. Its current application in healthcare.
System dynamics modelling has been widely used and known in healthcare. Extending its application to diagnostic errors helps with learning about diagnostic errors, and provides an opportunity of linking or combining the model of diagnostic errors with other existing models together.
5. An economic approach.
System dynamics modelling can implement computer simulations that are very low cost62,
33
3.5
Regression analysis
This section discusses the hypotheses involved in applying regression analysis to the
systemic model of diagnostic error, where the implementation of regression analysis mainly aims to overcome the limitation of the system dynamics modelling.
3.5.1 Introduction of regression analysis and its applications
Although system dynamic modelling provides a method for looking into the entire system instead of partial analysis, it has its limitations at the same time. It is limited to determining parameters as well as relationship functions between multi-variables and relevant
dependent variables. The initial diagnosis phase, history taking and physical examinations, is
an essential phase for decision making in the diagnostic process, and it involves many key factors that affect the error rate in the initial diagnostic hypotheses. The quantitative relationship functions between the factors and the number of errors in the diagnostic hypotheses are unknown. Thus, a method is required to determine the interrelationship functions in this part and to overcome the limitation of system dynamics modelling.
Regression analysis is a statistical method and is widely used to estimate the relationship functions among variables based on observed data, and regression analysis is used in the thesis regarding the issue above. It is applicable for the relationship between a dependent variable and one or more independent variables and the relationship can be either linear or non-linear.
Generally, regression modelling consists of four parts:
1) Cohort construction. This is to define aims, targets and, sometimes, time window.
2) Feature/factor engineering. It includes data cleansing, data imputation, feature
construction and feature selection. The common methods used for feature selection are using filters, a wrapper or embedded optimisation. There are three reasons to conduct feature selection: simplification of models for an easy interpretation; shorter training times; and enhancing generalisation and avoiding overfitting.
3) Regression modelling. Firstly, regression analysis requires identifying the possible
34
relationship can be determined by identifying the parameters p & q using training data.
4) Model evaluation. The evaluation approaches cover using cross validation or
external validation to compare the model outputs to the real data, or using metrics
to analyse model outputs, such as variance or R2.
3.5.2 Its application hypothesis
Regression modelling can be implemented in estimating the quantitative relationships between multi factors and their dependent variables, such as the number of errors, during
the phase of history taking and physical examinations. It complements system dynamics
modelling by providing modelling relationship functions between multi-variables and their dependent variable. These functions obtained by regression analysis are further applied in the system dynamics model.
In order to accomplish determining the relationship functions, following the same recipe for the SEM method introduced in section 3.3, there are two tasks: defining variables and determining regression models. For the first task, the results of the CLDs and the structure of the stock and flow diagrams in system dynamics modelling can be used to define the variables as well as the qualitative variable relations. The second task is to conduct regression analysis and determine the relationship functions.
For unobserved or non-numerical variables involved in the system, there are two ways of scaling the variables. One method is used in the SEM, and it measures the unobserved variables by one or more observed variables as indicators. Take a variable “depression” as an example. It can be measured by several observed variables such as “loss of interest”, “sleep problem”. The downside of the method is that it requires more data for the
indicators. The other method is using a Likert scale, which can be used to scale these
variables into measurable ordinal variables. For example, “sleep problem” can be scaled into three groups: “light”, “moderate” and “severe”. Both methods can be applied to measuring the factors of diagnostic errors.
Regression models generally use the goodness of fit to test the model fit. It can either use new observed data to test the model-predicted results, or summarise the discrepancy
between original observed values and the values expected under the model65. The general
35
3.5.3 Why use regression analysis?
The main reasons why regression analysis is applied to modelling diagnostic errors are listed as follows:
• Regression analysis is widely used in determining the relationship functions in
different areas, and sufficient software and methods support conducting regression analysis.
• It fits the process of system dynamics modelling well. The CLD in system dynamics
modelling provides the information for its feature-engineering step, and its modelling results help system dynamics modelling provide relationship functions and thus overcome the limitations of system dynamics modelling.
• A Bayesian network is not applicable because it requires even larger amounts of
data to be collected, and the relations in the problem of diagnostic errors are limited to cause-and-effect relations.
3.6
Software
The research described in this thesis is conducted mainly using two pieces of softwares:
Vensim and SPSS. The software used for the system dynamics modelling is Vensim66. Vensim
is a free software package. It can illustrate the CLD, build hieratical cause trees, demonstrate
and simulate quantitative models. The software used for the regression analysis is SPSS67,
which can conduct correlation analysis perform, different curve estimations, regression analysis as well as testing model fit.
3.7
Data collection methods
Data used in the thesis mainly come from two sources: public data from literature and data from experts. For the variables that have sufficient data in the literature, literature data are chosen as a prior data source. For the variables that lack appropriate literature sources, data are collected from experts.
36
provides a number of data sets for individual variables. Expert elicitation is a method used to obtain estimations of variables from expert opinions, and specifically works for the
assessment with insufficient, incomplete, controversial or inconsistent information.68 It is
chosen in the thesis to provide estimated values with confidence bands for simulation tests.
3.8
Summary of methods used in the thesis
This thesis adopts a systemic model for diagnostic errors based on the system dynamics modelling approach, and also combines computer science regression methods into the system dynamics modelling.
The first part of this thesis focuses on the qualitative system dynamics modelling, which uses CLDs to qualitatively present the factors affecting diagnosis and their interrelations. A systematic literature review and discussions with experts are implemented as the main methods in this part. The systematic review provides the source and evidence to identify the key factors of diagnostic errors. An initial CLD is designed based on the translation of the knowledge from the systematic review. Then, discussions with clinicians about the initial CLD are followed to further refine the qualitative model and improve its reliability. The second part is about quantitative system dynamics modelling which implements the stock and flow diagrams to quantitatively simulate the factors and diagnostic errors. The
quantitative system dynamics modelling takes the diagnostic process as a system, and maps the diagnostic phases following the diagnostic process, which covers all the phases from
“history taking and physical examination” to the “after-diagnosis” phase. Based on the
previous CLD, it presents the error flows in different phases of diagnosis and relations with relevant factors. Regression analysis is used in this part to identify the relationship functions of factors and their dependent variables in the phase of history taking and physical
examinations. After applying the regression results to the quantitative model, simulations are conducted to demonstrate how changing one or more variables affects diagnostic outputs, where the variable changing may indicate the effect of an external intervention or a policy. The evaluation of the model is described in the last part of the thesis.
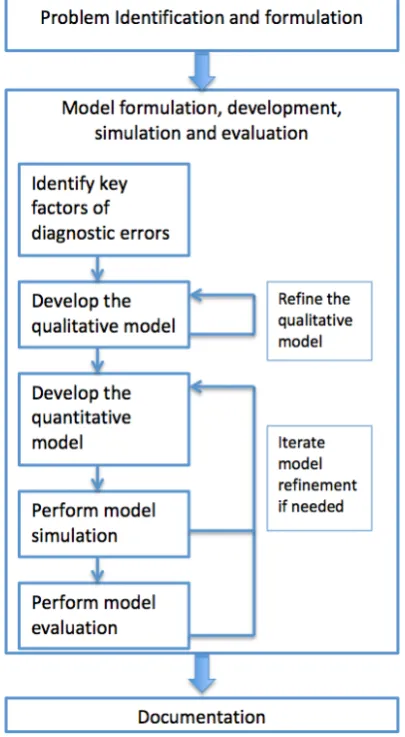
37
perception of the problem of diagnostic errors leads to a modelling purpose. Then, the model formulation is further developed in order to understand the diagnosis process and the diagnostic errors. During the modeling process, model identification is a key ingredient. It includes two aspects: model structure development and model parameter identification. Model identification starts with identifying key factors of diagnostic errors. A qualitative model, as the essential model structure, is constructed and refined after this process. Based on the qualitative model, a quantitative model is developed, where model parameters are identified. Furthermore, simulation experiments are conducted and the quantitative model is evaluated. Meanwhile, feedback from model simulation and evaluation can help to refine
model structure and model parameters.69 The process of between model developing and
[image:38.595.225.428.349.718.2]model evaluation may be iterated in order to do refine the model based on the feedback of simulation and evaluation results. In the end, the model is documented and test results are presented for future use.