City, University of London Institutional Repository
Citation:
Popov, P. T., Salako, K. & Stankovic, V. (2015). Stochastic modeling for
performance evaluation of database replication protocols. Lecture Notes in Computer
Science, 9259(9259), pp. 21-37. doi: 10.1007/978-3-319-22264-6_2 ISSN 0302-9743
This is the accepted version of the paper.
This version of the publication may differ from the final published
version.
Permanent repository link:
http://openaccess.city.ac.uk/11965/
Link to published version:
http://dx.doi.org/10.1007/978-3-319-22264-6_2
Copyright and reuse: City Research Online aims to make research
outputs of City, University of London available to a wider audience.
Copyright and Moral Rights remain with the author(s) and/or copyright
holders. URLs from City Research Online may be freely distributed and
linked to.
City Research Online:
http://openaccess.city.ac.uk/
[email protected]
Stochastic modeling for performance evaluation of
database replication protocols
Peter Popov, Kizito Salako, Vladimir Stankovic
{P.T.Popov, K.O.Salako, V.Stankovic}@city.ac.uk Centre for Software Reliability, City University London, UK
Abstract. Performance is often the most important non-functional property for database systems and associated replication solutions. This is true at least in in-dustrial contexts. Evaluating performance using real systems, however, is com-putationally demanding and costly. In many cases, choosing between several competing replication protocols poses a difficulty in ranking these protocols meaningfully: the ranking is determined not so much by the quality of the com-peting protocols but, instead, by the quality of the available implementations. Addressing this difficulty requires a level of abstraction in which the impact on the comparison of the implementations is reduced, or entirely eliminated. We propose a stochastic model for performance evaluation of database replication protocols, paying particular attention to: i) empirical validation of a number of assumptions used in the stochastic model, and ii) empirical validation of model accuracy for a chosen replication protocol. For the empirical validations we used the TPC-C benchmark. Our implementation of the model is based on Stochastic Activity Networks (SAN), extended by bespoke code. The model may reduce the cost of performance evaluation in comparison with empirical measurements, while keeping the accuracy of the assessment to an acceptable level.
Keywords: stochastic modeling; database replication protocols; performance evaluation; diverse redundancy
1
Introduction
Performance evaluation of database systems is important and usually affects the decision about which among many competing products to use. Performance evaluation via meas-urements with real database systems is a complex and expensive process. If comparison of replication protocols is sought, the above problems are compounded by the fact that the ranking among the compared protocols might be affected by both the quality of the available implementations of the compared protocols and the precision/accuracy of the methods employed in the evaluation process itself.
Performance evaluation via stochastic modelling has some potential advantages in comparison with performance measurements using real systems:
own experience, performance measurement takes a lot of time, especially if perfor-mance needs to be measured in a wide range of conditions (varying workload, size of the data processed by the tested system, hardware constraints, etc.). The cost will further escalate if getting high confidence in the performance evaluation is neces-sary. Performance measures, e.g. average transaction response time or throughput, may vary significantly between individual measurements. Stochastic models may offer dramatic cost-savings in these circumstances;
Replication protocols – which one to choose? Being able to compare replication pro-tocols at a high level of abstraction (eliminating the limitations of a particular imple-mentation) is useful before one commits to a particular solution. Typically, new pro-tocols are compared with the performance of a single solution, but rarely can two competing protocols be measured without the comparison being affected by the qual-ity of the particular implementations. The ranking of the products may reflect the quality of the implementations, rather than the quality, or lack thereof, of the com-pared replication solutions. Even if the protocol implementations have been suitably optimised, the ranking might still depend significantly on precisely how, and the conditions under which, the evaluation was conducted (e.g. performance overheads due to network delays or inaccurate measurement routines).
Model-based performance evaluation of database replication protocols has been studied by others in the past. For instance, in [1] the authors opt to explicitly model disk, cache, CPU, network and concurrency control. Similarly, the research in [2] is based on modeling CPU, disks, database log disks and network with the aim of evaluating their proposed replication protocol – Database State Machine (DBSM). In [3] the authors scrutinize various assumptions in modelling the performance of single DBMS concur-rency control mechanisms and conclude that different assumptions may lead to “contra-dictory results”. Also, a variety of analytical models for distributed and replicated data-bases have been proposed, e.g. as in the survey [4]. Likewise, a thorough survey and classification of queuing network models for database systems performance is given in [5]. Many models referred to above do not validate the modelling assumptions seriously while, contrastingly, the main contribution of [3] is in demonstrating how building a credible model starts with validating the modelling assumptions; this is the view that we take in this paper. The building of stochastic models that give trustworthy performance evaluation results requires significant effort in model validation. Only then can any ben-efits from model-based evaluation (e.g. cost savings) be taken seriously.
The foregoing suggests that we need a trustworthy, implementation-agnostic, model-based performance evaluation of database replication protocols. We, therefore, put for-ward and rigorously validate a stochastic model for performance evaluation. This model operates at a relatively high level of abstraction, e.g. hardware resources (HW) are not explicitly modelled; we demonstrate how this level of fidelity, which implicitly takes HW resources into account, is appropriate for our aims.
The stochastic model was implemented in the Mobius [6] modelling environment, enhanced with our own code: we created suitably expressive representations of a data-base replication protocol, clients and diverse datadata-base servers using the Stochastic Ac-tivity Network (SAN) [7] formalism. The model and its assumptions were validated (Sect. 5) for a diverse database replication protocol [8] using our implementation of the TPC-C, an industry benchmark for performance evaluation of database servers.
aforementioned server models were calibrated and validated using statistical distribu-tions obtained from experiments with real systems, each experiment consisting of a sin-gle client and a sinsin-gle server. In particular, for each server model, the validation con-sisted of a detailed statistical analysis to check/refute the model assumptions, as well as comparing the distribution of transaction durations observed in experiments with those obtained via simulation. Upon gaining sufficient agreement between experiment and simulation, we used the validated server models in simulating the behavior of the proto-col under 1 client and 5 client loads. We examined how well the simulation results agree with reality, by comparing the transaction duration distributions obtained with those ob-served in real system experiments.
The remaining sections of the paper are as follows. In Sect. 2 we present related work. Sect. 3 describes a stochastic model of a database server operation applicable to a range of database replication protocols, while Sect. 4 explains the model we imple-mented for a particular replication protocol. Using data from real system experiments, in Sect. 5 we present the validation of both the modelling assumptions and the model’s behavior when suitably calibrated. The main simulation results are detailed in Sect.6. Sect.7 is a discussion of the stochastic model approach and the results, and Sect. 8 con-cludes the paper, highlighting future work.
2
Related Work
In addition to the references of “related work” given in the Introduction, we would like to summarise some relevant research on database replication protocols. Database repli-cation has proved a viable method for enhancing both dependability and performance of DBMSs. Performance is typically improved by balancing the load between deployed replicas, while fail-over mechanisms are normally used to re-distribute the load of a failed replica among the operational ones to improve availability.
The common assumption in building database replication protocols is that crashes are the main type of DBMS failures. Under this assumption, using several identical rep-licas (e.g. MS SQL servers) provides appropriate protection. Under this assumption, which is used as the basis for all commercial solutions and most academic ones (e.g. [9]), various performance and scalability improvements are viable. This common belief is, nonetheless, hard to justify – recent research resulted in overwhelming evidence against crash failures being of primary concern [10], [11]. Using the log of known bugs reported for major DBMSs, it was observed that a majority lead to non-crash failures; these failures can be tolerated only by diverse replication. This is why we chose a diverse replication protocol – one of the few we know of – to illustrate our approach to model-based performance evaluation. Our research focuses entirely on performance evaluation and defers dependability modelling, and its impact on performance, for future work. In so doing, the paper studies the best performance achievable by a replication protocol.
3
Stochastic Model of Database Server Operation
3.1 Model of a Database Server
requests to a server in the form of SQL statements for the server to execute, and the server returns the result of each execution to the client. In this way, a server may serve multiple clients, concurrently. Each client establishes a connection (or several may share the same one), via which a series of transactions is executed. Each transaction is a set of serially executed operations (SQL statements). A transaction is completed according to the ACID properties, e.g., it is either committed (all the changes are made permanent) or aborted (all the changes are discarded). In general, transactions are not guaranteed to be committed; there is uncertainty here, from both the client-server system and its envi-ronment, which ultimately determines the transaction’s fate.
According to the TPC-C benchmark, each transaction made by a client belongs to one of 5 types – Delivery,New Order, Order Status, Payment or Stock level. The pro-portions in which each of these types occur are specified and define a probability distri-bution (transaction profile); during simulation, each client determines its next transaction by choosing it according to this distribution. In this way, a random sequence of transac-tions is generated by the clients. These TPC-C transaction types are defined by 34 SQL statement types, each of which can be a SELECT, DELETE, INSERT or UPDATE.
Executing a transaction takes time. Typically, how long a transaction will take is not known beforehand; uncertainty lurks here, as well. The duration is dependent on the nature of the transaction and its constituent statements, the relevant data for the transac-tion, the conditions under which the transaction is executed and the server (including the database state and load). For most applications, a transaction’s duration is well-approx-imated by the sum of its constituent statements’ durations. For a given server executing statements of a given type, the statement durations follow some statistical distribution – one that is adequately approximated by collecting a suitably large sample of such dura-tions from a server deployed on a real system test-bed. As a first pass, we made direct use of these distributions as is, foregoing any attempts to fit them to some member of a yet to be determined theoretical probability distribution family.These distributions are vital for our model. When a server executes a statement during simulation, in order to determine how long this simulated execution will take, a random sampling of an amount of time is made according to the statement’s related statistical distribution (which, im-plicitly, captures HW configuration effects).
So, the time taken for server 𝑖 to execute a given statement type is a random varia-ble, 𝑋𝑖, with distribution function 𝐹𝑖(𝑥𝑖). With n replicas, each statement is modelled by
a random vector, 𝑋1, 𝑋2, … , 𝑋𝑛 . And, a continuous joint distribution function,
𝐹1,2,…,𝑛(𝑥1, 𝑥2, … , 𝑥𝑛), governs the stochastic process of executing the statement on the
𝐹1,2,…,𝑛(𝑥1, 𝑥2, … , 𝑥𝑛) = 𝐹1(𝑥1) … 𝐹𝑛(𝑥𝑛) .
On a related note, the duration, 𝑇, of a transaction on server 𝑖 is the sum of the dura-tions, 𝑋𝑖, 𝑌𝑖 , … , 𝑍𝑖, of its constituent statements and transaction edge operations (begin,
commit and abort). That is, the relationship between these random variables is
𝑇 = 𝑋𝑖+ 𝑌𝑖+ ⋯ + 𝑍𝑖 .
We sought evidence from experiment to suggest plausible relationships between the random variables 𝑇, 𝑋𝑖, 𝑌𝑖 , … , 𝑍𝑖, and found evidence for two relationships: one
indicat-ing how, with an appropriate definition of “fast” and “slow”, fast/slow transactions tend to be comprised of a significant number of fast/slow statements, and another relationship which suggests that those statements in the transaction with significantly larger average durations almost completely determine the transaction speed. As a first pass, we chose to model a gross approximation to both of these two effects in the following way. When a transaction begins, we uniformly sample a number, 𝛼, between 0 and 1, and treat this number as defining the (𝛼 × 100)th-quantile duration for each statement that will even-tually form a part of the transaction. Then, at the point in simulated time when a state-ment duration is sampled, the sampling will either default to using this pre-specified quantile with probability 𝜌, or it won’t with probability 1 − 𝜌. This determines the sam-pled durations for the statements and, thus, the distribution of 𝑇. Here, 𝜌 is a model cal-ibration parameter – with a unique value per server – which gives us two-degrees of freedom to achieve the best fit between measurements and simulation results when cal-ibrating the model.
3.2 Concurrency Control
When serving multiple clients, database servers use various concurrency control schemes to guarantee adequate data consistency, while also striving for the best perfor-mance possible. They handle conflicts between simultaneously executing transactions, which can result in aborting some. Thus, these schemes provide different levels of iso-lation between concurrent transactions. We have chosen to model Snapshot Isoiso-lation (SI) [12] - although not a standardized transaction isolation level, it is offered by many database servers (Oracle, MSSQL, PostgreSQL, etc.) as it improves performance by eliminating conflicts between concurrent readers and writers of the same data items. Modeling the isolation level is also an important characteristic of our approach.
Under SI, the detection and resolution of write-write conflicts – where two or more concurrent transactions attempt to write to the same database item (stored at a logical location) – is of primary importance. Write-write conflicts arise naturally, and at random, in multi-client applications. Consider that, for modelling these conflicts, an explicit no-tion of “database logical locano-tion” is absolutely necessary, but an explicit nono-tion of data at these locations is not! And, even these database locations are only relevant for conflict detection as long as there are concurrent transactions attempting to write to that location. This is very convenient: it allowed us to use a level of abstraction for our model which consisted of choosing (in accordance with TPC-C) a database location to accompany each simulated write statement, and recording this location (for conflict detection on each server) when executing such statements.
profile. For a given database location, if each client independently chooses to execute a transaction that attempts to write to that location, then the probability of a conflict at that location is the product of the probabilities describing each client’s concurrent choice. “When” depends on the order in which the server executes the statements.
3.3 Measures of Interest
Performance measurements are dictated by the specific context. A number of perfor-mance benchmark standards exist for databases (e.g., www.tpc.org). These standards commonly recommend steady-state measures, such as number of transactions per time unit or average transaction duration. TPC-C mandates using the number of New-Order transactions (one of the 5 transaction types defined by the benchmark) per minute. This metric implicitly takes into account all transaction types in the mix, as their individual throughput is controlled by the minimum percentages defined by the standard. Such measures are not constants – they vary over time even for steady-state mode of operation. This variation can be captured by establishing the distribution of the measure. We note here that a TPC-C requirement is to report the 90th percentile of frequency distribution of response times for each transaction type. In our approach, we analysed the distribu-tions of transaction duradistribu-tions.
4
DivRep Replication Protocol and SAN-based Implementation
We demonstrate our approach for stochastic modeling of database replication protocols using DivRep replication protocol [8, 13] as an example.
4.1 The Chosen Database Replication Protocol - DivRep
DivRep is an eager, multi-master replication protocol, implemented as a middleware on top of diverse database servers. It assumes the database servers are configured with SI. Full data replication is performed. Replication is performed at SQL statement level. While replicas execute SQL statements asynchronously inside a transaction, detection of incorrect results failures proceeds in parallel by comparing the results of SQL state-ments produced by diverse database servers. Replica consistency is achieved by execut-ing transaction edge operations “atomically” – the same order of commits and begins is guaranteed on both replicas. This atomicity is achieved using a variant of 2-Phase Com-mit (2PC). DivRep operates with two diverse database replicas configured in a Fault-tolerant node (FT-node).
replica – the one on which the NOWAIT is enabled – while, on the other replica, trans-action blocking will take place in case of write-write conflicts.
4.2 SAN-based Model of Client, Servers and DivRep
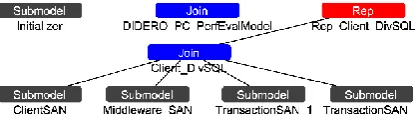
Our performance evaluation is carried out via Monte-Carlo simulation. In creating an application capable of running our simulation campaigns, faithful representations of a TPC-C client, diverse servers configured with SI, and the DivRep protocol, were all realized as atomic SAN models in a Mobius project (Fig. 1. ); for further details see http://openaccess.city.ac.uk/4744/.
Fig. 1.Composed model of Client, Server and DivRep, in Mobius modelling environment.
The client SAN interacts with any of the server SANs (referred to as Transaction-SANs in Fig. 1. ), either directly or through the DivRep SAN. The client generates trans-actions (statements and database location data) according to the TPC-C specification; this is the only source of uncertainty in the client. The DivRep SAN operates determin-istically, coordinating the receipt and forwarding of statements and the results of state-ment executions between the client and a pair of replicas. It does this while ensuring the same order of transaction edges across the replicas and synchronizing the concurrency control actions across the replicas. And, the server SANs themselves are capable of ex-ecuting and coordinating concurrent transaction statements, using NOWAIT and trans-action blocking. The primary sources of uncertainty for these server models are the SQL statement durations.
Each server model takes as inputs empirical distributions of statement durations; ob-tained from real system experiments involving a client and the server, and representing the duration distribution for each TPC-C statement type (34 in total). Together with du-ration distributions for the transaction edges (begin, commit, abort) and the fact that there are two servers, the number of input distributions to the model is 74. While this is a large number of distributions the intention here is that the same distributions will be used for different scenarios – we may vary the number of clients or change the protocol alto-gether. In this sense, the work of collecting the data to parameterize the model is done only once.
[image:8.595.201.409.269.328.2]5
Statistical Analysis and Validation of Modeling Assumptions
5.1 Test Harness for Real System Experimentation
We built a test harness to evaluate the performance of DivRep and inform our model-based approach. It was deployed in a virtualized environment: 3 physical servers (HP ProLiant DL165 G5p) run VMware ESXi v4 hypervisor. Each physical machine de-ploys a set of virtual machines (VMs), which ran either Windows 2008 Server (64 bit), or Linux Fedora Core 11 (64 bit). The client application is our own Java implementation of the TPC-C benchmark. We performed the evaluation using FT-node consisting of 2 open source servers: Firebird (FB), v2.1 and PostgreSQL (PG), v8.4. Each server and the client application run in a separate VM, deployed on a separate physical machine. The servers and the client application run on the Windows OS. Our implementation of DivRep has been executed on a separate VM, which runs FC 11.
We collected detailed logs: transaction durations, SQL statement durations, abort counts etc. The precision for transaction and statement durations is nanoseconds (nsec). We ran several types of experiments. Firstly, we conducted single server experiments without DivRep. The SQL statements’ durations obtained from these experiments were used as input to the model (Sect. 3.1); the distributions of transaction durations were used for model validation (Sect.5.4). They are as follows:
Single FB, 1 TPC-C Client, 100k transactions. We executed 5 repetitions using the same random number generator seed, and ran further repetitions changing the seed value. There are about 2.8 million SQL statements instances in a repetition.
Single PG, 1 TPC-C Client, 100k transactions – analogous ones as for 1FB above. We also ran two types of DivRep experiments, configured with an FT node (1FB, 1PG): i) 1 Client, 100k transactions, and ii) 5 Clients, each executing 20k transactions (100k in total). There were 5 repetitions of each type. The same seeds as for the single server experiments were used. The resulting transaction duration distributions were used for model validation.
5.2 Model Assumptions Validation
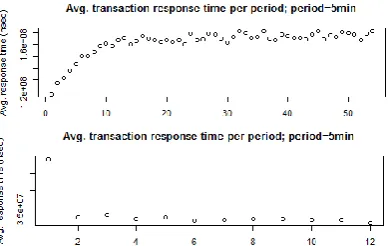
Fig. 2. “Binned averages” graphs for determining Transients period for the experiments: “1FB, 1 Client, 100k transactions” (top) and “1PG, 1 Client, 100k transactions” (bottom)
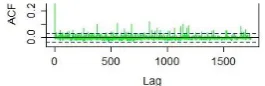
Additional verification of the truncated data representing a steady-state process can be seen from the Autocorrelation function (ACF) graphs of the transaction duration time-series. The maximum lag is roughly half of all the transaction instances observed in our proposed steady state. Fig. 3 shows the ACF graphs of transaction durations for the 1FB and 1PG experiments. The graphs are clearly consistent with that of a purely sta-tionary random process. And, while not strictly applicable, we also ran Augmented Dickey-Fuller (ADF) [14] statistical tests to check if the transaction durations form a stationary process. For both servers, at the 1% significance-level, there was statistically significant evidence to reject the null-hypothesis that the observed processes are non-stationary. The ADF is from a family of so-called unit-root tests; it assumes a certain functional form (a shifted integrated autoregressive process) as a suitable model for the time-series under the null hypothesis. We do not have any reason to believe such a functional form might be applicable here.
Fig. 3. Autocorrelation function (ACF) of the steady-state transaction durations, for the experi-ments: “1FB, 1 Client, 100k transactions” (left) and “1PG, 1 Client, 100k transactions” (right).
[image:10.595.139.452.475.560.2]within those transactions belonging to the steady state. This defines the duration distri-bution, for the statement type on a given server, to be used during simulation.
[image:11.595.230.363.267.310.2]For most statement types during simulation, a statement’s duration on a given server is sampled, independently, according to the statement’s duration distribution. Conse-quently, for the given statement type, the time-series of observed durations for the state-ment is trivially weakly stationary. To attempt to refute this, we sought statistical evi-dence of non-stationarity in the time-series of statement durations from the real-system experiments. However, for our chosen configurations of the servers, the ACF graphs for the time-series showed either no, or negligible, evidence of non-stationary behavior (Fig. 4).
Fig. 4. ACF of Payment 9 statement steady-state durations, “1PG, 1Client, 100k transactions”.
5.3 Correlation of SQL Statements Durations
Are the SQL statement durations correlated across the servers; for instance, does a statement with a long duration on FB imply that the statement will also have a long duration on PG? The same RNG seed value was used when executing either of the single server (1FB or 1PG) experiments under the “1 Client, 100k transactions” load. Since these are single client experiments, the same sequence of database transactions and SQL statements was executed in both. For each of the 34 TPC-C statement types and the transaction edge operations, we calculated the Pearson Correlation Coefficient (CC) between the two servers. The calculation, based on steady-state data, showed no significant correlation: the CC values for SQL statements types were in the range [-0.01, 0.05], while the values for the transaction edges in the range [-0.001, 0.041]; in-deed, a surprising result. Although not a proof of statistical independence, it provides evidence against linearly correlated statement/edges durations, and is consistent with our choice of modelling the statement /transaction edges durations as statistically inde-pendent across two servers (see Sect. 3.1).
5.4 Client-Server System Model Validation
The validation of our model proceeds by simulating the single-client/single-server ex-periments (Sect. 5.1) and comparing the results thereof with experimental observations from the real system. But first, we studied the variability in the real system experiments to determine the extent to which these observations are reproducible.
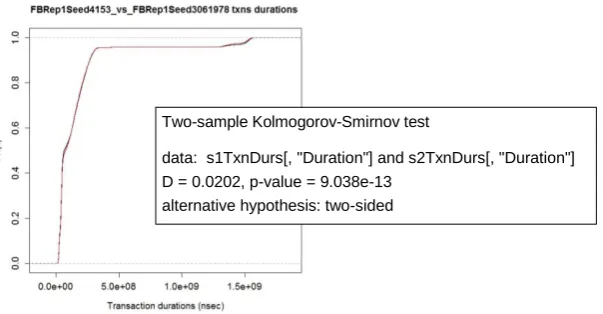
We, however, performed a two-sample, two-sided Kolmogorov-Smirnov (KS) test (see the text box in Fig. 5 for its results) – one of the most general non-parametric tests for checking if two samples are drawn from the same continuous distribution. It is sen-sitive to differences in both location and shape of the ECDFs of the two samples. The test indicated that, at a 1% significance-level, there is statistically significant evidence to reject the hypothesis that the two samples of transaction durations come from the same distribution. Similar surprising results were obtained for other pairs of the 1FB experi-ment with the same or different seed values; this is true for 1PG experiexperi-ment too. The point to note here is that our sample sizes are atypically large, ranging between 65-70K transaction durations in each experiment – this is a veritable “embarrassment of riches”. With so much sample data comes a lot of “tiny deviations between the distributions” evidence, amounting to significant evidence as far as the discriminatory power of the KS test is concerned [15]. To illustrate the unhelpful level of sensitivity at play here, con-sider that the maximum vertical distance between the ECDFs being tested – the D value from the KS test – is 2%; a very small distance indeed. And, the distributions “fared no better” when other statistical tests were applied (e.g. Chi-Square test).
Fig. 5. ECDFs of transaction durations for “1FB, 1C, 100k transactions” experiment. The dark line represents the repetition with the seed 4153; the light-colored line the seed 3061978.
What, therefore, would be the basis of a useful comparison between simulation results and experimental observation, if even repetitions of the same experiment are not guar-anteed to pass a KS test? We chose to compare the distributions using: 1) ECDFs plots, 2) QQ-plots, 3) average transaction durations and 4) the sample standard deviations, all of which give acceptable agreement across experiment repetitions.
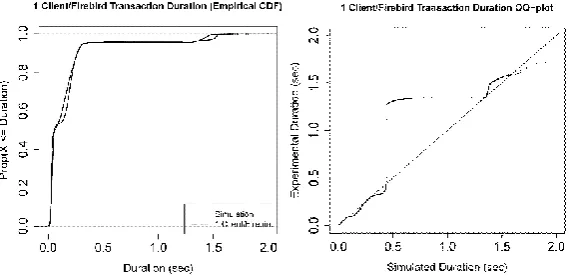
In our simulation campaigns, each simulated run simulates 1 min 40 sec of (steady state) server operation, with a total of 1000 runs per campaign. Our criteria for a suitable number of runs was that the number of statement requests made by a client and the num-ber of statements executed by each server were required to converge with a relative standard error of less than 10%. We simulated a single client interacting with a single FB server, from which we obtained a distribution of transaction durations. This distribu-tion and the corresponding distribudistribu-tion from experiment are plotted in Fig. 6 (left hand side). The close agreement between the distributions, manifested in the plot, is further evidenced by the corresponding QQ-plot (Fig. 6, right hand side); the only noteworthy
Two-sample Kolmogorov-Smirnov test
data: s1TxnDurs[, "Duration"] and s2TxnDurs[, "Duration"] D = 0.0202, p-value = 9.038e-13
deviations between the distributions occur in the upper 2.5% of the distributions. Fur-thermore, the average transaction durations from simulation and experiment are 163 msec and 166 msec, respectively, with related standard deviations of 1.65 sec and 1.75 sec. A similar exercise was carried out for the PG server. Again, the simulation and experiment were in close agreement: the average transaction durations are 46 msec and 44 msec for the simulation and experiments, respectively, with the standard deviations of 1.34 sec and 0.99 sec.
Fig. 6. Comparison of transaction-duration ECDFs (left), and QQ-plot for transaction durations (right), from simulation and a real system experiment of type “1FB, 1C, 100k Transactions”. Similar graphs were obtained for the “1PG, 1C, 100k Transactions” experiment.
6
Results
Having gained sufficient confidence in the model, we simulated a single client interact-ing with 1 FB and 1 PG server via DivRep. The distributions deviated significantly in this case, with the simulated transaction duration distribution having faster durations than its experimental counterpart. The shapes of the distributions, however, were quite similar. This suggested that there might exist a systematic overhead in our experiment. To illustrate the extent of this overhead, we introduced a log-normally distributed over-head in our simulations1, resulting in much better agreement between the simulated and experimental distributions (Fig. 7). The average transaction durations from simulation and experiment are 225 msec and 236 msec, respectively, with related standard devia-tions of 1.21 sec and 1.10 sec.
The conjecture about the overhead is, indeed, plausible: the middleware implement-ing the replication protocol relies on Java RMI (Remote Method Invocation) technology, which is known to introduce significant transport latencies.
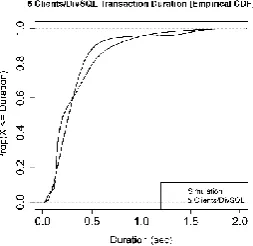
Using this lognormal overhead, we proceeded with a final comparison: simulating 5 clients interacting with the servers via DivRep. The ECDF and QQ-plots illustrate how the deviations in the shapes of the distributions have become more noticeable (Fig. 8). Despite these deviations, the average transaction durations from simulation and experi-ment are 380 msec and 338 msec, respectively, with related standard deviations of 0.836
1 The use of the lognormal distribution is purely illustrative, and not based on this distribution family being
sec and 0.880 sec. Given the size of the standard deviation (more than twice the mean), this indicates that the two averages are remarkably close.
Fig. 7. Comparison of transaction-duration ECDFs (left), and QQ-plot for transaction durations (right), from simulation and a real system experiment of type “DivRep, 1C, 100k Transactions”
Fig. 8. Comparison of transaction-duration ECDFs from simulation and a real system experiment of type “DivRep, 5C, 20k Transaction each”.
7
Discussion
Arguably, model-based performance evaluation of replication protocols is a rather am-bitious premise; there are many reasons to doubt whether it is practical or, indeed, even possible to evaluate a protocol’s performance without actually building and deploying it. For one thing, what would such a performance measure actually mean for a real system? And, certainly, in the process of building an accurate model, one should not be surprised by: i) having to make choices about the level of abstraction (model fidelity) at which to operate; ii) model parameterization of, possibly unknowable, parameters. Even when performance evaluation is conducted on real systems, there are many con-siderations to take into account, such as the accuracy of the measuring methods em-ployed or the generality of the results obtained2. And, yet, it is precisely for all of these
2 We changed the precision of the measurements from msec to nsec, because a significant proportion of the
[image:14.595.242.369.341.464.2]reasons that the results of our studies are not only promising – they suggest that model-based evaluation is feasible – but surprisingly so.
For instance, consider the question of model fidelity. In building our models we ab-stracted away many seemingly important details. Our clients and servers have no ex-plicit notion of detailed data that is manipulated, stored to and retrieved from a data-base; only time-sensitive, sufficiently detailed database locations are generated for the purposes of conflict occurrence and detection. The servers do not have explicit notions of executing the SQL statements. Despite these simplifications the model achieved the correspondence with experiment reported in Sect. 6. These modelling simplifications were made by, first, identifying those sources of uncertainty that are crucial for system performance – such as statement durations, conflict occurrence and the transaction pro-file – and then including only those aspects of the real world that we deemed necessary to adequately represent these uncertainties in our model.
Model parameterization was not daunting. As a first pass, the use of empirical CDFs as direct model inputs meant that we did not have to identify suitable theoretical distri-butions (and their attendant parameters) to approximate these ECDFs. At 74 distribu-tions, this would have been a tedious exercise at best.
A possible advantage of simulation is the speed with which results are obtained. The 1 Client/1 FB experiment took 4hrs 28mins to complete and about 10mins to simulate. The biggest difference was for the 1 Client/DivSQL experiment, which saw the experi-ment complete in 6hrs 35mins, whereas the simulation took about 10mins.
While there is a good agreement between the simulation and experimental results (especially in terms of the averages and standard deviations), the disagreements are also worth noting. For, our current model represents a stylized system in which there are no overheads resulting from, say, the protocol itself or the network between the clients and servers. This means that our validated model gives a distribution which is an estimate of the best performance an implementer of the protocol can hope to achieve, no matter how skilled the implementer is. The usefulness of this bound is in pointing out that any sig-nificant discrepancy between the bound and the performance of a specific protocol im-plementation indicates that the imim-plementation is sub-optimal.
8
Conclusions
We presented a stochastic model for performance evaluation of database replication pro-tocols. An implementation of the model, using a combination of the Mobius modeling environment, its SAN formalism and our own codebase, is presented. The model is cre-ated to be reusable in a variety of scenarios. The model assumptions, and its accuracy with respect to the chosen database replication protocol’s performance, are rigorously validated. The measurements obtained from experiments conducted on a real systems testbed were used to validate the model. For this validation, we used the TPC-C bench-mark – executed in both the model and the real systems testbed.
im-plementation. If the ordering between several replication protocols is driven by imple-mentation overheads, model-based evaluation gives a ranking of the replication proto-cols based on their optimal performance.
We also demonstrated that savings in the model-based evaluation time may be very significant in comparison with the measurements using real systems.
There are a number of ways in which the work can be furthered and the model can be improved. Currently, the model requires a more sophisticated mechanism to account for the effects of a significant increase in client load on server performance. Under a light load, the current server model is one of “infinite resource” [3]. However, under heavy client loads, a realistic mechanism of server resource is essential for modelling the chosen protocol accurately. We have begun experimenting with models of resource, and the validation of their accuracy – to be completed – follows the approach described above for validating the other modelling assumptions. This will include further investi-gation of how the increased load will affect the surprising result that SQL statement durations are uncorrelated across the servers.
We intend to evaluate other replication protocols, e.g. [11,16, 17], to see how well the model behaves.
In Sect. 3.1, we highlighted the fact that the parameter 𝜌 was a “blunt” approach for modeling the more nuanced relationships we observed between transactions and their statements. We expect that implementing algorithms which better approximate these re-lationships will result in even better agreement with experiment.
We also plan to explore the possibility of using the systematic discrepancies between simulated and observed distributions illustrated in the QQ-plots. We are aware that sim-ilar systematic differences between models and respective observations have been used in the past for model re-calibration to improve model accuracy [18].
The model has explanatory power which we would like to improve upon. When sig-nificant overheads are detected by comparing simulation results with experimental ones, a better explanatory distribution for the overheads might be a gamma distribution with parameters dependent on transaction length and transaction statement types.
The research presented in this paper considers a failure free environment. A natural extension would include evaluation of dependability attributes. For example, faults can be injected by an appropriate data corrupting daemon in the experimental testbed, or modeled in the model-based approach. Different likelihoods of crash, non-crash and Byzantine failures can be simulated to perform a number of “what-if” analyses and ob-serve the effects they have on dependability, and performance, of the chosen system.
Acknowledgement
References
1. Sousa, A., et al. Testing the dependability and performance of group communication based database replication protocols. in Proc. of the Int. Conference on Dependable Systems and Networks (DSN 2005). 2005.
2. Pedone, F., R. Guerraoui, and A. Schiper, The Database State Machine Approach. Distributed and Parallel Databases, 2003. 14(1): p. 71-98.
3. Agrawal, R., M.J. Carey, and M. Livny, Concurrency control performance modeling: alternatives and implications. ACM Trans. Database Syst., 1987. 12(4): p. 609-654.
4. Nicola, M. and M. Jarke, Performance Modeling of Distributed and Replicated Databases. IEEE Transactions on Knowledge and Data Engineering, 2000. 12(4): p. 645-672
5. Osman, R. and W.J. Knottenbelt, Database system performance evaluation models: A survey.
Performance Evaluation, 2012. 69(10): p. 471-493.
6. Graham, C., et al. The Möbius Modeling Tool. in Ninth International Workshop on Petri Nets and Performance Models (PNPM '01). 2001. Aachen, Germany.
7. Sanders, W.H. and J.F. Meyer, Stochastic activity networks: formal definitions and concepts, in Lectures on formal methods and performance analysis. 2002, Springer-Verlag. p. 315-343.
8. Popov, P. and V. Stankovic, Improvements Relating to Database Replication, EPO, Editor. 2013, City University London: EU. p. 60.
9. Cecchet, E., J. Marguerite, and W. Zwaenepoel. C-JDBC: Flexible database clustering middleware. in
USENIX Annual Technical Conference, Freenix. 2004.
10. Gashi, I., P. Popov, and L. Strigini, Fault tolerance via diversity for off-the-shelf products: a study with SQL database servers. IEEE Transactions on Dependable and Secure Computing, 2007. 4(4): p. 280-294
11. Vandiver, B., et al., Tolerating byzantine faults in transaction processing systems using commit barrier scheduling, in Proceedings of 21st ACM SIGOPS Symposium on Operating Systems Principles. 2007, ACM: Stevenson, Washington, USA. p. 59-72.
12. Berenson, H., et al. A Critique of ANSI SQL Isolation Levels. in SIGMOD International Conference on Management of Data. 1995. San Jose, California, United States: ACM Press New York, NY, USA. 13. Stankovic, V., Performance Implications of Using Diverse Redundancy for Database Replication, in
Centre for Software Reliability. 2008, City University London: London. p. 169. 14. Fuller, W.A., Introduction to Statistical Time Series. 1996: Wiley.
15. Osborne, J.W., Best practices in data cleaning: A Complete Guide to Everything You Need to Do Before and After Collecting Your Data. 2012: Sage Publishing: Thousand Oaks, CA.
16. Garcia, R., R. Rodrigues, and N. Preguica, Efficient middleware for byzantine fault tolerant database replication, in Proceedings of the sixth conference on Computer systems (EuroSys '11). 2011, ACM: Salzburg, Austria. p. 107-122.
17. Vandiver, B., Detecting and Tolerating Byzantine Faults in Database Systems, in Programming Methodology Group. 2008, Massachusetts Institute of Technology: Boston. p. 176.