City, University of London Institutional Repository
Citation
:
Kirmse, C. & Brücker, C. (2014). On the jet formation through a leaky glottis. Journal of Fluids and Structures, 50, pp. 137-152. doi: 10.1016/j.jfluidstructs.2014.06.022This is the submitted version of the paper.
This version of the publication may differ from the final published
version.
Permanent repository link:
http://openaccess.city.ac.uk/16748/Link to published version
:
http://dx.doi.org/10.1016/j.jfluidstructs.2014.06.022Copyright and reuse:
City Research Online aims to make research
outputs of City, University of London available to a wider audience.
Copyright and Moral Rights remain with the author(s) and/or copyright
holders. URLs from City Research Online may be freely distributed and
linked to.
City Research Online: http://openaccess.city.ac.uk/ [email protected]
On the jet formation through a leaky glottis
Clemens Kirmsea,∗, Christoph Br¨uckera
aInst. of Mechanics and Fluid Dynamics, Chair of Fluid Mechanics and Fluid
Machinery, Technische Universit¨at Bergakademie Freiberg, Lampadiusstr. 4, 09596 Freiberg, Germany
Abstract
The present experimental study aims at analyzing the jet formation of the glottal jet flow using a model of a leaky glottis. Experiments were performed in a flow channel with dynamic models of the vocal folds in order to measure the glottal waveform and the velocity distribution in the supraglottal region using High Speed Particle Image Velocimetry (HSPIV). Proper Orthogonal Decomposition (POD) of the vortex Q-criterion was performed in order to de-tect the energetically most significant large-scale vortex structures and their appearance in the jet flow. The spectral analysis of the glottal waveforms results in an increased spectral decay with more prominent peaks at higher frequencies in the case of a leaky glottis compared to a completely closing reference case. Vortex induced fluctuation frequencies have similar spectral content in both cases as they appear as trains of vortex packets in a regular manner over the glottal cycle. However, when removing the false vocal folds in the leaky glottis model, coherence of vortex generation is lost over the motion cycle. Thus, the presence of the false vocal folds retains most of the vortex induced characteristics in the source spectrum even when the vocal folds do not close fully.
Keywords: Leaky glottis, glottal jet formation, source spectrum, vortex shedding
∗Corresponding author
1. Introduction
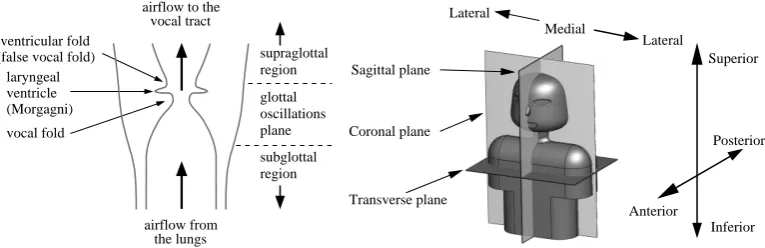
Investigations of the characteristic flow field downstream of the glottis are an important step towards understanding human voice production and speech quality. Our voice is the result of a complex interaction of different processes in the larynx: An airflow from the lungs forces the adducted vocal folds to open a gap and a glottal jet flows through the supraglottal region, Fig. 1. The opening of the glottis due to the gap reduces the air pressure of the lungs and the laryngeal muscles force the vocal folds to close the gap. This process repeats and the flow-induced vibrations of the vocal folds generate a pulsatile glottal jet with a significant sound spectrum.
Inferior Sagittal plane Medial Lateral Lateral Anterior Posterior Superior Transverse plane Coronal plane oscillations plane subglottal region glottal supraglottal region airflow from vocal tract airflow to the
vocal fold ventricle laryngeal
(Morgagni) (false vocal fold)
ventricular fold
[image:3.595.113.496.293.417.2]the lungs
Figure 1: Sectional view of the human larynx (left) and definition of physiological data planes by Mittal et al. (2013) (right)
Besides the normal speech production in the healthy case at least 20% of the human population develop a voice production disorder, Mittal et al. (2011). One of these disorders is characterized by an incomplete clottal closure which is comparable with a leaky valve. The investigation of the differences between complete and leaky glottal closure is the motivation of the present study.
frequency spectrum; (2) increased tilt of the glottal spectrum at higher fre-quencies; and (3) appearance of a turbulence noise source near the glottis with considerable spectral amplitudes, B˚aveg˚ard and Fant (1994), Hanson (1997) and Chen et al. (2011).
There have been few quantitative investigations of the acoustic conse-quences of glottal leakage: The influence of an incomplete closure of the vocal folds during speech production has been examined by Cranen and Schroeter (1995, 1996) by means of a computer simulation. They analyzed the changes of the glottal waveform due to leakage caused by two different types of leaks: a linked leak (triangular chink at one side of the glottis) caused by abduction and a parallel chink (rectangular chink between the vocal folds) in addition to the time-varying glottal gap. The spectra of the derivative waveforms show a major difference in their spectral slopes: In the case of a parallel chink, the slope is similar to the case without leakage. In the case of a linked leak, the slope decays more rapidly.
More recently, Park and Mongeau (2008) investigated the influence of a posterior gap on glottal flow and sound production experimentally. They used a driven air model with a vibrating orifice. For simulation of the vocal tract a confinement was added. Models of the ventricular folds were not applied. Due to the posterior gap they found an increase of the broadband radiated sound pressure level at higher frequencies within the human fre-quency range. The energetic source of this jet noise is turbulent fluid motion within the supraglottal region.
The last decade saw the publication of several studies on the influence of vortical structures in the glottal jet flow on speech production. Numerical investigations were carried out for example by Zhao et al. (2002), Zhang et al. (2002a), Hor´a˘cek and ˘Svec (2002), Hor´a˘cek et al. (2005), Krane (2005), Suh and Frankel (2007), Chouly et al. (2008), Mihaescu et al. (2010), Zheng et al. (2011) and Smith and Thomson (2013). Experiments were performed for example by Zhang et al. (2002b, 2004); Zhang and Mongeau (2006); Zhang and Neubauer (2010), Krane et al. (2007), Neubauer et al. (2007) and Khosla et al. (2007, 2008a,b, 2009). A comprehensive summary of the state of knowledge about the fluid dynamics of human speech production was published by Mittal et al. (2013).
Following is a very short explanation of the main sound sources:
2. Vortical structures develop within the intraglottal and supraglottal re-gion of the vocal tract due to Kelvin-Helmholtz instabilities along the shear layer of the glottal jet. These structures can change the trajec-tory of the jet, e.g. by interaction with geometrical structures in the supraglottal region. This unsteady vortex shedding produces dipole sources with the greatest strength of all sources, Mittal et al. (2013). 3. Quadrupole sound sources exist and are determined by turbulent
mo-tion of the glottal flow, Zhao et al. (2002), Zhang et al. (2002b) and Mittal et al. (2013).
This paper describes experimental investigations of the hydrodynamic sound sources of a leaky glottis model in comparison to a completely closing glottis model. Both models were investigated with and without models of the ventricular folds. This led to an increase of the data volume, but the presence of ventricular folds in the supraglottal space is still subject of con-troversial discussion about their importance and relevance for human voice and speech quality, Alipour and Karnell (2013) and Farahani et al. (2013). Even in surgical treatments of pathological voice disorders there is still no clear answer to what extend and if any a resection of the false vocal folds changes the behavior of the vocal folds. Thus it is also not studied how far a leaky glottis as a typical disorder is affected when the false vocal folds are removed. This is a question of great physical interest from a fluid-interaction point of view and therapeutically relevance. Therefore we studied the leaky glottis in two experiments, the first in the natural situation with false vocal folds and compared those results with the case after resection.
The used method was an analysis of the vortex induced source spectra of the glottal jet flows through the models in a pressure driven water duct. The experimental investigations were performed using High Speed Particle Image Velocimetry (HSPIV) and the snapshot method of Proper Orthogonal Decomposition (POD), Triep et al. (2005); Triep and Br¨ucker (2010) and Kirmse et al. (2010). Furthermore, the glottal waveform was measured opti-cally with high accuracy using the displacement of a neutrally buoyant disc in a pipe. Moreover, the spectra of the derivative of the glottal waveform and the spectral content of the vortex sound sources were calculated.
2. Experimental set-up and methods
de-the larynx and dynamically-driven cam models of de-the vocal folds, Triep and Br¨ucker (2010); Triep et al. (2011). The most important advantage of such a mechanical model is the high reproducibility of the boundary conditions of the flow (e.g. fundamental frequency and pressure head). Its disadvantage is the unidirectional fluid-structure interaction between the models of the vocal folds and the flow. Therefore, detailed investigations of the glottal jet development, which is very close to the vocal folds, may differ from the real human situation.
Contrary to the human glottal configuration the characteristic lengths of the models were scaled up by a factor of three and the fluid medium was water. Thus, the length of the glottal gap of the vocal fold model was
L= 48 mm. Consequently, due to larger scale and different fluid properties, the flow velocity decreases when maintaining flow similarity. This allowed a higher temporal resolution of the measurements. Based on typical values for the flow and oscillation frequency of the vocal folds, Pelorson et al. (1994), the characteristic parameters of the model flow (index ”M”) and the life-size flow (index ”H”) are related as follows:
Mean flow velocity uM =uH/45≈1 m/s
Transglottal pressure difference ∆pM = ∆pH/2≈300 Pa
Fundamental frequency fM0 =fH0/135≈1 Hz
Length of the glottal gap LM = 3LH ≈48 mm
Maximum width of the fully open gap WM = 3WH ≈4 mm
Besides geometric similarity, the relevant dimensionless numbers are sim-ilar (νM is the kinematic viscosity of water, cM is the velocity of sound in
water):
Reynolds number ReM =uMWM/νM ≈O(103)≈ReH
Strouhal number SrM =fM0WM/uM ≈O(10−
2)≈Sr
H
Mach number M aM =uM/cM ≈O(10−3)< M aH ≈O(10−1)
3d cam covered
orifice (glottis)
bearing modeled ventricular folds Perspex shell filled with water
jet
with silicone membrane
min. −2 max. 2 (0,0)
7
x [mm] y [mm]
−30
12 28 60
30
[image:7.595.110.497.129.303.2]−7
Figure 2: View of the cam model shaping the vocal folds and the transparent model of the ventricular folds and a sketch of the geometry of the investigated region within the 3.0 times scaled-up duct model of the larynx. The maximum width of the fully open gap of the vocal folds was 4 mm.
Howe and McGowan (2009) and Howe and McGowan (2012). Hence, these studies in the water model can help to identify the location and spectral dis-tribution of the sound sources using HSPIV. However, the model is not able to replicate any sound propagation in a realistic manner which is not aimed within this study.
2.1. Cam model of the vocal folds
The mechanical model of the vocal folds consisted of two counter-rotating 3-D shaped driven cams. Each cam was covered with a stretched silicone membrane. The rotation of the cams driven by a stepper motor resulted in a time-varying motion with specific profiles of the glottal orifice and waveform of the glottal cycle. The model of the ventricular folds consisted of a rigid Perspex shell filled with water. Fig. 2 shows an image of the model and the geometry of the investigated region within the rectangular duct.
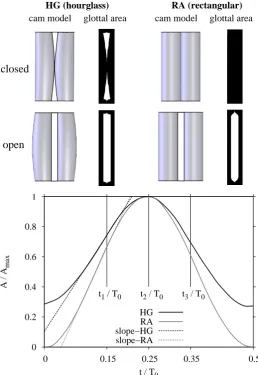
through the glottis is not influenced by this supraglottal constriction. The second is a simplified model of a leaky glottis with an incomplete closure due to triangle-shaped gaps at both ends of the cams. For comparison with the reference case, the areas of both fully open gaps match. The leaky case is characterized as ”hourglass” and in the following referred to as ”HG(+)” if the ventricular folds have been used and otherwise as ”HG(–)”, Dejonckere et al. (2001) and Yang et al. (2011). The upper part of Fig. 3 sketches the shapes of the cams and the glottal gaps of the investigated cases.
The normalized glottal area functions of the cam models were measured optically as a function of time and are shown in the lower part of Fig. 3. A digital high-speed camera PHOTRON FASTCAM APX-RS was used to record the glottal area using transmitted light of a light bulb. By means of image processing the areas were calculated. For each case the maximum glottal area Amax is used for normalization. The open quotient of the glottal
cycle is 50% in the RA case, the HG cams are also open in the second half of the cycle time with an area of 28% of the maximum. A comparison of the slopes of the glottal area functions shows that theslope-HG= 4.27 is smaller than theslope-RA= 6.03 during the opening phase and correspondingly also during the closing phase. Thus, the rate of change of the glottal area is smaller in the HG case than in the RA case, which directly affects the slopes of the flow rates as will be discussed in Section 3.2. The cam speed and thus the fundamental frequency for both models was set at 1 Hz.
2.2. Flow facility
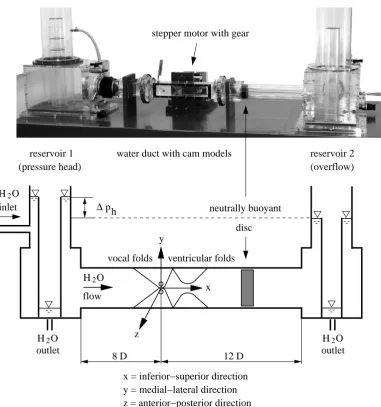
Fig. 4 sketches the flow facility with the D x D x 20D straight water duct (D = 6 cm) as test section. The columns at both ends of the test section were used for imposing a constant pressure head ∆ph. The flow was
continuously circulated from the downstream reservoir 2 to the upstream reservoir 1 by a water pump. The length of the inner pipe of reservoir 1 fixed the pressure head. All components of the duct were made of Perspex, which allowed an optical access to the measurement planes. The point of origin was determined in the middle of the cross-section area of the glottis. At this position the distances to the columns were 8D in the subglottal and 12D
0 0.2 0.4 0.6 0.8 1
0 0.15 0.25 0.35 0.5
A / A
max
t / T0
t1 / T0 t2 / T0 t3 / T0
HG RA slope−HG slope−RA
open closed
HG (hourglass) RA (rectangular)
[image:9.595.114.373.168.544.2]cam model glottal area cam model glottal area
Figure 3: Shapes of the cams, images of the glottal area of the investigated hourglass (HG) and rectangular (RA) model and normalized glottal area functions of the cam models. The reference labels t1/T0, t2/T0 andt3/T0 show the instants during which the flow pictures
H O2
H O2
H O2 outlet
H O2 outlet y
reservoir 1 reservoir 2
(overflow) (pressure head)
neutrally buoyant
disc stepper motor with gear
water duct with cam models
∆p h
vocal folds ventricular folds
x
z
8 D 12 D
x = inferior−superior direction y = medial−lateral direction z = anterior−posterior direction inlet
[image:10.595.114.496.172.580.2]flow
2.3. Experimental methods 2.3.1. Flow rate measurement
A round neutrally buoyant disk was arranged within a round Perspex tube downstream of the vocal fold model at a distance of x = 5D. The diameter of the disk was 1 mm less than the inner diameter of the tube. During the opening phase of the vocal fold model, the emerging jet induced a flow profile, which was transformed to a block profile in front of the disk. Therefore, the disk moved along the tube because of the transported mass flow through the open glottis. Due to the incompressibility of the used fluid (water), temporal or quantitative differences between the flow rate near the glottis and at the disk do not exist.
The displacement of the disk was recorded with a digital high-speed camera PHOTRON FASTCAM APX-RS (Photron Inc., San Diego, CA, 1024 x 1024 pixels), at a frame rate of 250 fps. The position of the lead-ing edge was localized by image processlead-ing in each image of the disk. The time series of these positions were differentiated in order to obtain the in-stantaneous velocity averaged over the flow profile. This velocity multiplied by the inner tube area resulted in the time series of the flow rate. With an uncertainty of measurement of one pixel at the edge localization, the relative uncertainty of the flow rate was smaller than 1 %.
2.3.2. Visualization of the glottal flow
The visualizations of the glottal flows were performed by homogeneously injecting fluorescent Rhodamine dye into the supraglottal region of the duct. The dye-free fluid passing the glottis became visible in the emerging jet due to illumination by means of a laser light sheet with high contrast. This light sheet was generated by a PEGASUS-PIV dual-head, high repetition rate Nd:YLF laser (New Wave Research Inc., Fremont, CA) and a light sheet optics (Dantec Dynamics A/S, Denmark). The high-speed camera PHOTRON FASTCAM APX-RS was used to record the frames with a frame rate of 250 fps and an exposure time of 0.2 ms for each frame.
2.3.3. Flow velocity measurement using High Speed Particle Image Velocime-try
Software” (Dantec Dynamics A/S, Denmark). This software was also ap-plied to calculate the flow velocity and the Q-criterion for vortex identifica-tion, Proch´azka and Uruba (2011). Tracer particles with a mean diameter of 20µm were used for seeding the fluid.
The measurements were performed at the xy-plane downstream of the glottis within a quadratic region of length D as sketched in Fig. 2. The total duration of the measurements for each case was three consecutive glottal cycles with a temporal resolution of T0/250 = 4 ms per double exposure of the frames. The time between the laser pulses was 200µs. The correlation analysis was performed using an interrogation area size of 32 x 32 pixels with a fixed overlap of 50 %. Thus, the spatial resolution of the correlation analysis was 0.01D.
3. Results
3.1. Visualization of the glottal flow through the model of the leaky glottis
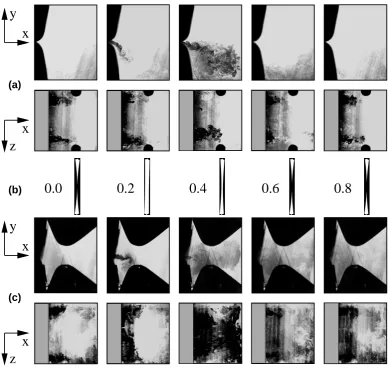
The glottal flow through a leaky glottis can be described as the super-position of a continuous leakage flow with a pulsating jet. This produces a continuous mixture of the two flows in the supraglottal region and yields a strong three-dimensional flow structure. Fig. 5 illustrates this behavior with photographs of the flow through the model of the leaky glottis visualized by injected fluorescent Rhodamine dye during one glottal cycle. The pho-tographs were taken at the xy- and xz-plane in the middle of the duct. For lack of space only an abbreviated image series is shown here. However, the characteristic of the leakage flow through the HG model can be distinguished clearly.
The images of the flow in the HG(–) case show that, at the xy-plane, the emerging jet is deflected in the direction of the wall during the opening period of the glottal cycle (at t/T0 = 0.2 and t/T0 = 0.4 exemplarily). At the xz-plane, there are two smaller jets with similar penetration length at both edges of the glottal gap during the complete glottal cycle. Except for some fluctuations, the intensity of the jets remains nearly constant. These jets result from the triangle-shaped gaps of the leaky HG configuration of the cams. Due to its deflection, the central jet is difficult to see in the xz-plane on the images at t/T0 = 0.2 and t/T0 = 0.4, because it is located outside of the illuminating light sheet.
x
x
z
y
0.0
0.2
0.4
0.6
0.8
x
x
z
y
(a)
(b)
[image:13.595.110.501.184.553.2](c)
Figure 5: Photographs of the glottal flow through the model of the leaky glottis visualized by injected fluorescent Rhodamine dye: (a) HG(–) at the xy- and xz-plane (respective middle cross-section), (b) exposure timet/T0 and images of the glottal area, (c) HG(+)
to the two small jets at the edges of the glottal gap, the development of the central jet is now visible at the xz-plane. The image shows a span-wise jet contraction, which indicates the appearance of axis switching at t/T0 = 0.4, Triep and Br¨ucker (2010). Overall, the observation indicates that the false vocal folds straighten the jet although the leakage adds larger instabilities in the supraglottal space compared to the case with full glottal closure.
3.2. Change of the glottal waveform
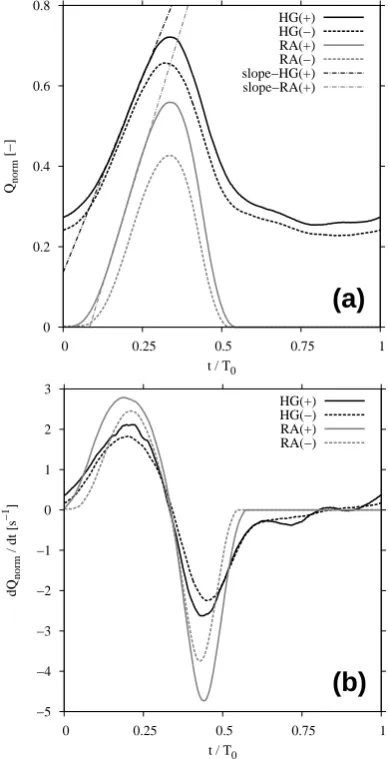
Fig. 6 (a) shows the normalized phase-averaged values of the measured flow rates (glottal waveforms) Qnorm. The time axis is normalized with the
cycle time T0 and the flow rate axis with the lossless flow rate through the maximal open glottis Qmax = Amax
√
2 ∆ph/ϱ with the area of the open
glottis Amax, the pressure head ∆ph, and the fluid density ϱ. The skewing
quotient is 1.78 for the HG(–) case and 2.13 for the other cases.
The time histories of the normalized flow rates are mainly determined by the glottal area functions of the vocal fold models. Consequently, the ratio of the slopes of the flow rates slope-HG(+)= 1.94 andslope-RA(+)= 2.58 in Fig. 6 (a) is approximately equivalent to the ratio of the slopes of the glottal area functions slope-HG and slope-RA in Fig. 3.
A steeper slope of the glottal area function leads to an increased acceler-ation of the fluid mass, which yields lower maximum flow rates due to inertia of the accelerated fluid column in the vocal tract. Therefore, peak flow rates are higher in the case of leakage than in the case of a closing glottis. A further increase of the flow rate is caused by the diffuser effect of the ventric-ular folds. It minimizes the development of large recirculation flows in the supraglottal region and thus reduces the pressure loss. In the HG case this effect is smaller because the driving force is split and acts on a steady and an unsteady part of the fluid flow.
Zheng et al. (2009) discussed the relation of the unsteady flow rate (vol-ume velocity) through the glottis to the sound produced during the phonation cycles. Based on theoretical studies it is deduced that the amplitude of the monopole source term of the sound sources is mainly determined by the fluid acceleration, Zhang et al. (2002b) and Zhang et al. (2002a). An increase of the acceleration means an enlarged time-rate of change of the flow rate
dQnorm/dt. The latter quantity is plotted for all cases in Fig. 6 (b). The plot
shows a considerable increase of dQnorm/dt of the rectangular glottal model
0 0.2 0.4 0.6 0.8
0 0.25 0.5 0.75 1 Qnorm
[−]
t / T0
HG(+) HG(−) RA(+) RA(−) slope−HG(+) slope−RA(+)
−5 −4 −3 −2 −1 0 1 2 3
0 0.25 0.5 0.75 1
dQ
norm
/ dt [s
−1
]
t / T0
HG(+) HG(−) RA(+) RA(−)
(b)
(a)
Figure 6: (a) Normalized phase-averaged flow rates (discharge coefficients)Qnorm of the
[image:15.595.146.341.181.561.2]-90 -80 -70 -60 -50 -40 -30 -20 -10 0
0 10 20 30 40 50
normalized amplitude [dB]
f / f0
HG(+) HG(-) -90 -80 -70 -60 -50 -40 -30 -20 -10 0
0 10 20 30 40 50
normalized amplitude [dB]
f / f0
[image:16.595.119.481.118.389.2]RA(+) RA(-)
Figure 7: Envelope of the normalized amplitude spectra of the mean glottal flow rates derived with respect to time. The abscissa is the frequency normalized with the base oscillation f0 = 1 Hz of the vocal folds. The amplitude spectra are normalized with the
maximum amplitude of the RA(+) case.
elevated values compared to the cases without them. Consequently, an es-timation of the resulting sound pressure of real glottal configurations yields an increase due to the ventricular folds.
The first time derivatives were computed from the normalized flow rates of Fig. 6 (a), followed by a spectral analysis by FFT. The amplitude spectra were normalized with respect to the maximum amplitude of the RA(+) case. Fig. 7 shows the envelopes of the normalized amplitude spectra of the four cases. These spectra are typically used to determine the source spectrum via inverse filtering, see e.g. Cranen and Schroeter (1995) and Hanson (1997).
on the spectral distribution in the case of the rectangular glottis. However, they have a clear influence in the case of the leaky glottis. As seen in Fig. 7 on the left-hand side, the false vocal folds lead to a distinct elevation of the harmonic part of the spectrum of about 10 dB. These spectra drawn from experimental data are in good qualitative agreement with the spectral results of the simulation by Cranen and Schroeter (1995).
3.3. Instantaneous quantities of the flow field
The program ”DynamicStudio Software” (Dantec Dynamics A/S, Den-mark) was used for the data analysis of the HSPIV measurements. Fig. 8 to Fig. 10 show exemplary results of the instantaneous flow field of one glot-tal cycle in comparison with previous visualizations. The acquisition times were selected at three different points of the glottal cycle relative to the cy-cle time T0 = 1 s: During the opening phase of the glottis at t1/T0 = 0.15, at the maximum opening at t2/T0 = 0.25, and during the closing phase at
t3/T0 = 0.35.
0.15
HG(+)
HG(−)
RA(+)
RA(−)
velocity
[image:18.595.116.500.158.611.2]visual
vorticity
0.25
RA(−)
RA(+)
HG(−)
[image:19.595.116.500.170.602.2]HG(+)
0.35
RA(−)
RA(+)
HG(−)
[image:20.595.114.501.171.605.2]HG(+)
The jets emerge out of the glottal gap at t1/T0 = 0.15. Already at this early stage of the jet development, deflections are visible in the cases without the ventricular folds. The other cases show a nearly axially symmetrical be-havior along the midline. There is a high similarity between the visualization pictures and the vector plots of the jet core contours. The influence of estab-lished recirculation regions is noticeable particularly in the cases without the ventricular folds. The maxima of the vorticity are located around the core of the jets in the shear layer region.
The glottal gaps are fully open at t2/T0 = 0.25. In the cases without the ventricular folds strong jet deflections appear. Again, the velocity fields show the influence of large recirculation regions, which force the jet to change its flow direction towards the wall of the duct. In the cases with ventricular folds the jets are directed through the gap between the ventricular folds with the tendency to attach to one of them. Along the jets the vorticity is increased and coherent structures become clearly visible.
The glottal gaps are in the closing phase of the cycle and the jet velocities attain their maxima att3/T0 = 0.35. The jets attach to the wall in the cases without the ventricular folds at nearly x = D/2 from the glottis. In the other cases the main part of the jet flow passes through the gap between the ventricular folds. Due to small deviations from the middle axis, they attach asymmetrically to one of the ventricular folds. It is important to note the influence of the false vocal folds on the jet flow in the case of the leaky glottis. The overall flow pattern is very similar to the ones when the glottis performs a full closure. Thus, the leakage jet does seemingly not disturb the major structure of the central jet much.
To clarify the effect of recirculation flows on the jet formation in the leaky cases, Fig. 11 shows exemplarily the visualized jets and the corresponding but not scaled velocity fields at the time t/T0 = 0.35. For the sake of clarity only
each other velocity vector is shown. The third figure shows the distribution of the Q-criterion. The second invariant Q of the velocity gradient matrix is a measure for the detection of vortical structures. Its value is positive in vorticity-dominated regions of the flow and the maximum position indicates the location of a vortex core, Carmer et al. (2008).
HG(+) HG(−)
rotating recirculation flows within the ventricles of Morgagni. The ideal case is a symmetrical configuration around the middle axis. In this example, small local differences cause a minimal deviation of the jet. But in connection with the constriction due to the ventricular folds these small recirculation flows stabilize the jet near the axis. The distribution of the vortices represented by the Q-criterion corresponds approximately to the large-scale coherent vortex structures in Fig. 13. This will be discussed in section 3.4.
In this study the values of the Q-criterion were obtained from 2D HSPIV measurements in the middle plane of the duct. However, the flow is spatial. The experiments were performed by using the geometry of the rectangular glottal gap as the base, which is moving at the end of the motion cycle in the reference case to a full closure and in the leaky case leaving some gaps at both ends of the model. Mattheus and Br¨ucker (2011) showed that such a rectangular glottal gap (slit-like gap) produces vortex trains with rod-like structures that are mostly aligned in lengthwise direction of the folds, Fig. 12. The middle plane data of the Q-criterion therefore represent the major axes of the vortex structures, where the 2D Q-field in the cross-sectional middle plane let recognize clearly the centers of the 3D vortex cores shown on the left-hand side of the figure. This justifies the validity of the Q-criterion measured with PIV in the middle plane of the used model to localize the cores of the vortex structures in the vortex trains.
3.4. Spectral content of the vortex induced fluctuations
Vortex induced noise due to vortex shedding is one part of the sound produced by the unsteady flow during phonation. Generally, the unsteady motion of vortices generates sound waves in low Mach number flows, M¨uller and Obermeier (1988) and Kambe (2010). The Mach number of the human glottal flow is M aH ≈O(10−1), in the water model this number decreases to
M a≈O(10−3). Therefore, the spectral contribution to the sound generated by vortex shedding of the investigated glottal models can be performed.
3D
0.25
[image:24.595.111.502.253.489.2]0.375
2D
Figure 12: Vortical structures visualized by iso-value of Q-criterion (iso-value = 2000) at t/T0 = 0.25 and t/T0 = 0.375 for the simulation runs with 3D slit-like constriction and
large-scale coherent vortex structures of the flow field. Clearly structured trains of vortices appear in the third POD modes of all investigated cases which are shown in Fig. 13.
The contribution of these rows of vortices to the spectral content of the vortex sound sources can be estimated as follows: The distance in x-direction between two vortex cores in the eigenmodes is defined as the typical wave-lengthλof the vortex structure. If the convection velocityUc of this structure
is known, the vortex shedding frequency fv is determined by fc =Uc/λ.
For validation of these results it is possible to determine the characteristic frequencies in an alternative manner. Therefore, we compared the signal of the characteristic frequency of the vortex trains from different sources and found no grave differences. First we tested the convective velocity of such a wave-train from the auto-correlation of the velocity signal at a certain monitor point at x/D=0.7, y/D=0, Triep et al. (2005). Another probe was taken from the vorticity field. Both methods gave similar results regarding the shedding frequency when positioned along the centers of the vortex cores. But the results were affected by local variations in the quality of the measure-ment results when the probe location was changed. Therefore, a method was used to obtain the characteristic shedding frequency from a more extended spatial representation of the vortex trains. This is achieved using the POD analysis which gives us the wavelength of the vortex trains represented by the most dominant mode in the Q-field. A cross-check of the final results with the spectral analysis of the velocity and vorticity probe at selected locations of the vortex paths proved indeed the agreement in the results. The POD analysis however gives a much better visual impression of the periodicity in the vortex trains and is therefore chosen herein to present the results.
A method for quantifying the degree of accordance of the data of the eigenmode and the snapshots of the Q-criterion provides the calculation of the projection or relevance index, Chen et al. (2012b). This index R is obtained by projecting the field of the POD mode QP onto the fields of the
snapshots of the Q-criterion Qi:
R= (QP,Qi)
∥QP∥ ∥Qi∥
The numerator is the sum of the dot products and ∥ · ∥ denotes the l2
HG(+)
RA(+)
RA(−)
[image:26.595.114.498.194.581.2]HG(−)
0.6 0.8 1
0.2 0.3 0.4 0.5 0.6
Rnorm
t / T0 HG(+) HG(−)
0.6 0.8 1
0.2 0.3 0.4 0.5 0.6
Rnorm
[image:27.595.116.486.120.388.2]t / T0 RA(+) RA(−)
Figure 14: Normalized projection indexRnormas a measure of the accordance between the
3. POD mode and the snapshots of the Q-criterion, where the normalization is performed with the respective maxima of the cases with ventricular folds.
Each maximum of the curves gives the instant of time where the formation of the vortex train denotes maximal accordance with the respective pattern of the 3. POD mode. The convection velocity is then obtained by using the displacement of the Q values at two sequenced snapshots at these instants of time and multiplying those with the frame rate of the HSPIV measurement.
indicates that the coherence of vortex row formation and its influence on the spectral content of the leaky HG(–) case is small compared to the others. On the other hand, the presence of ventricular folds in a leaky glottis retains nearly the same vortex row coherence as a glottis performing a full closure.
Using this analysis, the average normalized vortex shedding frequencies of the investigated cases, where the normalization was made with the funda-mental frequency f0, are as follows:
Case fv/f0
HG(+) 20.90
HG(–) 25.56
RA(+) 23.13
RA(–) 27.60
The energetically most significant trains of vortices (dipole sources) pro-duce sound within the frequency region of fv/f0 ≈ 20. . .28 . But there is a significant difference between the cases with and without the ventricular folds: The average values of the cases HG(+) and RA(+) are in the region of
fv/f0 ≈20. . .23 . For the cases HG(–) and RA(–) these values increase and are arranged in the region offv/f0 ≈25. . .28 . The impact of the ventricular folds on the dipole source spectrum consists in an average reduction in the
fv/f0 ratio of approximately 5.
4. Conclusions
This study aimed at experimentally investigating the glottal jet flow through an enlarged dynamic model of the human vocal folds in order to examine the influence of a leaky glottis on glottal jet formation and hydro-dynamic source spectrum. Four different configurations of the glottal tract were used: Two models of the vocal folds of different glottis closure types, each of them both with and without an implementation of the ventricular folds in the supraglottal space. The leaky glottis was represented by a vocal fold model of the hourglass closure type (HG). This was compared to a ref-erence case using a second vocal fold model of the rectangular closure type (RA). The latter is completely closed during the second half of the glottal cycle (OQ= 50 %) while the former leaves some anterior/posterior gaps open in this phase, which consequently leads to a leakage flow.
field in the supraglottal region. A POD analysis of the vortex Q-criterion was carried out to detect the energetically most significant large-scale vortex structures. A projection index analysis between those vortex structures and the snapshots of the Q-criterion led to the discovery of the most relevant ranges of vortex induced flow and pressure fluctuations.
The experimental results of this study are as follows.
• The spectral analysis of the unsteady volume flow rate showed that, compared to a completely closing glottis, a leaky glottis produces a monopole source spectrum with lower amplitude but with an increased fraction of higher frequency components, e.g. at fv/f0 ≈22 .
• The contributions of coherent trains of vortex packets to the source spectrum are influenced little by leakage when comparing the leaky hourglass case HG(+) and the full closure type RA(+). However, the false vocal folds play a major role herein as they reorganize the jet flow and reduce the influence of the leakage on the central jet. This is well illustrated by the consequences on the flow when they are removed in the vocal fold model.
• The frequency range in the sources of dipole type induced by high en-ergetic vortex trains resides infv/f0 ≈20. . .28 . In both cases without the ventricular folds the average value of this frequency ratio increases by approximately 5 compared to the completely closing cases.
• The fluid-interaction aspect of the present work is seen in the important function of the false vocal folds on the stabilization of the path of the jet and the therefore conservation of the rather regular roll-up of the shear layer vortices producing a strong coherence in the vortex-induced sound sources. This is achieved even in the case when the glottal gap does not show a complete closure such that a continuous leakage is modifying the flow profile.
Acknowledgments
Alipour, F., Karnell, M., 2013. Aerodynamic and acoustic effects of ventric-ular gap. J. VoiceIn press.
B˚aveg˚ard, M., Fant, G., 1994. Notes on glottal source interaction ripple. STL-QPSR 35(4), 63–78.
Carmer, C. F. v., Konrath, R., Schr¨oder, A., Monnier, J.-C., 2008. Identifi-cation of vortex pairs in aircraft wakes from sectional velocity data. Exp. Fluids 44, 367–380.
Chen, G., Kreimann, J., Shue, Y.-L., Alwan, A., 2011. Acoustic correlates of glottal gaps. In: 12. Ann. Conf. Internat. Speech Communication Associ-ation, Florence, Italy.
Chen, H., Reuss, D. L., Hung, D. L. S., Sick, V., 2012a. A practical guide for using proper orthogonal decomposition in engine research. Int. J. Engine Res. 0(0), 1–13.
Chen, H., Reuss, D. L., Sick, V., 2012b. On the use and interpretation of proper orthogonal decomposition of in-cylinder engine flows. Meas. Sci. Technol. 23, 085302.
Chouly, F., Van Hirtum, A., Lagr´ee, P.-Y., Pelorson, X., Payan, Y., 2008. Numerical and experimental study of expiratory flow in the case of major upper airway obstructions with fluid-structure interaction. J. Fluid. Struct. 24, 250–269.
Cranen, B., Schroeter, J., 1995. Modeling a leaky glottis. J. Phonetics 23, 165–177.
Cranen, B., Schroeter, J., 1996. Physiologically motivated modelling of the voice source in articulatory analysis / synthesis. Speech Commun. 19, 1–19.
Erath, B. D., Plesniak, M. W., 2011. Impact of wall rotation on supraglottal jet stability in voiced speech. J. Acoust. Soc. Am. 129(3), EL64–EL70.
Farahani, M. H., Mousel, J., Alipour, F., Vigmostad, S., 2013. A numerical and experimental investigation of the effect of false vocal fold geometry on glottal flow. J. Biomech. Eng. 135 (12).
Graftieaux, L., Michard, M., Grosjean, N., 2001. Combining PIV, POD and vortex identification algorithms for the study of unsteady turbulent swirling flows. Meas. Sci. Technol. 12, 1422–1429.
Gurka, R., Liberzon, A., Hetsroni, G., 2006. POD of vorticity fields: A method for spatial characterization of coherent structures. Int. J. Heat Fluid Flow 27, 416–423.
Hanson, H. M., 1997. Glottal characteristics of female speakers: Acoustic correlates. J. Acoust. Soc. Am. 101(1), 466–481.
Hor´a˘cek, J., ˘Sidlof, P., ˘Svec, J. G., 2005. Numerical simulation of self-oscillations of human vocal folds with Hertz model of impact forces. J. Fluid. Struct. 20, 853–869.
Hor´a˘cek, J., ˘Svec, J. G., 2002. Aeroelastic model of vocal-fold-shaped vibrat-ing element for studyvibrat-ing the phonation threshold. J. Fluid. Struct. 16 (7), 931–955.
Howe, M. S., McGowan, R. S., 2009. Analysis of flow-structure coupling in a mechanical model of the vocal folds and the subglottal system. J. Fluid. Struct. 25, 1299–1317.
Howe, M. S., McGowan, R. S., 2012. On the role of glottis-interior sources in the production of voiced sound. J. Acoust. Soc. Am. 131(2), 1391–1400.
Kambe, T., 2010. Vortex sound with special reference to vortex rings: Theory, computer simulations, and experiments. Int. J. Aeroacoustics 9(1&2), 51– 89.
Khosla, S., Murugappan, S., Gutmark, E., Scherer, R., 2007. Vortical flow field during phonation in an excised canine larynx model. Ann. Otol., Rhi-nol., Laryngol. 116(3), 217–228.
Khosla, S., Murugappan, S., Lakhamraju, R., Gutmark, E., 2008b. Using particle image velocimetry to measure anterior-posterior velocity gradients in the excised canine larynx model. Ann. Otol., Rhinol., Laryngol. 117(2), 134–144.
Khosla, S., Murugappan, S., Paniello, R., Ying, J., Gutmark, E., 2009. Role of vortices in voice production: Normal versus asymmetric tension. The Laryngoscope 119, 216–221.
Kirmse, C., Triep, M., Br¨ucker, C., D¨ollinger, M., Stingl, M., 2010. Experi-mental flow study of modeled regular and irregular glottal closure types. Logoped. Phoniatr. Vocol. 35(1), 45–50.
Krane, M. H., 2005. Aeroacoustic production of low-frequency unvoiced speech sounds. J. Acoust. Soc. Am. 118(1), 410–427.
Krane, M. H., Barry, M., Wei, T., 2007. Unsteady behavior of flow in a scaled-up vocal folds model. J. Acoust. Soc. Am. 122(6), 3659–3670.
Laver, J., 1980. The phonetic description of voice quality. Cambridge Studies in Linguistics.
Mattheus, W., Br¨ucker, C., 2011. Asymmetric glottal jet deflection: Differ-ences of two- and three-dimensional models. J. Acoust. Soc. Am. 130 (6), EL373–EL379.
Mihaescu, M., Khosla, S. M., Murugappan, S., Gutmark, E. J., 2010. Un-steady laryngeal airflow simulations of the intra-glottal vortical structures. J. Acoust. Soc. Am. 127(1), 435–444.
Mittal, R., Erath, B. D., Plesniak, M. W., 2013. Fluid dynamics of human phonation and speech. Annu. Rev. Fluid Mech. 45, 437–467.
M¨uller, E.-A., Obermeier, F., 1988. Vortex sound. Fluid Dynam. Res. 3, 43–51.
Neubauer, J., Zhang, Z., Miraghaie, R., Berry, D. A., 2007. Coherent struc-tures of the near field flow in a self-oscillating physical model of the vocal folds. J. Acoust. Soc. Am. 121(2), 1102–1118.
Park, J. B., Mongeau, L., 2008. Experimental investigation of the influence of a posterior gap on glottal flow and sound. J. Acoust. Soc. Am. 124(2), 1171–1179.
Pelorson, X., Hirschberg, A., van Hassel, R. R., Wijnands, A. P. J., Au-regan, Y., 1994. Theoretical and experimental study of quasisteady-flow separation within the glottis during phonation. J. Acoust. Soc. Am. 96(6), 3416–3431.
Proch´azka, P., Uruba, V., 2011. Identification of vortex structures in dy-namicstudio software. Colloquium Fluid Dynamics, Institute of Thermo-mechanics AS CR, v.v.i., Prague, Czech Republic.
Smith, L., Thomson, S. L., 2013. Influence of subglottic stenosis on the flow-induced vibration of a computational vocal fold model. J. Fluid. Struct. 38, 77–91.
Suh, J., Frankel, S. H., 2007. Numerical simulation of turbulence transition and sound radiation for flow through a rigit glottal model. J. Acoust. Soc. Am. 121(6), 3728–3739.
Titze, I. R., 1995. Definitions and nomenclature related to voice quality. Vocal Fold Physiology, 335–342.
Triep, M., Br¨ucker, C., 2010. Three-dimensional nature of the glottal jet. J. Acoust. Soc. Am. 127(3), 1537–1547.
Triep, M., Br¨ucker, C., Schr¨oder, W., 2005. High-speed PIV measurements of the flow downstream of a dynamic mechanical model of the human vocal folds. Exp. Fluids 39(2), 232–245.
Yang, A., Stingl, M., Berry, D. A., Lohscheller, J., Voigt, D., Eysholdt, U., D¨ollinger, M., 2011. Computation of physiological human vocal fold parameters by mathematical optimization of a biomechanical model. J. Acoust. Soc. Am. 130(2), 948–964.
Zhang, C., Zhao, W., Frankel, S. H., Mongeau, L., 2002a. Computational aeroacoustics of phonation, part ii: Effects of flow parameters and ventric-ular folds. J. Acoust. Soc. Am. 112(5), 2147–2154.
Zhang, Z., Mongeau, L., 2006. Broadband sound generation by confined pul-sating jets in a mechanical model of the human larynx. J. Acoust. Soc. Am. 119(6), 3995–4005.
Zhang, Z., Mongeau, L., Frankel, S. H., 2002b. Experimental verification of the quasi-steady approximation for aerodynamic sound generation by pulsating jets in tubes. J. Acoust. Soc. Am. 112(4), 1652–1663.
Zhang, Z., Mongeau, L., Frankel, S. H., Thomson, S., Park, J. B., 2004. Sound generation by steady flow through glottis-shaped orifices. J. Acoust. Soc. Am. 116(3), 1720–1728.
Zhang, Z., Neubauer, J., 2010. On the acoustical relevance of supraglottal flow structures to low-frequency voice production. J. Acoust. Soc. Am. 128(6), EL378–EL383.
Zhao, W., Zhang, C., Frankel, S. H., Mongeau, L., 2002. Computational aeroacoustics of phonation, part i: Computational methods and sound gen-eration mechanisms. J. Acoust. Soc. Am. 112(5), 2134–2146.
Zheng, X., Bielamowicz, S., Luo, H., Mittal, R., 2009. A computational study of the effect of false vocal folds on glottal flow and vocal fold vibration during phonation. Ann. Biomed. Eng. 37(3), 625–642.