Theses
Thesis/Dissertation Collections
1-1-1988
Optimizing tone production on a 300 spot per inch
laser printer
James R. Hamilton
Follow this and additional works at:
http://scholarworks.rit.edu/theses
This Thesis is brought to you for free and open access by the Thesis/Dissertation Collections at RIT Scholar Works. It has been accepted for inclusion in Theses by an authorized administrator of RIT Scholar Works. For more information, please contactritscholarworks@rit.edu.
Recommended Citation
by
James R. Hamilton
Athesissubmittedinpartialfulfillmentofthe
requirements forthedegreeofMasterofScience inthe
Schoolof
Printing
andManagementSciences intheCollegeofGraphic Arts andPhotography
oftheRochesterInstituteof
Technology
January,
1988School of Printing and Management Sciences
Rochester Institute of Technology
Rochester, New York
CERTIFICATE OF APPROVAL
MASTER'S lHESIS
This is to certify that the Master's Thesis of
James
R.
Hamilton
With a major in Printing Technology
has been approved by the Thesis Committee as
satisfactory for the thesis requirement for the
Master of Science
degree
at the convocation of
January, 1988
Thesis Committee:
Frank Cost
--~~---')=Th::re-s"""'is-A"""""-:-dv--;i"-so-r---Joseph
L. Noga
Graduate
Pro~am Coor~atorMiles Southworth
OPTIMIZING TONE PRODUCTION
ON A 300 DOT PER INCH LASER PRINTER
I, James R. Hamilton, hereby grant permission to the Wallace Memorial Library, of
R.I.T, to reproduce my thesis in whole or in part. Any reproduction will not be for
commercial use or profit.
Iwouldliketo thank the
following
people:Prof. Frank
Cost,
whoseinsightandinterest inspiredthisprojectDr.JosephDeLorenzoandProf. Michael Kleper for
lending
theirexpertisetothisundertaking
RochesterInstituteof
Technology
professorsJosephBrown,
RobertChung,
MarieFreckleton,
C.R.Meyers,
JosephNoga,
MichaelPeres,
Bob TompkinsaswellasDavid CohnoftheT&ECenterwho allhelpedinnumerous stages oftheprojectMark
Curby
andIshmael J. Stevanov-WagneroftheEatonPeabody
Laboratory
foranswerstotechnicalquestions aboutlaser printing
Betty
GreenawaltandPamelaOriansofBoiseCascade,
andJohnGorskiandJudy
PaluckiofHammermillfor arrangingpaperdonations
Lisa DigginsofData
Recording
Systemsfor providingtranscriptsofDavidSpencer'stalksGreg
Haddam,
whoseunderstandingoftheMacintosh greatlyaidedthisprojectList ofTables v
ListofFigures vi
Abstract 1
ChapterOne 1
Introduction 1
Footnotes forChapter One 6
Chapter Two 7
Theoretical Basis 7
TheLaser Printer 8
PostScript 9
Footnotes for ChapterTwo 10
Chapter Three 11
Review oftheLiterature 11
Footnotes forChapter Three 13
ChapterFour 14
Hypothesis 14
ChapterFive 16
Methodology
16TheDevelopmentoftheTests 16
Density
Measurements 21Testing
oftheDensitometer 21Testing
oftheLaser Printer 22Comparing
theStandard Deviations 23Microscopic Studies 23
Footnotes for ChapterFive 24
Chapter Six 25
Results 25
Tone Production 25
Microscopic Studies 26
PaperTests 29
Maximum
Density
Tests 29Gray
Production Tests 30PaperTests 33
Chapter 8 50
Discussion 50
ToneProduction 50
MicroscopicStudies 52
PaperTests 53
Maximum
Density
53Gray
Production 54Chapter 9 56
Summary
56Conclusions 56
Recommendations for Further
Study
57EquipmentUse 57
Bibliography
59Appendices 62
A Tone Production Data 63
Condensed 63
Diamond 67
Open 70
B
-Paper Tests 74
Density
-Part One 75
Maximum
Density
- Part Two. . . . 76
Gray
Production 77Grading
Grays 78C
-Consistency
Tests 79LaserWriter 80
Densitometer 83
D- BartlesonandBreneman 84
E- Spot Sequence 88
Condensed Dot Form Sequence 89
Diamond Dot Form Sequence 90
Open Dot Form Sequence 91
F - Sample Output- 3x3 Condensed 92
3x3 Condensed 93
Pagenumber
Table 1 - Matrix
size,number of grays possible andlinescreenat300spotsperinch. ..11
Table 2
-Summary
of spots in matrix, graylevel, linescreen,
and screen angle 20Table 3 - Comparison
oftestsquareswith 50% spots on 26
Table 4 Dot size measurements 27
Table5
-Testing
the accuracy ofthemicroscopic measurements 28Table 6 Results ofthe firstpapertest 29
Table 7
-Results ofthe second papertest 29
Table 8 - Results
ofthethirdpapertest 30
Table 9 - Overview
of paper characteristics 31
Table 10
-50%spots onwithinformation concerning areabetweenspots 51
Table 1 1
Pagenumber Figure 1 - 3x3
matrix of squares 3
Figure 2 - Grays
possibleversus linescreen at300 spots perinch 11 Figure 3-
Comparison
of4x4open and condensed matriceswith eight spots on 14 Figure 4 - 3x3
open matrix 18
Figure 5 - 3x3
condensed matrix 18
Figure 6 - 13
spotdiamond matrix 19
Figure 7 - Spot
sequence in 13 spotdiamond matrix 20
Figure 8 - Irregular
nature ofthe dot 27
Figure 9
Illustrating
dotsize 28Figure 10 Graph of
2x2, 3x3, 4x4,
and 6x6open matrices 35 Figure 1 1 - Graphof2x2, 3x3, 4x4,
and 6x6condensed matrices 36 Figure 12 - Graphof
5,
8, 12,
and24 diamondmatrices 37Figure 13 - Graph of matrices
containing 25 spots 38
Figure 14- Graphof open and condensed 8x8matrices (withcolumn
breaks)
39Figure 15 Graphofidealtonal scale versus 8x8condensed matrix 40 Figure 16 - Microphotoofparallel lines atfinestresolution 41
Figure 17 Microphoto of1/25 5x5 open matrix 42
Figure 18 - Microphoto of6/25 5x5 open matrix
43
Figure 19
-Microphotoof 12/25 5x5 openmatrix 44
Figure 20 - Microphotoof 13/25 5x5 openmatrix 45
Figure 21 Microphotoof 18/25 5x5 open matrix 46
Figure 22 - Microphotoof24/25 5x5 openmatrix 47
Figure23 - Microphotoof 12/25 5x5 condensed matri 48
Figure 24 - Microphotoof 12/25 25 diamond matrix 49
Digitalhalftonesas output on plain paper arethefocusofthisstudy. Anew
terminology
issuggestedtoallow properdescriptionofdigital halftones. Themost importantofthese termsistheuse of"addressability"
toreplacetheoften misusedterm "resolution."
Also important istheuseoftheterm"spot" ratherthan"dot" todescribe addressability. Ameans ofproperly
describing
digitalhalftonesissuggestedtoavoid confusion withanalog(ie.,
conventionalphotographic)halftones.Halftonepatterns were createdto test theefficiencyofdifferent designsat300spot perinch addressabilityon alaserprinter.Thepagedescription language PostScriptwas usedtocreatethehalftonepatternswhichweremodeled onthreebasic designs.
Ithasbeenestablishedthat twohalftone dotpatternsconstructed onthesamematrix andcontainingthesame number of spots will producedifferent densities ifthe
configuration ofthespotswithinthematrixisdifferent This has beentested
by
comparing theresults ofthe toneproductioncurves ofthecondensedand openhalftone dot designs. Thesepatterns were output on alaserprinterand measuredfor density. Toneproduction curves weredrawnand compared.Eventhougheachmatrix containsthesame numberof spots,it hasbeenshownthatdifferent densitiesresult.This is solelya consequence ofthe dotdesign.Microscopicstudies wereconductedtoillustratethenature ofthefilling-in inthe non-image area.Microscopicmeasurements werealso madetoascertainthesize of an individualspotatvarious screen rulings. Itwasfoundthat thespot,whichwasvery irregulartobeginwith,actually begantobreak upasthelinescreenapproached150 lines perinch.
Papertestswere runtogaugethemaximum
density
andthe toneproduction capabilities ofvarious papers.Although theresults wereinconclusive,
they
point out anotherflawofdigital halftoneswhichareoutputon plain paper.Thenumber of grays predictable,givenamatrixsize,isgreaterthanwhatisachievableinpractice.INTRODUCTION
Theideaofcombiningtextandillustrationswithout
having
tocut and pasteisa conceptthathas intriguedtheauthor sincehis daysas a mechanical artist.However,
tobeabletoachievethis goal,both digitaltypeandhalftonesare necessary.Inaddition,a "type-"
or"image-"setterisrequiredthatcan receive and createbothtypesof output
Devicesandtechniqueshave been developedthatcan now achievethesegoals, and what's
more,since
they
output onplainpaper,they
mayevenleadto theelimination offilmas astep intheproduction process.This study investigates digital halftonesandthewaythese
halftones are output onplainpaper. Suggestionsare madetooptimizethedesignanduse
ofdigital halftones.
Consistency
interminology isstrivedforthroughoutthisproject Someofthetermsthatare usedrepeatedlyare:
addressability
-the
frequency
withwhichthelasermarks thephotoconductive surfacedot- theone or more spotsusedtoformthebasicunit of ahalftonepattern
halftone
-atechniqueusedtosimulate continuoustoneimages ina processthatcan
onlyprint or not print at all
latent image- animagethatis
present,butnot yet visible
(ie.,
beforeapplicationoftoner)
linescreen- alsoknownaslineruling; themeasure ofthedistance between halftone
dots inahalftone
linesperinch- thetermusedtodescribethelinescreenof ahalftone
matrix- a
groupingof spots
photoconductivity- the
propertyofconductingelectricityuponexposuretolight
orsharpness
spot
-thesmallest mark alaserprinter can make on paper spots perinch- theterm
usedtodescribe addressability
Toconduct adiscussionoftheissuesinthisthesis, it isoftheutmostimportanceto
maintainconsistencyinterminology. Thereare a number ofmisleading terms which,
poorly
defined,
haveresultedinmuch confusion.Oneofthemostimportantofthesetermsis"resolution."
Resolutionisoften
incorrectly
describedintermsofthenumber of marks that thelasercan makein creatinganinchoflatent image. Thislatentimage, however,
is subsequentlytonedandtransferredtopaper, andany degradationoftheimagethatoccursinthis processisunaccountedfor. Sincethisdegradationtends tobemuchlargerthanina
photographicprocess,itmakestheuseofthe term"resolution" quite misleading. Ifa number valueistobeassigned,the term"addressability" ismore accurate.
Addressability
isthecapabilityofthelasertomark alatent imageonthephotoconductive surface.This canbedescribedmoreaccurately numericallythanresolution sincethereisnodegradation
oftheimagetoaccountfor.
Keep
inmindthataddressability describesthelatentimagewhereas resolutiondescribestheimageonpaper.
Unfortunately,
"resolution" isthe term thatismostcommonly usedtodescribetheimaging
capabilityof aprinter, andit isoftendescribed intermsof "dotsper
inch",
anotherconfusingterm.Printersare accustomedtotheterm"linesperinch" todescribehalftonescreens.
However,
300"dotsperinch" and300"linesperinch"donotmeanthesamething.Inhalftones a300lineperinch linescreen wouldbeof extremefineness. 300 dotsperinchontheother
hand,
producesimagesthatarerelativelycrude
(keep
inmindthat72dotsperinchis dotmatrix printerqualitywhile1000dotsperinch isthe
beginning
oftypesetquality.) Theword"dot" alsoisassociated withhalftonescreens,as in "halftonedot."
Thepotentialforconfusionis
limidess,
andsolelya result of
faulty
terminology.Tounderstandthisproblemitisnecessary tohavea generalunderstandingofthe nature ofhalftones.
They
existtoproduceanillusionofgrayness ina processthatcanonly printblackornot print at all.Halftonescanbe describedasbeing
analogordigital. Inusing theterm
"analog
halftone"
the dots inch. Confused?Youhavea reasontobeconfused sincetheword "dot"
hastwomeanings withinthelastsentence.First it isusedas"halftonedot" which
may vary insize,andthenit isused as"dot" in dotsperinchwhereitmeanstheminimum markablespot(a constant)inalaserprintingsystem.
Toalleviate some oftheconfusionbetween digitalandanalog
halftones,
itwillbenecessarytorevise some commonly-used vocabulary. Theterm"addressability" shouldbe
usedwhennumerically
describing
thecapabilities of a plainpaperprinter."Addressability"
and"resolution"which arevirtually identical inreferencetophotographic processes arein
factquitedifferentwhen usedtodescribeplain paper processes.
Furthermore,
"spotsper inch,"not"dotsperinch," shouldbethe termusedfor
describing
addressability.Theword "dot"simply hastoomanyother connotations."Spotsperinch" willbethe termusedto
describe addressability fortherest ofthisstudy. "Linesperinch" shouldbeusedsolely for
describing
halftones.Analog
halftonesareadequately describedby
thetermlinesperinch;
however,
digital halftonesrequirefurtherexplanation.Abasic descriptionofadigital halftonewill
help
illustratethepointFigure 1illustratesa3x3matrixof squares:
X
m
X
X
X
X
X
X
X
Figure 1 - 3x3matrixof squares
Using
this tobuildadigitalhalftone,
black,
whiteand eight shades ofgraycanbeshades ofgraythantheexample above. In
fact
it'slaughabletotry
and comparethem. Yet ifthedigital screenisdescribed as a100 linescreen,theimmediateassumptionisthatit isequivalenttoa100lineanaloghalftone.
Therefore,
toadequatelydescribeadigitalhalftone,
itisnecessarytostate notonlythelinescreenbutalsotheaddressabilityoftheoutputdevice.
So,
where 100 lines perinchjustly
describesananaloghalftone,
100lines perinchat300spots perinchwouldjustly
describeadigital halftone.This bringsupanother point.Oneofthecharacteristicsthatcanmakeanalog
halftonessuperiortodigitalhalftones isthat
they
are outputonphotographicpaperwhich,ofcourse,hasgreatsensitivitytoverysubtiedifferences. Whenphotographicpaperis
usedtocapturedigital
halftones,
much moredetailcanbe heldthanifthesamehalftone were outputon plainpaper.Thus ifadigital halftonewereoutput onbothplainand photographicpaper,much moredetailwouldbe heldonthephotographic paper. This seems quite obvious.Butitisalsotrue thataslaserprinters gainhigherandhigher addressabilities(intermsofspotsperinch),
themainlimiting
factorwillbethepaper,not thenumberof spots perinch.Theuse ofdigitalhalftones is goingto
increase,
and as aresult,the"look"ofhalftoneswillchange.Digitalhalftonesthatarecreatedforoutput ondotmatrix orlaser
printersalreadystart out at a markeddisadvantagetoanalog halftones:
they
simply fall far short ofphotographic resolution.Even digitalhalftonesthatare output onlasertypesetters havelowerresolutionas comparedtoanalog halftones.There is a simple explanationforthis: thesmallestmarkalaserphototypesettercan createislimited
by
thesizeofthelaserspotwhile,on theother
hand,
lighton photographicfilmorpaperis limited onlyby
the grainsize ofsilverhalidewhichismuchsmallerthan laserspot size(silverhalidecrystalsrangefrom0.05 to2
microns1
whilelaserspot size at300spots perinchis around85
microns.2)Thereisanother complication: thesmallerthelaserspotsize, thelargerthe amount ofinformationtobeencoded,and, thelargerthe amount of
information,
thelarger thecost andtimeinvolved. Forexample, at300spotsperinch,
90,000(300x300)
bitsof informationareneededtoencodea squareinchofimage. At 1000spotsperinch,
1,000,000
(1000x1000)
bits arerequired. Thusthereis atradeoffbetweencost andaddition, there for using digital halftones.
Among
advantages are ease ofdata transmission,electronic storage ofimages,
and electronicdata manipulation.Itshouldbestressedthatalloftheexperimentationinthis studywasdoneona
singleAppleLaserWriter. The limitedscope oftheexperimentswillgive someinsight into
thestrengths and weaknesses oflaserprinting;
however,
these tests are notintendedtobeusedtodrawconclusions about the capabilities ofanymanufacturer'sproduct.Thereis
simplynotenoughdatatosupportthose sorts of claims.Thisisalsotrueofthetestsonthe
X-Rite densitometerandtheHammermillandBoise Cascadepapers. Thesetestshave been
JMcGraw
Hill EncyclopediaofScienceandTechnology. 6thed.S. v."Photography,"
by
Vivian K. WalworthandRobert D.
Anwyl,
p.405.2Author's
calculation:1/300"
THEORETICAL BASIS
In 1937Chester Carlson inventedthefirstelectrostatic process (latercalled xerography.)1
Thiswas thebirthof part of the
technology
forthelaserprinter.Patentswereissuedin 1942and
1944,
andby
1950Xeroxhadthefirstcommercial copieronthe market.The Xerox 914office copier was introducedin1960,
and sincethen,electrostatic copiershavebecomeanintegralpart ofAmericanbusiness life. Inthelate1950's,
Dr. CharlesTownesandDr. Arthur Schawlow laidthefoundations fortheconstructionforthefirstlaser.2
The firstworking laserwas constructed
by
Dr. Therodore Maiman in I960.3 The laserhas broadenedtheapplication ofthecopier.The devicecan nowbeusedas animagesetter/typesetter. Aprime exampleofthisistheApple LaserWriter.The LaserWriter ismorethanalaserprinter;it isacomputing devicewith 1.5megabytes ofrandomaccess memory.Ithasbeen describedasthemostpowerfulcomputerthatApplemakes.4
And
yeteven withthatamount ofmemorytheLaserWriteris limitedtoanaddressabilityof300
spots perinch. This makesitan excellent choicefor business applications,butsubstandard
forthegraphicarts (where 1000spotsperinchis arguablythe standard.)Larger
addressabilityrequires morememory,butthishasnot preventedtherecentintroductionof 400and600spot perinchprinters.Ofcourse,laserphototypesettershave beenused with
great success ataddressabilities of muchhigherthan300spotsperinch
but,
forthemost part,thesesystems usephotographicpaper.5Companiesare anxioustoperfect a plainpapersystemdueto thehighexpense ofphotographicpaper.
Oneofthemost
interesting
developmentshas beenthatofthepagedescriptionlanguage PostScript.
Previously,
eachtypesetting
manufacturerhaditsowncodinglanguage fortheirmachinery.Acomputerfile forone manufacturer'stypesetterwouldbe
useless onanother's.
However,
through theuse ofPostScript,
a single computerfilecan berun on anumberofdifferentoutputdevices attheresolutionofthatoutputdevice. Thisis what
is
knownas deviceindependence.PostScript,
thoughnottheonlypagedescriptionSincethelaserprinter and pagedescription languageare ofimportancetothis
project,
they
willbe discussedinthefollowing
sections.The Laser Printer
Tounderstand whatthelaserprinterdoestoproduce an
image,
it is necessarytohaveanunderstandingoftheelectrostatic process.Inthis
discussion,
theelectrostaticprocess(ormorespecifically,transferxerography)willbe describedas atoner-based
system.Theelectrostaticprocess,as usedinconventionalphotocopiers,isrelatively
simple.Adrumor
belt,
often constructed ofselenium,is charged.This surfaceisaphotoconductor whichloses itscharge when exposedtolight. When oppositelycharged
tonerparticles arebroughtincontact withthesurfaceofthe
drum,
they
adhereto thecharged areas
(ie.,
theareasthathavenotbeenstruckby
light.)
Inthenextstep,a pieceofpaperisbrought incontactwiththedrumatthesametimethata chargeisappliedto the
backside ofthepaper,removingthetonerfromthedrumandpassingitto thepaper. The
toneristhenfusedto thepaper,completingtheprocess.7
Considerfora moment a conventional copier.Toobtain acopy,light isreflectedoff
theimagethatis
being
reproduced.Where light fromthenon-image area reflects ontothesurface ofthe
drum,
thechargewillbelost,
andthereforenotonerwillbeattracted.Thereverseistrueintheimagearea;nolightreflectsfromtheblackoftheimageandtherefore
thedrumstays charged and attractstoner.Inalaserprinter,whereyouare notworking
fromreflectioncopy,thelasercanbeused eithertoerasethenon-image areaintheway
thatlight does in theconventionalcopier,oritcanbeusedtocreate animagearea.Ifthe
laseris usedtoerasethenon-imageareaitisknownaswhitewriting;if itcreatestheimage
areait isknownasblackwriting.The
image-creating
part of alaserprinteriscalledthe"engine."
The CanonengineintheApple LaserWriterusedforthisexperimentis
blackwriting.8
The laser inalaserprinteriscontrolled
by
a polygon-shaped mirrorthataimsthelaser beamatthedrum.Thepathofthebeamishorizontalacrossthedrum
surface.The drum in theLaserWriterischargedandthechargesdissipatewhenstruck
by
thelaser. It becomesclearatthispointthatiftoneristhenattractedto thechargedareas, a
negativeimagewillresult
However,
sincethetonerhas thesame charge asthechargedareas ofthe
drum,
tonerwillonlygotonon-chargedareas(ie.,
wherethelaser has struck.)Thusthe tonersystemsare quitedifferent betweenblack- and whitewriters.
creating finehalftonea similar problem arises.The halftone
dotscreateslittleislandsoflike-chargethatbegintoaffect each other asthelinescreen
increases.
PostScript
In
1982,
ChuckGeschkeandJohn WarnockformedAdobeSystems,
Inc. Their productPostScript
isdescribedas "aprogramming language designedtoconvey a descriptionofvirtually anydesiredpagetoaprinter."9PostScript's syntax resembles the
programminglanguage
Forth,
butthereare also similaritiestoLisp10. The PostScript imageoperator was usedexclusively forthisproject Adescriptionofhow itwasusediscontainedinthe
Methodology
section,page 16. Forthepurposes ofthisproject,FOOTNOTES
FORCHAPTER TWO-J.J.RheinfrankandL.E.
Walkup,
"Current Status ofElectrostaticReproduction Processes,"1961 TAGA Proceedings.TechnicalAssociationoftheGraphic
Arts,
Rochester,
NewYork: n.p.,1961,
p.114.2Allen
Maurer,
Lasers - Light WaveoftheFuture. NewYork: Arco
Publishing, Inc.,
1982,
p.2.-Ibid., p.39.
4Bruce
Blumberg,
"Page Printersfor LowCost ElectronicPublishing,"The Fourth
National Print
Quality
Seminar.Newtonville,
Massachusetts:Datek InformationServices,
Inc., 1985,
p.237.5One
exceptionistheTegraGenesissystemwhichclaimsaddressabilityof1012spotsperhorizontal inchon plainpaper,Tegrapromotional material.
6"...PostScript
hasnow emerged as'the'pagedescriptionlanguage. Atthemoment,AdobeSystems isalmostinamonopoly
position."
TheSeyboldReporton
Publishing
Systems."Competitors for AdobeSystems," 16(May
11,
1987): 49.Encyclopedia
ofPhysicalScienceandTechnology. 1987ed.S. v."PhotographicMaterialsand
Processes,"
by
P.S.Vincent,
pp.484-494.8Personal
letterfrom MarkCurby
andIshmael Stevanov-Wagner.9Adobe
Systems, Inc.,
PostScript Language Tutorial andCookbook.Reading,
Mass.:Addison
Wesley Publishing
Co.Inc., 1985,
p. 1.10Adobe
Systems, Inc.,
PostScript LanguageReferenceManual.Reading,
Mass.:CHAPTER THREE
REVIEWOFTHE LITERATURE
In an articleinthe
February
16,
1987 Seybold ReportonPublishing
Systems1,
David R.
Spencer,
chairmanofDataRecording
Systems,
uses a charttoillustratea pointaboutthe tradeoffsbetweenshades ofgrayandthefinenessoflinescreens. Theresultsfor 300spots perinchare summarizedin Table 1 and shown graphically in Figure 2.
Table 1 - Matrix
size,number of grays possibleandlinescreenat300spotsperinch
MatrixSize 2x2 3x3 4x4 5x5 6x6 8x8 10x10
GraysPossible* 5 10 17 26 37 65 101
Linescreen 150 100 75 60 50 37.5 30
?this isatheoreticalcalculationofgrays,
including
blackandwhiteGrays
100-75
-50
-25
-Grays
Possiblevs. Linescreen
at 300 spi
I
90
T
T
n
r
30 60 90 120 150
Linescreen in lines perinch
Figure2showsthat thelargerthenumber of graysproducible, thefewerthelines in
thelinescreen. Spencergoes ontosaythatat300spots per
inch,
therejust isnotasatisfying tradeoff; hiscutoffis thepoint at which64shades ofgrayareachievable, and thelinescreenis atleast65linesperinch.In
fact,
thiscombination offactors isnot possible untiltheaddressabilityreaches600spots perinch. StephenRoth2 ,intheMay
1987issueofPersonal
Publishing
magazine,makes a similar statement aboutthenumberof grays producible. Bothauthors haveassumedthat theseprojections arein facttrue.
Whilethelinescreen informationisaccurate, thenumber of grays achievableis debatable
(refertodiscussionongrayproductioninthepapertests,page
54.)
Itisthisdiscrepancy
betweenwhatiscalculable and whathappensinreality thatprovidedtheimpetus forthis thesis.
A goodunderstandingofdigital
halftoning
isimportantto thisstudy. SomereferencesthatarehelpfulareJarviset al
(1976),
StoffelandMoreland(1981),
andAnastassiouandPennington(1982).Morerecently,GoertzelandThompsonofIBM
(1987),
havewrittenaboutdigital halftonesontheIBM4250printer.David Spencer(1985, 1987)
andAmnon Goldstein(1985),
bothofDataRecording Systems, Inc.,
havebothpublishedthought-provokingarticlesontheissues
involving
printqualityoflaserprinters.Dr. William White hasalsowritten
lucidly
ontonersand resolutions(ofparticularnotearethemicrophotographs.)His
book,
Laser Printing: TheFundamentals,
has goodbasic informationonlaserprinters.
For informationon
PostScript,
thebooksby
Adobe Systems Inc. formedthestartingpointforthe programmingnecessarytobuildthetestpatterns.PostScripthas been
thefocusof quite alotofinterestrecently,seeDennis Pelli'scontributionto the
Berkeley
Macintosh Users
Group
Newsletter,
Fall1986,
pp.35-44.For informationaboutnumerouspagedescription languagesseetheApril
14,
1986issueoftheSeybold Reporton
Publishing
Systems.ForinformationonBartlesonandBreneman'sdarknessvalues, referto their
originalarticle
(1967),
andalsothoseofArcher(1978)
andR. E. Maurer (1982). Inaddition,anunpublishedhandout
by
Prof. RobertChung
ofRITwas instrumentalinFOOTNOTESFORCHAPTER THREE
!David
R.Spencer,
"OutputTechnologiesandHighResolution,"
The Seybold Reporton
Publishing. 16
(February
16 1987):p.5.CHAPTERFOUR
HYPOTHESIS
Thehypothesisofthisproject canbestated asfollows:
Twohalftonedotpatterns constructed onthesame matrix andcontainingthesamenumber
of spots will producedifferent densitiesiftheconfiguration ofthespotswithinthematrix
is different
Togive anexample, a4x4condensed matrixcontainingeight spotswillproduce a
different
density
than a4x4open matrixcontainingeight spots (see Figure3).Open
Condensed
Figure 3 - Comparisonof4x4openand condensedmatriceswitheight spots on
The 4x4open matrixcontainingeight spotswillproduceadarker
density
becauseofthetendency
oftonertofill inthenon-image area.Whatisofimportance here isthatjudiciousdesignof matrices canbeusedtocontroltoneproduction.
This hypothesiswillbetested
by
comparingtheresults of condensed versus open dot forms. Thenature ofnon-square matrices willbetestedwith thediamond dot forms. Theeffect ofpaper ontheseprocesses willalsobetested.Firstand
foremost,
it istheintentofthisprojecttoshowthatwhatmight appearto beachievablewiththelaserprinterisnot always whathappens inpractice.Theconfusionbetween300spotsperinchaddressabilityand300spots perinchresolutionis an example
mathematicallypossible,but
they
havenottested theactual outputItis theauthor'sbeliefthatfewergrays areactuallypossiblethanSpencerandRothestimate.
Testing
how manygray levelscanbeproduced wouldbeathesisin
itself,
butitwillbeaddressedinsomeCHAPTER FIVE
METHODOLOGY
Abasic method was usedforallthe
testing
inthisproject.First
aPostScript file wascreatedthat,when output onthelaserprinter,would resultinahalftonetestpattern. Thesetestpatternsweremeasuredby
densitometerandtheresults recorded.Inthissection, thenature ofthecreation ofthe testswillbe
discussed,
aswellastests toascertainthevariationinthedensitometerandthelaserprinter.
Finally,
thetechniquesusedforthemicrophotographyand microscopic measurementswillbe discussed.
TheDevelopmentoftheTests
The
feasibility
ofthisprojecthingedonthecreationofthevarioustestpatterns.Prof. FrankCostsuggestedthat thesepatterns couldbecreated on anApple Macintosh personal computerusingthepagedescription language PostScript Continuedresearch
revealedthatthe"imageoperator"
described inthePostScript CookbookandTutorial1
alongwiththesoftware programsJustTextandSendPostScriptwould allowthecreation of theprogramsandtheir transferto theLaserWriter.Thecreationoftheindividualpatterns wastime-consuming.
First,
thedotpatternhadtobe broken downintoa series oflaser spotsthatcouldberepeatedtoproducetheactualdot.Thisseriesthenhadtobetranslatedintoahexidecimalformat foruseintheimageoperator.
Finally,
thehexidecimalnumbers wereinputontheMacintoshand proofedontheLaserWritertoensurethat thecorrectdotpattern was produced.
Aportionofatypicalprogramlooks likethis:
150 650translate 69 69scale
288288 1 [288 0 0288
00]
B6DBB6DBB6DBB6DBB6DBB6DBB6DBB6DBB6DB
B6DBB6DBB6DBB6DBB6DBB6DBB6DBB6DBB6DB
FFFFFFFFFFFFFFFFFFFFFFFFFFFFFFFFFFFF
>}imageshowpage
Thisprogram would create a3x3matrix with one spot on out of nine.The firstcommand,
"translate",
determineswheretheimagewillbeplacedusingx andycoordinates.Thesecondcommand,
"scale",
determinesthata squareimage 69x69units willbeproduced(thereare72unitstoan
inch.)
Thenext sevenlinesarethe"image" command.The firstthreenumbers ofthefirst line indicatethat theimagewillbe 288x288pixels wide and each
pixel willberepresented
by
onebit Thesix numbersinthesquarebracketsscaletheimagetofittheunitsquaredescribed inthe"scale" command.2
Thenext sixlinesare a
hexidecimalrepresentation of ahalftone.PostScript hexisthereverse of normalhex so
thatF =0000where0represents non-image area.Thetwolines ofsolidF's (the F's
repeat72
times)
represent onehorizontalscanline.Thesameistrueofthe twolinesofB's,
6'sandD's. The lasttworows ofF's completethe thirdrow ofthe3x3 matrix.Whenthatiscompleted, thecycleisrepeateduntiltheunitsquareis filled.Atthatpoint,
theimageis actuallycreatedusingthecommand
"showpage."
Appendix
F,
page93,
containsa sampleofa3x3condenseddottestpattern.Notethatthe 10squares(oneis
blank)
representthetengray levels. The foursmallblackcornersquares appearin every testimage.
Using
thiskindofprogram,severaldotshapes were produced.They
are categorizedunderthenames
"condensed", "open",
and"diamond".Thefigures thatfollow illustratethedifferences inthevariousdotshapes.Theopendotshapedescribesadotthatis
X
X
X
?x?
X
X
X
X
Figure4- 3x3
open matrix
Thecondenseddotshapedescribesadotthatis builtaround a central spot:
Z
1
Figure5 - 3x3
condensed matrix
Thesquare nature oftheseopenandcondenseddotformsmakesitpossibletostackthem
one on
top
ofanother. Thisallows ascreenangle of zero(therows couldbestaggeredtocreatescreenanglesotherthan zero;howeverthiswasnotdone inthisexperiment.)
Screenanglebecomesafactor inthediamondclassofdotshapes sincethesedots
are notformedonasquare matrixanddon'tstackup neatly like boxes.
However,
inthesensethat
they
buildonacentralspot,they
are similartocondensed spots.Figure6X
EX
*P
KN
X
Hxil^
_*<*i***
Therelationbetweenspotsinthematrix,number ofgray
levels,
and screen angleisshowninthe tablebelow:
Table2
-Summary
of spotsin matrix, graylevels,
linescreenand screen angleCondensed/Open
2x2
3x3
4x4
5x5
6x6
8x8
Diamond
5
8
12
13
24
25
?includesblackand white(rememberthatthis iswhatis mathematicallypossible)
Thespot patternsdescribed inthe chart above canbe described inavisualshorthand
thatdescribesthewaythedotis formed:
Grays+
Linesperinch ScreenAngle
5 150 0
10 100 0
17 75 0
26 60 0
37 50 0
65 37.5 0
6 134.2 63.4
9 106.1 45
13 83.2 33.7
14 83.2 56.3
25 60 36.9
26 60 36.9
13
7 8 9
12
6
1 2 105 4 3
11
Figure7
For informationonthespot sequence of alldot
forms,
seeAppendixE,
pages 88-91.Sincethereare somanypossible combinations ofdot formationsonlyafewcould
bechosenfortesting.Theseparticular condensed and open patterns were chosento
comparetheaffect oftonerspreading intonon-image area.Thediamondpattern was
chosentolookattheeffect of anotherdotform(onewitha non-squarematrixandascreen
angle.)Screenangle couldhavebeenisolatedas afactor
by
creating screen anglesfortheopenand condensed
dots,
butthiswasnotdone inthisstudy.Density
MeasurementsAll
density
measurements were madewithanX-Rite 309reflectiondensitometer.Calibrationwashandledas specified
by
themanufacturer.Measurementswere madeon atablesurface with ablanksheet ofpaper
backing
upthetest.Threemeasurementsweremade on each l"xl"
testsquare.Themeasurementsequencewithinthesquarewas: upper
rightcorner,leftcenterandlowerrightcomer. Thesemeasurementswererecorded
direcdy
onthesheetandlateraveraged.Theseaverages wereusedforanalysis.
Thetestsforthisresearch wererunon anApple LaserWriter. When runninga series
oftests,
they
were rununinterrupted.Paperforthese testshas beensuppliedby
Boise CascadeandHammermill.They
have been labeled "A-E"."A"
representsHammermill
Laser
Copy,
"B"representsHammermillLaserPrint,
"C"
representsHammermill Laser
Plus,
"D"representsBoise CascadeLaserPaperand "E"representsBoiseCascade Cotton
LaserPaper. Paper"C" waschosentobeusedforalltestswhere paper was notthe
variable.
Twoparametersare ofparticularimportanceinthisstudy.The first istheabilityof
the densitometer togivereproducibleresultswithinan acceptabletolerance,andthesecond
istheabilityofthelaserprintertoproducethesamepattern(froma sourcecomputer
file)
within reasonabletolerances. Theresultsforthe
following
sections aretobefound inAppendix
C,
page79.Testing
ofthe DensitometerThe X-Rite309manual3
statesthatmeasurementofthecalibrated reference check
inthisstudy
by
thehalftonenature ofthetestpatterns andthevariationsthatcanoccurwithin a giventestpattern.Measurementswere recordedin
density,
notdotarea. Inan efforttomaintainthehighest accuracywhilekeeping
theprocedurefeasible,
three measurementshavebeenmade on eachtestsquare.Totest therepeatabilityofmeasurements madeinthis manner,an experiment wasconducted.Threetestsquares were chosen andmeasured35timeseach.Thefirstsquarehadan average
density
of.26,thesecond squarehadan average
density
of.78,andthe thirdsquarehadanaveragedensity
of1.13. The standarddeviationsare asfollows: lightpatch .006,medium patch .010and
solid patch.018.Whatthisimplies isthat thelowerdensitiesare measured more
accurately
thanthehigherones.
Testing
oftheLaser PrinterAsingleAppleLaserWriterwasusedforalltests;
initially
itwastestedforconsistency. Theconsistency test(see Appendix
C,
page80)
showedtheextentof variationpossiblewithinrepetitions ofthesamefile. This testhadthirty
solidblacksquares(each
l"xl")
infivecolumns of six squares each.Thissamefilewasprintedthreetimeswiththeresults asfollows.
Density
measurements rangedfrom.88to 1.30 (arangeof.42).Thiswide rangeisaccentuated
by
thevariationsindensity
on a givenpage;however,
ifa squareiscomparedtoa squareinthesamepositiononthefollowing
pagethenthevariations wentonlyas highas.26.
Following
inthismanner ofonly comparingthesame square ondifferentpages showsthat 100%ofthemeasurementsfallwithin.243
ofthemean. Inotherwords,there isastandarddeviationof.081.
Itwasdiscoveredthat thereisa
tendency
fortheprintertoprintdarkerontheleft handside ofthepage(thisisclearlyshownby
theaverages of pages1-3,
AppendixC,
page
81.)
Thetop
was alsoslighdy darkerthanthebottom. Generalobservations revealedthatsheets were oftenmarked withtracesofapreviousimage. Inaddition,adarkimageon
a single sheet could affectthedarknessachievableinother areas ofthesheet.It became clearthatseveral stepswouldhavetobetakentoadjustforthesevariations.
First,
corner testsquares wereincludedoneachimagesothatageneral comparisoncouldbemadebetween any twotestsheets.
Secondly,
thepositioningofthesquares was reconsidered. Greaterspace wasleft betweentestimages,
fewer imageswereincludedon apage, andtestimageswerekept away fromtheedge areas of pages wherevariationwasgreatest.
Thirdly,
whenanumberoflike-tests weretoberun,a"sample"
theghosting effect of a previousimage.Evenwiththeseadjustments,itwas clearthata
certain amount ofvariationwasinherentintheprocess which could notbeavoided.
Comparing
theStandard DeviationsItfollowsthata comparison canbemadebetweenthedensitometerandthelaser
printer.Thedensitometermeasured a solidtestsquarein35trialswitha standarddeviation
of.018(mean
density
= 1.13). The LaserWritercreatedthesame solidtestsquare90timeswitha standarddeviationof.081 (mean
density
=1.14.) Althoughit istruethatthevariationcaused
by density
measurementwillbereflectedinthis .081 standarddeviationforthe
LaserWriter,
it isstill quite clearthat thevariationintheLaserWriterisof amuchgreatermagnitudethaninthedensitometer.
MicroscopicStudies
Themicrophotos were shotusinganOlympus BH-2microscopewith
Tungsten-Halogen
lamp
and aNikonMultiphotphotographic attachmentThemagnification was80x (Vonthephotograph = onthe
original.) Allphotographs
representPaperC. Polaroid Type 55 Positive/Negative Instantsheetfilmwasused.
Exposuretimewasfourminutes anddevelopmentwas handledas prescribed
by
Polaroid.These4x5negatives werethencontact printedforreproductioninthis thesis.
They
havebeenmounted on a grid
illustrating
thematrix.Microscopicmeasurementsweretakentodeterminetheactualsize of adot
consistingofonespot.The instrumentused wasaBauschandLomb lightmicroscope
witha lOx
lens,
zoom adjustmentand acalibratingeyepiece.Theeyepiecewascalibratedtoan etched slidewithdivisionsof.001".Themarkingsintheeyepiece were adjustedto
FOOTNOTESFOR CHAPTERFTVE
1Adobe
Systems, Inc.,
PostScript LanguageTutorial andCookbook.Reading,
Mass.:Addison
Wesley Publishing
Co, Inc., 1985,
p.l1 1-116.2Surprisingly,
whenthescale was setto72x72and a300x300pixelimagewascreatedtheresultingtestpatterndisplayed repeatingpatternsthatstreakedtheimage vertically
andhorizontally. Trial and errortestsconfirmedthat thecombination of69x69
scalingplus a288x288pixelimageresultedinnon-streakedtestpatterns.288 is a
multiple of72whichmay be whyiteliminatesthe streaking,althoughno
explanationfora unit square of69x69was everdetermined.
CHAPTERSIX
RESULTS
Besidestheconsistencytests(referto the
Methodology
section),a numberofdifferenttests were conducted.
They
canbe divided intogroups: tone production,microscopicstudies,and papertests. Alldata forthe toneproduction and papertestsare
includedintheAppendices.Theresults ofthemicroscopic studies areincludedinthis
chapter(withtheexception ofthemicrophotographs.)
Tone Production
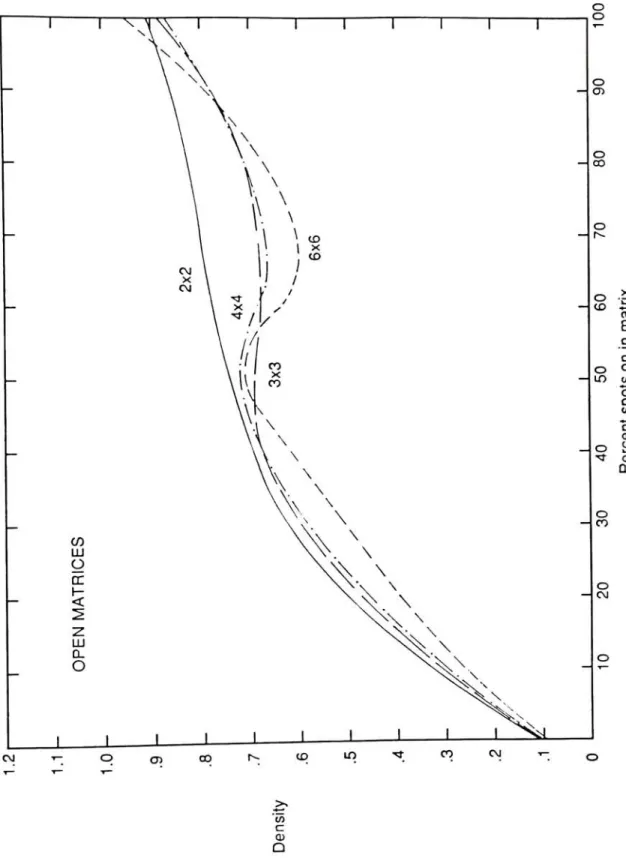
Toneproduction curves were producedfor
2x2, 3x3, 4x4, 5x5, 6x6,
and8x8matrices.Withineach ofthesematrix structurestwodotformswerecompared: open and
condensed.Thesetests were run onPaperC. Thegraphs ofthese testsappearonpages35
to40intheAnalysissection. (Thegraphs record
density
onthey-axisandnumberofspots ondivided
by
totalspotsinthematrix onthex-axis.)Severaltrends becomeclear.Thecondenseddot
forms,
Figure11,
tend toproducea slight s-shaped curvethatbecomeslessandlessaccentuated as thematrix sizeincreases.
Conversely
theopendotforms,
Figure
10,
produces an exaggerated s-curvethatactually developsahump
nearthe50%spots on region.
Density
continuestodrop
untilaround70%. Thiscurvebecomesmoreexaggeratedas matrix sizeincreases.
Toneproductioncurves were alsoproducedforthediamond dot forms. These dot
forms(see Figure
12)
produced curves quitesimilarinshapetothecondenseddotforms(ie.,slightly
s-shaped.)Themidtones(fromapproximately 30%to70%)
are coveredby
lowerandlower densitiesasthenumberof spotswithinthediamondmatrixincreases.
Wheredirectcomparisonispossible(see
below)
itcanbeseenthateventhoughthesamepercentageof spots are oninthematrix,alarger
density
is achievedwherethematrixTable 3 Comparisonoftestsquares with50%spots on
Spotson
Density
MaximumDensity
AdjustedDensity*2/4 .71 .93 .76
4/8 .63 .85 .74
6/12 .56 .95 .60
8/16 .49 .89 .55
12/24 .47 .94 .50
18/36 .42 .91 .46
32/64 .45 1.15 .39
?Forthepurpose ofcomparison,the
density
isadjustedto themaximumdensity
achieved
by
theLaserWriteron a givenday.Allofthedensitieshave beenadjustedtoa maximum
density
of1.00. Inthecase of2/4spots onthismeansthatthedensity,
.71,ismultipliedby
1.00/.93togive an adjusteddensity
of.76.Theassumption madehere isthatifthe
density
had been1.00,
the2/4 stepwouldhavebeen.76.Yeteven withoutadjustingthe
density
thereisa gradualdeclineindensity
asthenumber of spotsincreases.
Thedotshapes usedforthis testwerethe
8,
12 and24 diamondshape,andthe2x2, 4x4,
6x6and8x8condenseddotshapes.Theopendotshapes at
50%,
sincethey
are allcheckerboards,are all quite similar.
They
averageat about.82adjusteddensity.Microscopic Studies
Microscopicmeasurements weremadetodeterminetheactual size ofthedot. The
markingsin theeyepiece were adjustedtobeequalto through theuseofthe zoom
adjustment. Theactualdotsare quiteirregular innature(see
below),
sothesediameter3 units =
Figure8- Irregular
nature ofthedot
Thecriterion used wasthatthebulkofthedotshouldfallwithinthestated
measurementMeasurements weremade on
2x2, 3x3, 4x4, 5x5, 6x6,
and8x8 matricesusingthe testsquare whereonlyonespotinthematrix was on.Inthismanner,thevariable
betweenthe testsisthedistancebetweenadjacent spots. Itshould alsobenotedthatasthe
dotscome closer and closertogether,the
irregularity
inthedotshapeincreases. Themeasurementsfortheindividualspots are asfollows:
Table 4- Dot
size measurement
Matrix
2x2
3x3
4x4
5x5
6x6
8x8
Diameterofthedot
Ameasurementwas also made ofthe2x2opendot formwheretwoout offourspotsare
oninthematrix.Thischeckerboardpatternhasquite anirregulardotwhichmakesexact
measurement
difficult
howeverthediameterisnogreaterthan.003".Graphically
thedata5x5 4x4 3x3 2x2 2x2
*
?
Side
of boxequalsFigure9
-Illustrating
dotsize(Thesecond2x2matrix representsthe twospots on situation.Ineach case thenearest
adjacentdotsare alsoshown.)
The accuracyofthemeasurements wastested
by
measuringthedistance betweenthedotsandcomparingitwiththeknown linescreenvalues:
Table5
-Testing
theaccuracyofthemicroscopic measurementsDistance betweenspots(midpointto midpoint)
Matrix Measured Calculated
2x2
3x3
4x4
5x5
6x6
8x8
Microphotographs weretakentogive avisualillustrationofwhatis
happening
atthelevelofasinglespot.Thephotos areshownon pages41 to49.
They
have beenmountedon a gridtoillustratetherelationship between thespot andthematrix. Thephotos were
shot at amagnificationofapproximately80x (one inchonthephotographisequalto
.0125").Thephotos willbe
discussedintheanalysissection,butpleasenotetwo things:
first
therelativesize of anindividual spotandsecond, therelationofthematrixtothePaperTests
Twofactorsrelatingtopaper weretestedas part ofthisresearch.The firstisthe
ability toachieve ahighmaximumdensity.Thesecondistheabilitytoproduceatonal
curvethrough a range of grays.
Maximum
Density
Tests- Thedensity
testconsisted oftakingdensity
measurementsfrom 12solidblackpatches,aswellasrecordingthe
density
ofthewhite ofthepaper.Threesheets were runforeach paper sample.Theresults werethenaveragedand shown
below (rankingsareinparentheses):
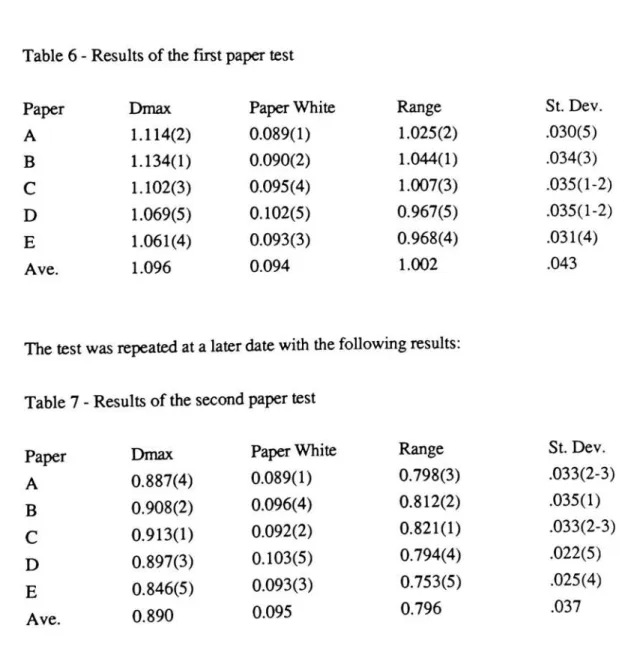
Table6- Resultsofthefirstpapertest
Paper Dmax Paper White Range St. Dev.
A
1.114(2)
0.089(1)
1.025(2)
.030(5)B
1.134(1)
0.090(2)
1.044(1)
.034(3)C
1.102(3)
0.095(4)
1.007(3)
.035(1-2)D
1.069(5)
0.102(5)
0.967(5)
.035(1-2)E
1.061(4)
0.093(3)
0.968(4)
.031(4)Ave. 1.096 0.094 1.002 .043
Thetestwas repeatedat alater datewiththe
following
results:Table 7- Resultsofthesecond papertest
Paper Dmax PaperWhite Range St. Dev.
A
0.887(4)
0.089(1)
0.798(3)
.033(2-3)B
0.908(2)
0.096(4)
0.812(2)
.035(1)C
0.913(1)
0.092(2)
0.821(1)
.033(2-3)D
0.897(3)
0.103(5)
0.794(4)
.022(5)E
0.846(5)
0.093(3)
0.753(5)
.025(4)Ave. 0.890 0.095 0.796
Itis
interesting
tonotethat themaximumdensity
achieved ontheday
ofthefirsttestis 1.096comparedto0.890onthesecondday. Eachtestrepresents,inthecase of maximum
density,
36measurements(gleaned from 108 actual measurements onthe36squares.)
Gray
Production Test- Totest theabilityof a papertoproduce grays(andalsoto
gaugetheamount of
filling in)
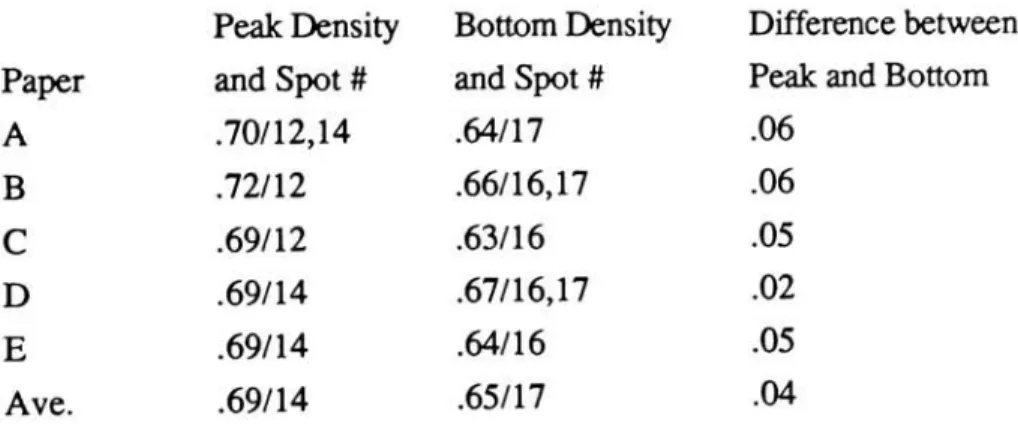
anothertestwas run. The 5x5open matrixpatternwasrunthreetimeson each paper.
Density
measurements weretakenand averaged. Sincethisparticulardot formationformsa characteristichump-shapedtoneproductioncurve, itwas decidedtocomparethepoints wherethecurve peaks and whereitreachesthebottom. Thesepeaks,bottomsandcorrespondingspot numbers are recordedbelow:
Table8- Resultsofthethirdpapertest
Peak
Density
BottomDensity
Difference between Paper andSpot # andSpot # PeakandBottomA .70/12,14 .64/17 .06
B .72/12 .66/16,17 .06
C .69/12 .63/16 .05
D .69/14 .67/16,17 .02
E .69/14 .64/16 .05
Ave. .69/14 .65/17 .04
Thisparticulartestwillbeofimportancenotonly in
determining
a paper'sabilitytoreproduceatonecurveaccurately, butalsotoget alookatthenature ofthis hump/bottom
phenomenon. Thisis becausetheaverages oftheresultsof all papersshowthat
steps 14
and 17arethekeysto solvingthepuzzle.Thenatureofthegrayproduction willbe discussed
by
theuseofseveral methodstogradetheproductionofgrays.Referto the Analysis section,page32 foranexplanationofthesemethods.Table 9- Overview
of papercharacteristics
A B C D E
Weight(in
lbs.)
20 24 24 20 20Opacity
87 90 92 86+ 85+Brightness 89 89 90 85.5 91
Brightness* 89
93 89.5 85 90
?brightnessmeasurements made on aPhotovolt Model 670reflection meter(the
CHAPTER
SEVENANALYSIS
Thissectionis divided intothreeparts: toneproduction,microscopicstudies,and
papertests.The datafromtheResultssectioniscontainedintheAppendices.The data has
beenusedtocalculatemeans andstandarddeviations. Theraw
data,
alongwiththemeansand standarddeviations isshownintheseAppendices. Graphs havebeen drawnto
illustratesome ofthedata. Thegraphs are on pages35 to40attheend ofthischapter.
ToneProduction
Thebulkofthissection consists ofthegraphical representation oftheResults
section. Figures 10through 15are graphs ofthetoneproduction curves.
Density
isrecorded onthey-axis while percent of spotsoninthe matrixisrecordedonthex-axis.
Percentof spots on inthematrixsimplyisa calculation of spotsondivided
by
spotsinthematrix. Forexample,one spot onina25spotmatrixyieldsa valueof4%spots oninthe
matrix.Wherecertain curveswithinacategory showed greatsimilarity (asis thecaseinthe
diamondmatrixforexample)onlyone curvewas showntopreservetheclarityofthe
graph.Forexample, the 12 diamondand 13 diamondareverysimilar andthereforeonly
the 12diamondisshown on the graph (thesameistruefor 24and
25,
only 24 diamond isshown.) This adjustmenthas beenmadein figures 10through 12.
Agoodcomparisoncanbemadeofthe25
diamond,
5x5condensed andthe5x5open matrices since
they
allcontain25 spotswithinthematrix. Forthisreasontheyhaveallbeenshowntogetherin figure 13. Thecurvesinthegraphs havebeen drawnto
representthedatapoints.Itshouldbenotedthatinthematricescontaining fewspots
(ie.,
2x2, 3x3,
5diamond)
thismeansthat thecurvehas been drawn using relatively few datapoints.Nocurves aredrawn in figure 14. Allthedatapoints are showntoillustratethe
unevennature ofthedata. Column breaksare showntoshowtheeffectthatpagelocation
hasonthetest.Inthe8x8 test, 24testsquaresfiton a pagein fourcolumns of sixsquares
each. Threepageswere requiredtofitalltestsquares. 8x8openisrepresented
by
and8x8condensedisrepresented
by
"c's". Wherethevalues arethesame an"x"
appears.
BartlesonandBrenemanvalues were usedtocreatetheidealtonalscalein Figure
15. Thissystem relateshumanperceptionto
density
values.Inthismanner,stepsofequalvisualdifferencecanbecreated.
Therefore,
ifthemaximumdensity
ofthe8x8condensedmatrixis 1.
15,
anidealcurve of65steps canbecreatedusing 1.15as the maximumdensity
and0.10astheminimumdensity. See AppendixD,
page84 forcalculations andanin-depthexplanation.
MicroscopicStudies
Themicroscopic measurement results are shownintheresults sectionintheir
entirety.No furtheranalysishasbeenperformed onthisdata.
Themicrophotographs have beenmountedongridswhichrepresentthematrices on
which
they
arebuilt The"x's" representthespotswhichare on. Figure 16 includesamicrophotograph of parallellinesattheirfinestresolution(thereisnounderlyingmatrixfor
this.)
Figures 17through22shouldbeviewedas a series.They
allrepresentthe5x5openmatrix with anywherefromoneto24spots on. Figures 18and21 are remarkablefortheir
similaritythough 18 has six spots on while21 has 18spots on. Figure 23representsthe
12spots on square ofthe5x5condensed matrix.Figure 24represents 12 spotson,inthis
caseinthe25 spotdiamondmatrix.Both23and24shouldbecomparedtoFigure
19,
sinceineach ofthesecases 12out of25 ofthespots areoninthematrices.
Paper Tests
Appendix
B,
page74,
givesthefullextent ofdataand calculations.The grayproduction part ofthepapertestsrequiresan analysis todetermine how manygrayswere
produced.Therearecertainly many waystodothiskindof analysis.Theauthorhas developedthreemethods of
doing
thisand eachwillbe lookedat separately.First,
it ispossibletomeasurethenumberoftimes thatavalueofagivenstepislessthanor equalto theprevious value.
Certainly
ifavalue inanascending gray scaledoesnotexceedtheprevious valueitcannotbeconsideredaseparategray. ThismethodwillbecalledMethod
One.Anothermethod wouldbetocountthenumberoftimes that thevalue of a givenstep
doesnotexceedthehighestpreviousvalue.Thismethod will accountfor dips ina curve
(likeintheopencurves) where valuesmay be ascending but have actuallybeenexceeded
countingthenumber oftimesthat thevalue ofanystep inthe testisrepeated.Thismethod
willbereferredtoasMethod Three.Toreview:
MethodOne
-thenumber oftimesthatthevalue ofa givenstepislessthanorequal
to thepreviousstep
MethodTwo
-thenumber oftimesthat thevalue of a givenstepis lessthanorequal
to thehighestprevious value
MethodThree- the number oftimes that thevalue of a
steprepeats
Thesecalculations havebeenmadenotonly forthepapertests,butalsoforthe tone
LU
o
DC
h-<
LU
D-O
o o
o a.
o CO
o
o (o E c c o o ID W O Q. l/>
OJ O ^r cj 0_
o co
o CO
rtJ I
CM
t-<J> 00 to to CO CJ
to QJ
D
Figure 10 - Graphof
2x2, 3x3, 4x4,
and6x6co hi o cn h-< D LU CO -z. LU D O o
J I I L
o a. o oo o X to -rt rt* ro E c c o o u. to c> Q. to c OJ o y rtf OJ 0-o CO o C\J CJ
T-Oi CO to io CO CM
-to c
OJ O
Figure 1 1 - Graphof
2x2, 3x3, 4x4,
and 6x6CM PcDooi^-to-O'-;
c0.CN.,r"-cz
CD D
Figure 12- Graphof
5, 8,
12,
and24diamondo Q-00 in CM CD 2 2 O O C/0 LU o cc h-< o o CD O CO o to ~ ro o o -m o Q. V) C CD O ^ ^ CD CL O CO o CM
1 I I L
CM
t-CD oo r^ co io CO CM
to c CD Q
Figure 13 - Graph
o u o CO O O o o o o o o o o CJ o O o o o u o u u o CJ o o o o u o u o cj o o o u CO o CJ o o u o o CJ o o o o o u <J o o o D LU
00 . .
7- c
III rti
Q or
S <<o O C/J UJ o V) O ro z cc OJ
<. < c z rt E
UJ m 3
LL V O
u oo u
o o u o u o o o o CO "o CJ u Irt) o o o o o o OO CO -CD Ol ro CL CM CD ro Crtrtl. <D O) ro a. CJ o o OO CO OO o o o o o 05 o CO o o co o CO o CM ro E o <r> O Q. to CD CJ krt Q) 0. CM
t-O) oo CD IO CO CM
to c
CD Q
Figure 14- Graph
-O
LU 00
z
UJ UJ _J Q
< z
o
00 o
o
_l
<
z
oo
X
CO
u
1- 00
rtrt-J
<
LU
Q
00
cc
UJ
>
1 I
CM cn oo to m CO CM
c CD
O
X
X
X
it
<
X
X
X
X
X
X
X
x:
e
E
x
k. ^rtk. rtrtAk.__*^ ... ^rtrtrtrtirtk.^^^fc.^^rtrtirtk.^'_ k.^jLrt<rtk^rtirtL^ikv. .^^rt*rtk.^^rtrt*k.^"rt^fc.^F^W^^rti rtk.^^rtrtrtk^^^fc.^ik.VAl^^r.
***
?!-?!
?>:
?>T.tt.>:
.*T<iT
*_;?::?:
*l*
?!<>*.**>*
a<
?X*>>5
&2&3Z
CHAPTEREIGHT
DISCUSSION
Thischapteris divided intothreesections:tone production, microscopicstudies and
papertests.
ToneProduction
Forthisdiscussionplease refertoFigures 10through 15on pages35to40. An
inherentcharacteristic ofthecurves oftheopen matricesbecomesclearin Figure 10. The
curve (of6x6 forexample)reaches aninitialpeakatabout50% spots on andthendrops
until 70%spots on at which pointitincreasesagain.This isapparentin Figures 13and 14
as well.Thecurves ofthecondensed matrices ontheother
hand,
tend towardan s-curveshapewhichisrelatively flat inthe midtones.The diamondmatricesare quite similarto the
condensedas agroup (seeFigure 12).Thethree typesofcurves canbecomparedin
Figure 13.
Clearly
themoststriking aspectofthisgraphisthehumped-shapeofthe5x5opencurve.Itmightbesurmisedthat theopenmatriceswouldfill in causingtherapidrise
indensitiesshown;howeverit iscuriousthatthedensities decreasepast50%as more
spots are added. Thisquestionisanswered
by
themicrophotographs andwillbe discussedinthemicroscopic studiessectionofthis chapter.Rememberin
looking
atFigure 13 thattheopenand condensed5x5 matricesdiffer only inthewaythespots are configured.
Thegeneralshape of open versus condensed curvesiswelldocumented in Figure
14.Inaddition, theinfluenceof pagelocationisindicated
by
themarkingofthecolumnchanges.The datapointsdonotformaperfecdy smoothcurve.Inpartthisiscaused
by
thecolumn changes.
Note,
inparticular,page3,
column 1 wherebothopen and condensedrise
by
considerable amounts.Thesameistruetoa somewhatlesserextentinpage3,
column2. This emphasizesthepoint madeinthe
Methodology
section, thatis,
thatpagelocationplays alargeroleinthe
density
ofagiventestsquare.Thefinalgraph,Figure
15,
comparesanideal BartlesonandBrenemancurveto thefacts
shouldbenoted.First,
the8x8
condensedmatrix represents alinescreenof37.5which while
affording
numerous grays,sacrificesdetail. Secondofall, the8x8curveistoosteep inthe
highlight
andshadow,andtooflatinthemidtone.Thismeansthat themidtoneareafromabout.3to.6in
density
(
a range of.3)iscovered
by
moregrays thantheentire rest oftherange(about.75).Lastofall,duetothedigitalnature ofdigital
halftones,
thefirst few steps are of greater magnitude thantheonesthatfollow. Thevaluesof
0/25,1/25,2/25,3/25
and4/25 are asfollows:0.10, 0.14,
0.17, 0.19,
and0.20.Ideally
thesteps mightbe
0.10, 0.12,
0.14, 0.16,
and0.18. Ifthiswerethecase, therewouldnotbesuch alarge
jump
fromthepaper whitetothefirstgray.In addition,itwouldfacilitatethespreadingout oftheflatareainthemidtone.Theseconditions,
however,
aredifficulttoachieveinadigitalhalftone.Rememberthat theaddition ofa spotwithinthe
matrix will make a greaterdifferenceif very fewspots arealreadythere.Forexample,
fromoneto twospotsthereis a100% increaseinthenumber ofspots,fromtwo tothree
onlya50% increase and so on.
Pulling
data fromthevariouscurvesthefollowing
comparison canbemadebetweenall ofthedatapointsatwhich50%ofthespots are on(see
Results,
page26):Table 10- 50%spots onwithinformation concerningareabetweenspots
Spotson Area betweenspots Docomerstouch? Adjusted
density
2/4 2units Yes .76
4/8 4units Yes .74
6/12 6units Yes .60
8/16 8units No .55
12/24 12units No .50
18/36 18 units No .46
32/64 32units No .39
Eventhoughthesame percent of spots areon,itisclearthatthe
density
increasesas theareabetweenthespotsincreases.
Why
shouldthisbe? Therearecertainly manyfactorsatplay
here,
twoofthembeing
laserspot size andtheamount of overlap. Onepossibleexplanationis thatastheline ruling
increases, toning
willbelesslikely
inthenon-imageMicroscopic Studies
Themicroscopicmeasurementsrevealthat thediameterof adot consistingof a
single spot remains at aconstant untilthematrix sizeisreducedto4x4.Atthatpoint
thedotcontinuestoshrink untilit
becomes
soirregularthatit is difficulttomeasure.Thisdestruction
oftheunitbuilding
blockof ahalftone
isof utmost concerntodesignersofdigital
halftones.
Forthe
following
discussionofthemicrophotographsplease refertoFigures 16through
24,
pages41 to49. Figure 16isa goodillustrationofthemannerinwhichtonerfillsinthenon-imagearea.ThesearethefinestparallellinesthattheLaserWritercan
create.Ina unit
inch,
onehundredandfifty
oftheseblacklineswouldbe borderedby
onehundredand
fifty
whitelines.Ifitwere possibletooutputthis imagetophotographic paperthenature oftheimagewouldbemuchdifferentThespread oftonerwould notbea
problem andthedefinitionoftheedge wouldbemuchfiner. Thishigherresolutionis
reflectedinthehighercost of photographic paper andfilm.
Thenextsequence,Figures 17through
22,
isofinterestforseveral reasons. Notethedecreaseinspot sizebetween Figure 17and 19. The individualspots are visiblein
Figure 19andhaveshrunkenremarkablyas comparedtoFigure 17. Figures 18and 21
make another
interesting
comparison.Ineffect, six spots (in Figure18)
dotheworkof18spots(in Figure21).This isdueto toner
filling
inthenon-image areainFigure 18. Tonerfalls intothenon-imagearea;however becauseit issurrounded
by
moretonerthathasalreadymadeits wayto theimagearea,itcan't makeitswayoutandisultimatelytrapped.
The
hump
shaped curvein Figure 13canbeexplainedwiththe microphotographs.Figure 19representsthepeakofthe curve,Figure 20representsthepoint
immediately
after.Figures 19and20illustratethedecrease in
density
thatoccurs.Notehow Figure 20appearslighterthanFigure 19eventhoughan extra spothasbeenadded. Whatappearsto
be
happening
hereis that theextraspot,whichissurroundedby
fourotherspots,forms alargecharged areawithitsneighbors.Thischarged areaappearstodrawthetonerfromthe
non-image area
thereby
creatingahigher density. Thisextraspothastheeffect ofcleaningupthenon-image area ofstray toner; howeveritalsoappearstomakeitmoredifficultfor
tonertobeattractedto theimageareasthatareisolated.Thisprocess continuesuntilthis
largecentral charged areahasbecome largeenoughitselftobeginanincreasein
density
(seeFigure
21.)
ItissurprisingthattoreachFigure21 it is necessarytopass throughtoeach otherinsequence, andyet, thecentraldot in Figure 18 virtually decomposes before
being
built
upagain in Figure 21.Figure
22represents one spot short of a solidblack.Notethat thesize oftheopen
(non-image)
areais quite similarinsizetothatoftheimageareain Figure 17.
Figures
19,
23 and24make aninteresting
comparison of25 spot matriceswith 12spotson. The resulting densities (.42
diamond,
.53 condensed,and.88open,refertoAppendix
A)
show adifference
thatisalso quite visible onthemicroscopiclevel. In Figure19,
theopen areas betweenspotshave filledintoa great extent In Figure23thegreatestamount offilling-intakesplace atthepoint wherethehalftone dotsare endtoend. In
Figure24the
halftone
dots onlyapproach each other atthecomers andit isatthesecornersthatsomefilling-intakesplace.This limited filling-inthat takesplaceinFigure24isa
result ofthescreen anglethatexistsinthe25diamondmatrix. Thisisanimportant factor
to
keep
inmind whiledesigning
matrices sinceitcanbeusedtocontrolfilling-in. Thesemicrophotographsshowthatconfigurationwithinthe matrix, and, theshape ofthematrix
itselfplayalargeroleintheresultingdensities.
Paper Tests
Maximum
Density
-Achieving
ahighmaximumdensity
isimportantintoneproductionsinceitallows a greater range of valuestobecovered
by
various grays. Alowmaximum
density
willcompress thegrayscale sothatadjacent graysbecomemore similar.Theotherfactorinrangeistheminimumdensity. What is
being
comparedinthispapertestistherangefrommaximumtominimumdensity. InthefirsttestTable
6,
page 29thepapers are ranked
by
rangeinthefollowing
order: BthenA,
C, E,
andD. Itwouldbestatisticallypossibletojudgetheaccuracyofthisrankinggiventhemeans and standard
deviations.
However,
thesecondtest,Table7,
page29,
gives arankingofCthenB, A,
D,
andE. This rankingthrowssomedoubtontoanyjudgementsof orderthatmightbedrawn fromtheserankings.Itshouldbenotedthatonthe
day
ofthefirst test,theaveragemaximum
density
was 1.096while ontheday