Received19April2017 Revised12September2017 Accepted12September2017 Corresponding author
A. Wodehouse
Published by Cambridge University Press
c
The Author(s) 2017 Distributed as Open Access under a CC-BY 4.0 license
(http://creativecommons.org/ licenses/by/4.0/)
Des. Sci.,vol. 3, e16 journals.cambridge.org/dsj
DOI:10.1017/dsj.2017.19
The generation of problem-focussed
patent clusters: a comparative
analysis of crowd intelligence with
algorithmic and expert approaches
Andrew Wodehouse, Gokula Vasantha, Jonathan Corney, Ross Maclachlan and Ananda Jagadeesan
University of Strathclyde, Design, Manufacture and Engineering Management, Glasgow, United Kingdom of Great Britain and Northern Ireland
Abstract
This paper presents a new crowdsourcing approach to the construction of patent clusters, and systematically benchmarks it against previous expert and algorithmic approaches. Patent databases should be rich sources of inspiration which could lead engineering designers to novel solutions for creative problems. However, the sheer volume and complexity of patent information means that this potential is rarely realised. Rather than the keyword driven searches common in commercial systems, designers need tools that help them to understand patents in the context of the problem they are considering. This paper presents an approach to address this problem by using crowd intelligence for effective generation of patent clusters at lower cost and with greater rationale. A systematic study was carried out to compare the crowd’s efficiency with both expert and algorithmic patent clusters, with the results indicating that the crowd was able to create 80% more patent pairs with appropriate rationale.
Key words:patents, design knowledge, information processing, crowdsourcing, design process
1. Introduction
Patents not only provide intellectual property (IP) protection, but are an extremely valuable source of information. They can be freely used by designers to review solutions to comparable technical problems, draw inspiration for new areas of research, identify trends and development in the field, examine competitors and their activity, acquire technologies to licence or use freely, and avoid unintentional duplication of research. While they relate to all aspects of the innovation ecosystem (Luo2015), in reality, for designers, they have most often become a checkpoint in the design process rather than a resource to be utilised in support of design activity.
This is partly attributable to the size and complexity of the database. Given that there are now over 50 million online patent records instantly available, and with the global growth in patent applications at more than 7.5% (World Intellectual Property Organization2016), effective navigation of these has become increasingly difficult. Additionally, the language and presentation of patents has
evolved to suit the legislative and bureaucratic requirements of the patent system – they are not engaging documents written and presented in a way that is useful to a designer. The abstract and main image are the main areas for interpretation, but nevertheless the pertinent inventive detail can be difficult to infer from these abbreviations. There is a lot of variation in writing style which is often impenetrable to the average reader. Finally, the aim of the patent system – to encourage innovation by providing a period of protection for a fixed length of time, and thereafter sharing the information across society for its greater benefit – has been hijacked by companies utilising patents purely for commercial purposes. Practices such as ‘thicketing’ (deliberately stifling innovation in an area by filing a series of blocking patents) and ‘trolling’ (attempting to enforce rights against infringers beyond a patent’s value or contribution) have distorted the innovation economy to the point where they have become synonymous with the widely reported ‘patent wars’ (Moser2013). In essence, the translation of patent documents into practical design ideas or requirements is not easy.
We have identified crowdsourcing as a way to potentially address some of these concerns and to provide an economic, scalable way of collating and applying appropriate taxonomic information that could reclaim the patent database as a source of engineering design inspiration. Crowdsourcing is the process of obtaining information or input from a large number of people to complete a task. Key components in crowdsourcing workflows are repletion (i.e. multiple, parallel tasks to generate sets of ‘answers’), peer review and merger, iteration, and the linkage of payment to quality assessments.
In assessing the viability of its use in the design context, the key question is whether crowdsourcing offers any benefits when compared with other approaches. To this end, we have focussed on the use of the crowd in patent clustering, as this is an aspect of analysis where the need for insight and interpretation has proven challenging for computational approaches. We have performed systematic benchmarking, including comparative analyses of the crowd with computer algorithms, design experts and commercial landscaping software to assess the benefits. This incorporates and builds on data from previous work on computationally structured databases, our aim being to provide a clear basis for moving forward with this approach as well as to establish continuity in this line of investigation in the literature.
1.1. Foundational research
In previous work, we have reported on two experiments to establish basic crowd capability. These included a patent textual information categorisation task and an exercise that required the interpretation of patent drawing information (Vasantha
et al.2016). The key conclusions included the following:
• a large crowd of people from many countries is available on demand to undertake posted tasks;
• completion time is quick, although it is dependent on the inclusion of test questions;
Figure 1.Overview of project themes for patent analysis.
• clear task instructions, test questions, and payment for each task can play a role in getting acceptable responses;
• the best workers should be chosen through initial tests, then nurtured for higher-reasoning patent analysis tasks.
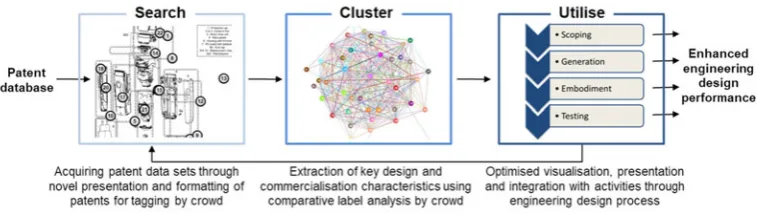
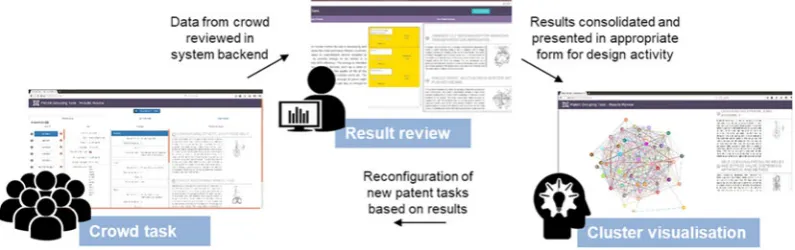
While there are clear challenges in designing task protocols and managing effective workflows for the crowd, these initial findings have provided us with sufficient encouragement to progress to more formal analyses. Our research has identified three key themes in relation to patents in design: finding relevant patents (searching), organising groupings in relation to particular problems (clustering), and applying these in design activities (utilising), as illustrated in Figure1. Clustering of patents relies on insight and judgement to create meaningful interpretations, and as such is challenging to achieve using computational approaches. This has therefore been the theme that we have focussed on through the implementation of a crowd-based approach.
2. Patent clustering
Patents are often used to assist with technological forecasting (Jinet al.2015; Kim & Jun2015) and the identification of opportunities for development (Trappey
et al. 2014). However, there is limited research on how patent clusters can be presented to support design activity. Kitamuraet al.(2004) outlined the possibility of creating patent maps of functional decomposition to be used in design reviews as a means to link design functions to patents. A limitation is that the proposed software requires the user to detail function decomposition trees on a graphical user interface. Vandevenneet al.(2016) proposed a scalable search for systematic biologically inspired design. This utilised functional characteristics to identify candidate products for design by analogy, thereby increasing the variety and novelty of ideas subsequently generated (Verhaegenet al.2011). They outline challenges in interactive result filtering and classification in successfully extracting knowledge from the patents. Fuet al. (2014) presented a method for finding analogies based on a functional vector space representation (Murphyet al.2014) from patent databases to assist designers. The results demonstrated improved novelty (but no change in quantity) in design solutions subsequently generated. Together, these results indicate that there is potential within the patent database to support enhanced ideation. The rest of this section addresses in more detail
the principles and issues that can be applied to clustering, with a view to applying these in the most appropriate way to the design context.
2.1. Clustering principles
Patent clustering aims to develop meaningful patterns for identifying dominant technologies, forecasting future technological trends, detecting patent infringe-ment, and identifying technological vacuums. It is carried out using structured (e.g. inventors, granted date, etc.) and/or unstructured patent data (free text; e.g. claims, description, etc.). It is clear that although computational algorithms are maturing, human intervention remains essential to bring insight to patent clusters: several authors have emphasised that human expert judgement and outcomes are safest and most accurate on patent analysis and clustering (Fantoniet al.2013; Parket al.2013). Moreover, given its importance in the visualisation of patents, the current reliance of computational approaches on the International Patent Classification (IPC) classes is unsatisfactory and can result in landscapes that lack meaning or require further interpretation to be useful (Widodo & Budi2011).
The major processes involved in algorithmic clustering are text mining (to extract useful information from the patent corpus) and grouping (to identify similar patents based on structured information received from the text mining step). The key objective of text mining is to extract and classify information that provides some kind of structure for further analysis. For example, function, behaviour and structure (FBS) is one such classification used for text mining purposes (Yan1993). Key requirements for patent text mining are that all patent texts are coded appropriately using a chosen classification mechanism, with steps taken to ensure consistency in applying the established definitions and relationships. Patent grouping is concerned with maximising the similarity within clusters (i.e. homogeneous, with minimal intracluster distance) and the diversity of patents between clusters (i.e. heterogeneous, with maximum intercluster distance) (Yoon & Park 2004). There are various measures for likeness, such as Euclidean distance (Widodo & Budi2011), similarity measure (Widodo & Budi2011), silhouette measure (Jun et al.2014), cosine angle (Fu et al.2011) and Hamming distance (Xuet al.2013). Table1summarises various algorithmic approaches used in the text mining and grouping processes.
Keyword and K-means are the popular approaches used in text mining and grouping respectively. The frequency-inverse document frequency (tf-idf) is often used for determining the importance of words and keyword extraction in text mining (Kukoljet al.2012). Commonly, a binary patent-keyword/similarity matrix/noun–verb matrix is provided as an input to the K-means clustering approach (Suh & Park2006; Parket al.2013). Indeed, various combinations of the text mining and grouping approaches highlighted in Table1can be utilised to find an appropriate clustering process and outcome. Even in doing so, however, there are persistent issues that have been highlighted in the literature.
2.2. Clustering issues
Table 1.Summary of text mining and grouping approaches to patent clustering, with highlighted references
Text mining Authors
Functions, behaviour and structure (FBS) Fantoniet al.(2013)
Keyword Yoon & Park (2004) and Leeet al.(2009)
Ontology Trappeyet al.(2009) and Jeong & Kim (2014)
Singular value decomposition (SVD) Ryleyet al.(2008) and Junet al.(2014)
Subject–action–object (SAO) Yoonet al.(2012) and Parket al.(2013) Technology and effect matrix Xuet al.(2013)
TRIZ Liet al.(2014) and Huanget al.(2015)
Vector space model (VSM) Zhang & Zhu (2010)
Grouping Authors
Bayesian inference Fuet al.(2013a,b,c)
Density-based clustering Igami (2008) and Leeet al.(2015)
Fuzzy clustering Dereli & Durmuşoğlu (2009) and Moehrle & Passing (2016)
Hierarchical clustering Parket al.(2011) and Widodo & Budi (2011) K-means algorithm Suh & Park (2009) and Trappeyet al.(2014)
Neural-gas Kukoljet al.(2012) and Dražićet al.(2013)
Re-organising neural network clustering Kukoljet al.(2012) and Liet al.(2014)
Self-organising maps Yoonet al.(2002), Atzmüller & Landl (2009) and Segev & Kantola (2012)
semantic similarities (Xu et al. 2013; Li et al. 2014). The WordNet database can be used to expand patent terms for synonyms, hypernyms, hyponyms and polysemy (one word having multiple meanings) matching to create a level of generalisation. However, this does not contain all of the domain-specific technical terms (Choiet al.2012; Parket al.2013; Abbaset al.2014). The implicit domain knowledge that is not mentioned in patent documents is missed in cluster analysis procedures (Fuet al.2013b). Since the importance (weightage) of words is given to frequently occurring terms (Tekicet al.2012), there is a high risk that less-frequent but important terms are not given due attention in the analysis process (Park
et al.2013). It has been emphasised that frequencies and co-occurrences of the patterns may not reflect substantial characteristics of inventions (Yoonet al.2012), and are unable to discriminate noise from information (Ryleyet al.2008), and that keyword vectors cannot reflect structural relationships among technological components (Trappeyet al.2009; Parket al.2011).
In terms of grouping, it is difficult to choose the appropriate technique for a specific task; evaluations have pointed out that the efficiency varies widely for different data sets and approaches (Kukolj et al. 2012; Segev & Kantola 2012), and that tested cluster similarity scores are not high (Widodo & Budi 2011). Typically, computational grouping is carried out by the relative distance between text mined data from compared patents, so outcomes do not provide clear categorical clustering (Trappeyet al.2010), which is required to navigate effectively among patents. Most of the clustered outcomes do not clearly establish cluster meaning or provide valuable labels for each cluster (Yoon & Park2004;
Spangleret al.2011; Xuet al.2013). Additionally, the loss of semantic information through the translation of high-level data in patent documents into specific design functions or requirements can lead to inaccurate clustering (Fan et al. 2011; Tekicet al.2012; Abbaset al.2014) and uncertainty in establishing the distance between patents (Yoon et al.2012). Therefore, clustering techniques normally require human expert input at various stages of execution, including semantic annotation (Xuet al.2013), extracting key phrases (Kimet al.2008; Trappeyet al. 2011; Choiet al.2012; Parket al.2013), removing irrelevant SAO structures (Choi
et al.2012), defining clusters at each iteration (Junet al.2014), validating cluster labels (Fuet al.2013b), feedback for semantic recognition of keywords (Atzmüller & Landl2009), and verification (Trappeyet al.2014). Atzmüller & Landl (2009) have suggested that it could take up to ‘. . . 6–8 h of the client’s time to develop a thorough understanding of how the map can be interpreted’. This interpretive effort should ideally be carried out when the map is constructed in order to present visualisations that are clear, understandable and useful.
3. Method
We therefore performed comparative analyses of a crowd-based approach to clustering with computer algorithms, design experts and commercial landscaping software to assess its benefits. This included the use of data – a 45 patent set and different clusterings of it – from research previously reported by Fuet al.
(2013a,b,c) on computationally structured databases. Its aim was to compare the algorithm developed by the authors with the interpretation of four experts. Use of these findings has allowed us to extend the benchmarking for comparison with the crowd and with the PatentInspiration landscaping software.
3.1. Fu
et al.
’s data setThe design scenario used in Fuet al.’s work was to develop a human-powered energy generator for use in rural communities, and the set of 45 patents was selected by the authors. The patents fell across 96 cooperative patent classification (CPC) codes and 113 International Patent Classification (IPC) codes, and were in the date range of 1976–2007. All were owned by different applicants, and all were filed in the USA. A full list of the patents has been included in AppendixA.
3.1.1. Algorithm clustering
To assist designers in visualising the patent database appropriately, Fu et al.
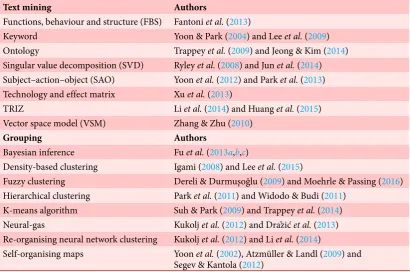
Figure 2.Patent clusters labelled using the highest average rank method (Fuet al. 2013b).
the highest average rank labelling are shown in Figure2. The black filled circle in the top left corner represents the design problem; the farthest patent relevant to the design problem is patent number 20 in the bottom right corner.
3.1.2. Expert clustering
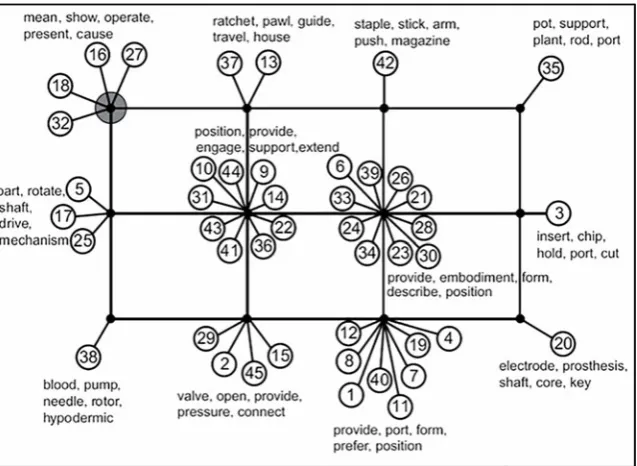
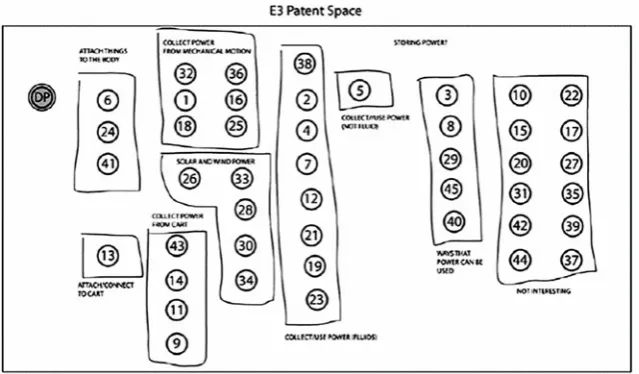
Fuet al. (2013b) presented results of patent clusters generated by four design experts for this dataset. The experts had at least 10 years of experience in the field of product design and an educational background in engineering. It was noticeable that the clusters created by the experts were all fairly distinct, with limited correlation across them. The resulting patent space generated by Expert 3 is illustrated in Figure3.
3.2. PatentInspiration landscaping software
Figure 3.The patent space defined by Expert 3 (Fuet al.2013b).
Figure 4.A patent landscape based on CPC classification codes (generated with PatentInspiration,http://w
ww.patentinspiration.com).
[image:8.493.42.442.280.540.2]3.3. Distribution of clustering task to the crowd
During the course of the research, we have developed a bespoke software platform to manage the distribution of tasks to the crowd. This was a significant undertaking but was deemed necessary, as existing crowdsourcing platform templates proved insufficient for the complexity of patent clustering tasks. As well as providing a flexible, graphic interface for workers to interact with patent sets in a more intuitive way, it allows control over backend workflows in delegating tasks to the crowd. We were able to manage recruitment and payment of workers by integrating with existing systems (i.e. Crowdflower and mTurk), as illustrated in Figure5. In working with the 45 patent set, the main characteristics of the interface presented to the crowd are the following:
• a split screen allows for scrolling through individual patents’ abstract, title and main figure (left side), and through patent clusters (right side);
• it allows each patent to be maximised to full screen view for visualising the patent abstract and image in detail;
• generated cluster labels follow the right side scroll bar to remain visible and facilitate easy patent grouping;
• it enables patents in both grouped and ungrouped clusters to be searched, with the number of matches highlighted;
• there are options for editing labels, adding comments and deleting individual patents or patent clusters.
The workflow for distributing patent clustering tasks is depicted in Figure6. The platform facilitates the presentation of the patent abstract and image in such a way that workers can easily group, label and rank individual patent groups in relation to the given design problem. This task design was deemed more efficient and effective than setting each patent pair as a discrete crowdsourcing task then synthesising to form clusters. Moreover, while Fu’s data set and other computational approaches generally use full-text analysis, it was determined that the abstract and image provided a sufficient level of detail for the crowd to review and assess patent content. The distribution of the tasks and review of the results is managed in the system backend, before being used to create clusters for use by designers. In terms of the system architecture, a variety of open-source tools were utilised. The platform was compiled using a Node.js package and a Meteor Up client deployed through Amazon Web Services’ cloud database storage. MongoDB (a document-oriented database program) was used to collect, structure and store securely all cluster information generated by the crowd. While we have been working with an initial 45 patent set, the system developed is scalable to increase the number of patents to be clustered. Since the focus of this work is to create a knowledge base that designers can browse and utilise with reference to a particular design problem, we anticipate patent sets scaling into the hundreds rather than thousands. Sets larger than this are suited to landscaping and scoping rather than interactive use. The crowdsourcing approach as detailed can comfortably scale to patent sets in the hundreds. However, if it was desired to scale into larger sets of thousands of patents, the most effective way would be to partition the task and synthesise the results from each. This is still possible but would require more time and cost.
Figure 5.Articulation between established crowdsourcing platforms and the customised patent cluster platform.
Figure 6.The workflow for assignation, gathering and presentation of crowd results.
4. Results – performance of the crowd
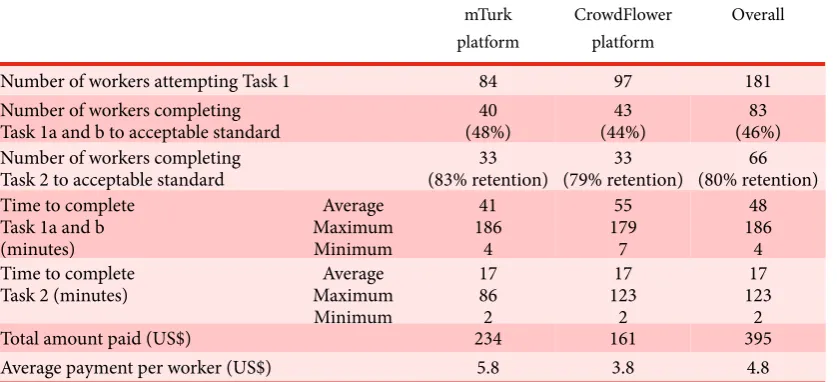
[image:10.493.42.440.278.403.2]Table 2. Participation statistics for the two crowdsourcing platforms
mTurk CrowdFlower Overall
platform platform
Number of workers attempting Task 1 84 97 181
Number of workers completing Task 1a and b to acceptable standard
40 (48%) 43 (44%) 83 (46%) Number of workers completing
Task 2 to acceptable standard
33 (83% retention) 33 (79% retention) 66 (80% retention) Time to complete
Task 1a and b (minutes) Average Maximum Minimum 41 186 4 55 179 7 48 186 4 Time to complete
Task 2 (minutes)
Average Maximum Minimum 17 86 2 17 123 2 17 123 2
Total amount paid (US$) 234 161 395
Average payment per worker (US$) 5.8 3.8 4.8
a bonus payment of up to $3 to incentivise workers to provide elaboration of their rationale for labels. Table2summarises the statistics of crowd participation using the two crowdsourcing platforms.
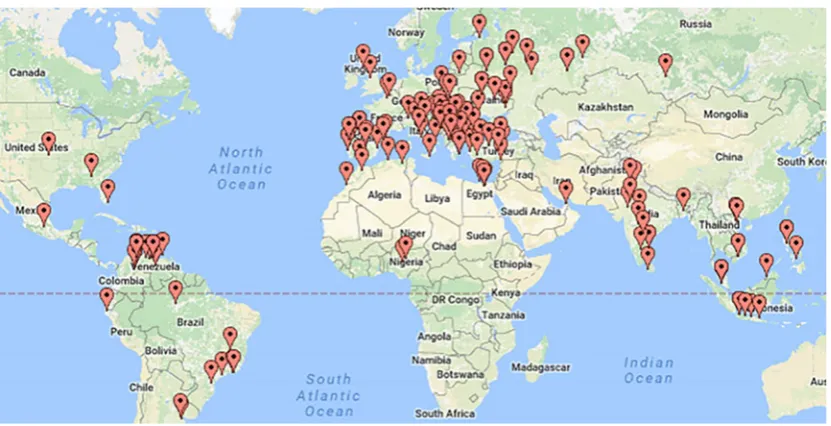
On posting the tasks, 181 responses were received, with nearly 95% of these coming within 48 hours of posting. The acceptable output percentage (all patents grouped, all groups labelled) of 45% was encouraging considering that the crowd consisted of untrained workers participating for the first time. While the rate of response to the tasks suggests that this percentage would be workable, with a curated crowd returning to complete tasks consistently, a significantly higher acceptable output percentage, and more economically efficient crowd, would be anticipated. Furthermore, nearly 80% of participants involved in Task 1 (similarity and labelling) went on to complete Task 2 (relevance rating), a positive retention rate and indicator of crowd satisfaction with the task/reward structuring. On average, crowd workers spent 48 minutes on Task 1 and 17 minutes on Task 2. This is a considerable amount of time when compared with the low-complexity tasks generally advertised, such as image tagging, collecting information from websites or categorising tweets. These generally take a couple of minutes to complete and use the standard templates available on commercial crowdsourcing platforms. Our results suggest that the crowd is adaptable towards more involved and time-consuming tasks with appropriate task formatting and reward. In our case, payment for successful completion was US$5 on average, a figure that included web platform administration charges. Figure7shows the location of participants during the tasks, and highlights the global reach of crowdsourcing platforms. While we were unable to track personal information on our platform, a recent demographic survey shows that the crowd population is becoming increasingly international, with an equal gender distribution, average age of 32 years, and almost half having graduate education (Ipeirotis2010; Rosset al.2010).
Figure 7.Location of workers participating in patent tasks (generated with BatchGeo,https://batchgeo.com).
4.1. Task 1: similarity and labelling
4.1.1. Similarity
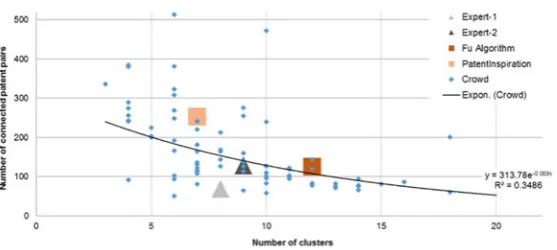
In the first part of the grouping task, the crowd was asked to create functionally similar groups from the 45 patent set, and if two patents resided in the same group – having a discernible link in functional content – they were designated as a pair. For a set ofNpatents, the number of possible pairs (P) isP = N×(N−1)/2, so for the 45 patent set, 990 pairs were possible. Table3lists the average number of clusters and patent pairs generated through the different approaches. We only used the results of two of the experts (E3 and E4) reported in Fuet al.’s work (refer to Appendix B in Fuet al.(2013b)), as the demarcations between patent groups were unclear in the clusters generated by the other two experts. We found that the average number of clusters generated by the crowd was equivalent to experts’ results. The average number of pairs identified by the crowd (164) was, however, higher than that generated by the two experts (69+128/2 = 99). If a single group has a large number of patents, this will tend to increase the overall number of pairings. For example, the maximum number of patent pairs for a clustered outcome is 513. This is due to the fact that 32 patents are grouped in a single cluster, creating a large number of pairings (496). Thus, spreading the patents more evenly across clusters will reduce the number of pairs. While one of the experts eliminated some patents as irrelevant to the design problem, reducing the experts’ average number of pairs, this practice appears to be equivalent to the crowd workers’ tendency to organise many patents into a single group. For the algorithms, it was found that Fuet al.’s identified 125 pairs and the PatentInspiration software 253. This suggests that Fu’s algorithm is more discerning than the PatentInspiration software, which relies purely on CPC/IPC classifications.
Figure 8.Number of clusters versus number of connected patent pairs for the crowd, experts and algorithms.
Table 3. Composition of clusters and connected patent pairs for different approaches
Fu’s Experts Patent Crowd (average
algorithm (average of 2) inspiration of 83)
Number of clusters 12 9 7 9
Number of patent pairs 125 99 253 164
Number of patents in each cluster
Average Maximum Minimum
3.8 10 1
4.6 12 1
7.5 18 1
4.8 32 1
approaches, bar one of the experts, follow this reasonably closely. The overall results show significant variety in patent clusters and labels, which is valuable in providing a range of insights for sifting and prioritisation.
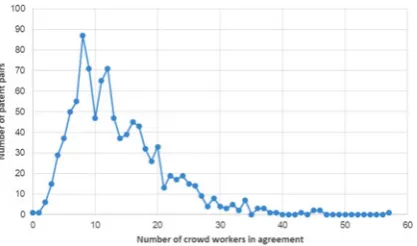
Examining the performance of the crowd in more detail, Figure9shows the frequency of agreement in patent pairings across the 83 workers, i.e. the number of patent pairs. The left of the peak can be characterised as largely speculative pairings between patents with little in common. The peak itself between eight and 12 workers indicates the greatest degree of consensus on patent pairs that are less explicitly linked. The aggregated intellectual interpretation in this region provides a degree of working confidence in the crowd insight. Moreover, to the right of the peak, we see increasingly explicit connections, with a maximum of 58 workers agreeing to a patent pair. At least one crowd worker identified a link in all 989 patent pairs (i.e. there was only one unconnected pair).
Table4describes the five patent pairs with the highest number of workers (i.e. towards the right of Figure9) in agreement in more detail. This shows that patent pairs are linked and extensively labelled by the crowd for both explicit (e.g. different valve types) and implicit (e.g. joint assembly and steering device) functional relationships. It is in the less obvious pairings that the crowd provides a distinct advantage over computational approaches. Further analysis to compare expert and algorithm outcomes with aggregated crowd results indicates that only unlinked patent pairs can be predicted with a high degree of confidence (refer to AppendixCfor Phi nominal correlation and regression results).
Figure 9.The number of crowd workers identifying identical patent pairs.
Table 4. Patent pairs with highest generated labels by the crowd compared with algorithmic and expert
assessment
Patent 1 number Patent 2 number Number of Paired by Paired by Patent Paired by either
and title and title workers agreed Fu’s algorithm Inspiration of the experts
2: Self-cleaning pressure relief and bypass valve, dispensing apparatus and method
4: Gravity feed fluid dispensing valve
57 No Yes Yes
27: Induction loop vehicle detector
32:
Accelerometer
46 Yes Yes No
28: Self-erecting loop structure
33: Shelter structure
46 Yes Yes Yes
1: Converging sphere joint assembly
43: Steering device for automobiles
45 No No No
20: Bone prosthesis
44: Dental implant hole guide extension
45 No Yes No
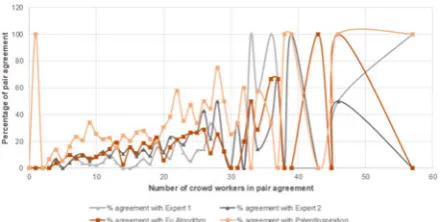
[image:14.493.43.461.237.482.2]Figure 10. Percentage of benchmark pairings identified by numbers of crowd workers.
Table 5. Distinct cluster labels generated in various approaches
Fu’s Patent Expert (4) Crowd (83)
algorithm Inspiration
Highest average rank method
Highest cosine similarity
IPC based CPC based
50 58 68 64 28 151
experts and algorithms. A fairly stable direct relationship holds until we reach patent pairs where the level of crowd agreement is 30 and above. At this point, the relationships break down. For instance, 45 crowd workers agreed on a link between a pair (1 and 43 from Table4), but experts and algorithmic approaches did not link that particular patent pair. This highlights that both algorithmic and expert approaches have overlooked patent pairs that the crowd workers identified, and supported with meaningful rationale, as relevant.
4.1.2. Labelling
The second part of the grouping task was for the crowd to create appropriate labels with rationale. Clusters require appropriate labelling to summarise their content and assist with positioning. Both algorithmic outputs (Fuet al.algorithm and PatentInspiration) produced a list of words as labels, whereas both the crowd and experts can add more context and rationale. Therefore, while a higher number of patents can be processed computationally to provide an overview of a sector or field, there is a potential advantage to be gained from human intervention in the creation of more meaningful cluster labels at a functional level. Table5sets out the number of distinct cluster labels generated in both algorithmic and human approaches, and shows that a greater number of labels were generated by the crowd. Given the size of the crowd over the expert group, it would appear that there is convergence in the cluster labelling undertaken by the individual crowd members.
Fuet al.used two methods to generate labels for each cluster. They selected the top five highest average words generated by the highest average rank labelling method (which ranks each word in the latent semantic analysis space for each
[image:15.493.136.456.222.295.2]Table 6. Comparison of cosine similarity scores for labels across different clustering approaches
All crowd Fu – highest Fu – cosine Patent Patent Experts
workers rank similarity Inspiration IPC Inspiration CPC
All crowd workers * 0.0766 0.0938 0.0345 0.1248 0.3582
Fu – highest rank * 0.4479 0.0234 0.0193 0.0330
Fu – cosine similarity * 0.0556 0.0688 0.0157
PatentInspiration IPC * 0.1528 0.0070
PatentInspiration CPC * 0.0287
Experts *
Table 7. Grammar percentages for labels generated by various approaches
Noun Verb Adjective Conjunction Preposition Adverb Determiner Modal
Fu’s algorithm Highest average rank method Highest cosine similarity method 90 94.8 2 1.7 8 3.4 — — — — — — — — — — Patent Inspiration IPC codes CPC codes 96 95.8 1.3 2.8 1.3 1.3 1.4 — — — — — — — —
Experts 66.7 9.9 8.1 5.4 4.5 3.6 0.9 0.9
Crowd 74.2 11.2 9.6 3.4 1.1 0.6 — —
patent within a cluster) and the highest cosine similarity labelling method (which generates the highest cosine similarity values in the pool of words for the patents within that cluster). Raising the cut-off values of rank and cosine similarity scores (i.e. choosing the top 10 rather than the top five words with the highest scores) to increase the number of labels generated through the algorithmic approaches may dilute the quality of the generated labels.
We went on to compare the labelling of the different methods using the cosine similarity across common label sets (Table6), with the vector representing the frequency of a particular label presented in each approach. In this case, scores range from 0–1, with a 1 indicating that they are identical. The results show a strong cosine similarity correlation between the experts and the crowd workers, with a much lower match between the experts and the algorithmic approaches.
[image:16.493.42.457.244.372.2]Figure 11.Comparison between the crowd and Fu’s algorithm ranking of patent relevance to the given problem.
clear differences between algorithmic and human labelling approaches. The algorithmic approaches mostly chose noun labels, whereas humans provide more context to labels by using a wide variety of English grammars.
4.2. Task 2: Relevance
The third aspect of cluster analysis we explored was the relevance of patents to the design problem. Fu’s clustering algorithm situates the design problem in the dark circle at the top left of Figure 2. This allows us to identify clusters in close proximity, which might provide practical design information to assist in embodiment design, and more distant clusters, which might provide more analogous ideas and principles that could be brought to bear. Most software landscaping tools, however, do not have the capability of locating the design problem in relation to clusters (providing a ‘centre’ to the map), so instead these become visual aids to browse and understand but are more difficult to apply. One of the main advantages in asking experts to review patents in relation to a design problem is the facility for this kind of interpretation: they can find the shallow and deep links for different patent types, consider clustering depending on the nature of the problem and the perspective this brings, and prioritise cluster groups based on this information. The question for us was whether this kind of expert analysis, so dependent on experience and insight, could be replicated in a crowd that has a greater number but less expertise.
A task was therefore set which asked the crowd workers to rate the level of relevance of patents to the design brief of designing a device to collect energy from human motion for use in developing and impoverished rural communities. A 1–6 rating was chosen to match the distance rankings generated by Fu’s algorithm – Figure2shows that the patents occupying the top left node are most relevant (a rating of 1), with those five nodes removed in the bottom right (a rating of 6). Figure11compares the relevance ranking generated by Fu’s algorithm and the highest cumulative rank frequency marked by the crowd workers. This shows that the crowd rankings concentrated at the extremes of the ranking scale, whereas Fu’s algorithm populated mostly the middle rankings.
This indicates a significant variance between the crowd and the computational approach with respect to patent relevance for a particular design problem. While it may have been useful to correlate with relevance as identified by experts, only one
Table 8. Patent pair agreement between evaluator and crowd results
Evaluator 1 Evaluator 2 Evaluator 3
Number of patent pairs and labels agreed from the crowd results
592 (60%) 670 (68%) 492 (50%)
Number of only patent pairs (but not labels) agreed from the crowd results
62 (6%) 84 (8%) 53 (5%)
Number of non-matching patent pairs agreed from the crowd results
335 (34%) 235 (24%) 444 (45%)
Number of patent pairs with extra labels generated by evaluators
158 (16%) 192 (19%) 192 (19%)
of the four in Fu’s analysis (Expert 2) was deemed to have explicitly incorporated distance from the design problem in their clustering. Even for that expert, distance was measured roughly from the design problem circle to the centre of each cluster rather than each patent, so an accurate correlation was not deemed appropriate.
4.3. Evaluation of crowd responses
To assess the validity of the crowd results, evaluation was conducted on the 989 patent pairs and their labels by three evaluators. Evaluator 1 was an RA with eight years of design research experience, Evaluator 2 was a post-doc with a design-related PhD and Evaluator 3 was a senior product design undergraduate with prior experience in patent research. The experts reviewed every patent pair with associated labels, and for each identified whether the crowd had created suitable similarity labels, generating any additional labels not already present, or indicated that there was no link between the patent pair. It took the evaluators an average of approximately 20 hours to complete the analysis of crowd labels. The Cronbach alpha inter-coding reliability scores were 0.811 (Evaluators 1 and 2), 0.878 (Evaluators 1 and 3) and 0.735 (Evaluators 2 and 3), indicating a high level of internal consistency. Table8summarises patent pair agreement between the evaluator and crowd results. On average, the evaluators agreed with 59% of the crowd’s patent pairs and labels, and with 6% of the crowd’s patent pairs (but not the labels). The evaluators generated additional labels for 18% of agreed patent pairs.
Figure 12.Box plot illustrating the relationship between the number of agreed evaluators and the number of crowd workers agreed with a patent pair.
4.4. Final cluster outcome
The generation and evaluation of patent pairs, cluster labelling and ranking of relevance to the design problem led to the production of a patent matrix to aid visualisation and understanding of the groupings created. We used Clustergrammer1 to generate a dynamic and interactive matrix visualisation rather than the static patent clusters represented in Section2. Figure13illustrates the partial patent cluster matrix between patents (x-axis) and generated labels (y-axis). This choropleth visualisation uses colour variation to represent relevance to the design problem (a darker shade represents stronger relevance to the problem). For example, the ‘material handling’ label is associated with Patents 3, 9 and 14, and Patents 9 and 14 are more relevant to the design problem than Patent 3. The order of the labels and patents is augmented by the software to optimise the clusters; however, this can be controlled by the user if desired.
The visualisations are highly interactive: they can be reordered according to hierarchical clustering, rank by sum, and rank by variance approaches, and the right top and bottom left sliders can be changed to increase or decrease the number of patent clusters with the slider. This level of control allows designers to dynamically choose and change the number of clusters according to the level of detail or granularity required for the task in hand. The generation of different views in this way can help to identify unique patent to label relationships, and stimulate new insights in relation to the design problem. Furthermore, matrices can be generated for patent to patent and label to label clusters in addition to the patent to label clusters shown in Figure13. This can help to identify relationships between them and their importance to the design problem. Important labels can be automatically chosen by varying the relevance sum or variance score. This function represents dimensionality reduction performed by various algorithms.
The visualisation communicates the specific relationship between each patent pair with appropriate labels, showing both dense patent clusters and also sparse links between patents. In other words, the map does not categorically isolate different clusters. It comprehensively represents the information generated from
1The complete matrix can be viewed using the following weblink:http://amp.pharm.mssm.edu/clust
ergrammer/viz_sim_mats/58bab2a9692bcb22ab3fc81d/Matrix_Patents_Labels_V8.txt.
Figure 13.Visualisation of clustering between patents and patent labels for a cropped patent cluster zone.
the evaluated crowd results, avoiding any loss of information that can occur in the algorithmic refinement process. Additionally, there is the opportunity for designers to navigate patent clusters dynamically according to their requirements: mouse hovering highlights a particular patent and connected label, and clicking a particular cell in the cluster bring up the relevance score. Moreover, the addition of IPC/CPC codes as categories can help engineers to understand how different domains interact with reference to crowd-generated similarity labels.
5. Discussion
Based on the experiments conducted, we can summarise what added value the crowd currently provides in terms of the clustering patents for design, and how we can optimise its response going forward.
ability to identify implicit functional patent pairs could potentially be useful to train and develop advanced clustering algorithms. Another characteristic of the crowd was to place more patents in a single group when identifying similarity. This could reflect a clear perception of how patents are related, but could also indicate a lack of full consideration of the implications for each patent. Identification of optimal grouping and pairing numbers that emerged through our evaluation could prove valuable in the self-evaluation and monitoring of results. When reviewing the patent pairs in detail, an advantage of the crowd is that labels are generated both for explicitly linked patents (e.g. functionally similar valves that lie in the same product category) as well as less obvious connections (e.g. steering devices and universal joints that could be cross-applicable). These insights can be aggregated and evaluated to provide a fuller overview of patents that may be relevant to a technology or problem.
In the generation of patent labels, both the experts’ and the crowd’s differed greatly with algorithmic approaches. Algorithmic extraction through ‘word’ analysis such as frequency and cosine similarity is not rich enough to represent meaningful coherent information of a patent group. The results show that people generate high-level functional labels, with extended descriptions that show flexibility in adapting to different domains and technical properties. Human heuristics to generate labels according to these criteria, and the adaptive behaviour necessary to do so, is still far from being replicated by algorithmic approaches. Given that the crowd was untrained, with unknown levels of prior experience or knowledge, the strong overlap with labels generated by experts is a promising result. With higher levels of curation, it could be expected that the level of convergence among the crowd and the overlap with expert perception would rise. The size of the crowd to some extent mitigates the lack of expertise of the workers, as through the evaluation of aggregate responses we can find the meaningful and valuable insights that might not emerge when relying on computational approaches alone.
In evaluating patents’ relevance to a design problem, the results show a clear difference between algorithmic and human reasoning. The crowd tended to rate patents using the full scale available, whereas the Fu algorithm had less distinct results. This suggests that the crowd may offer more definitive insights than computational approaches with respect to patent relevance. While potentially useful in highlighting creative triggers or unusual insights from patents that might otherwise have been dismissed, strong opinions need to be aggregated to identify those that are meaningful and insightful. By associating and consolidating the rationale provided by a large number of people to different relevance ratings, the identification and demarcation of patent usefulness becomes much clearer for designers.
The discrepancies between the algorithm and crowd results suggest that it may be advisable to utilise a combined approach. The algorithm reliance on classification and explicit noun terms allows for the rapid grouping and categorisation of functionally similar patents using full-text analysis; the crowd can be utilised to verify these groupings and provide enhanced understanding and rationale for why these groupings emerge through comparison of images and abstracts. In addition, in the pairings where there are less obvious but potentially valuable connections, the crowd results can be aggregated and evaluated to provide additional insights. The patent cluster matrix produced in this work can
Table 9. Practical considerations of crowdsourcing clustering with reference to other approaches
Crowd Professional, human experts (Fuet al. 2013a,b,c)
Computational algorithm (Fu
et al.2013a,b,c)
Commercial software
(PatentInspiration)
Resources required
Scalable and easily accessible (24/7)
Limited resources and availability Not commercialised (in development stage) Powerful computer for quicker results Clustering approach Aggregated intuition and judgement Individual intuition and judgement Bayesian approach and latent semantic analysis Semantic analysis supported by classification codes Cluster labels Functionally
oriented, emergent terms through aggregation Functionally oriented, but significant variance Mostly non-functional labels (chosen by high cosine/rank method)
Mostly non-functional labels (dominated by noun words)
Scope for creativity Provides surprising allegorical cluster links Provides surprising allegorical cluster links Literal text-based labels and limited by cluster variety
Literal text-based labels and limited by cluster variety
Average cost $5/person/hr (variable based on geographical location) $200/expert for clustering 45 patents (average 90 minutes)
n/a (difficult to quantify but significant development costs)
e99/month (the cheapest software option available)
act as a new way to create clusters based on individual labels rather than clubbing labels to represent groups of patents. In doing so, it provides clusters based on relationships between labels, and between patents themselves.
5.1. Application
classification by ‘expert teams’ to try to ensure the accuracy and relevance of the results. As organisations seek to make such classifications more time and cost efficient, and employ outsourcing facilities to assist and augment their core operation, the process begins to move into the domain of crowdsourcing. The crowd is also extremely quick. The majority of responses to tasks were received within a matter of hours, with a small number of responses increasing the overall task response time. While this will never match the speed of computational approaches, it is not a critical factor in the preparation of a cluster analysis. We can consider that increasing the payments to the crowd with a corresponding increase in task response time could significantly increase the quality of responses. A key part of our recommendation is that a curated crowd, which has been primed to complete patent analysis tasks, will still be an order of magnitude cheaper than alternatives, comparatively quick, and produce useful results. Even though we conducted the study based on a 45 patent set, the availability of global crowd resources means that it is possible to scale the workflows as necessary for larger patent sets.
5.2. Limitations
It is important to note that the use of crowdsourcing has been found to be challenging in the design context. For example, Burnapet al.(2015) found the use of crowd consensus for design evaluation problematic due to challenges in establishing appropriate levels of evaluator expertise among workers. We have tried to address the issues of technical knowledge through the nature of the workflow – the crowd is asked to pair and label patents, so their competence is demonstrated by the successful completion of these. Moreover, while an individual’s result is not reliable, aggregation of these results across larger numbers can provide workable results. Additionally, we have relied on evaluators to check the pairings identified by the crowd. An aspect of future work is to reconfigure this evaluation as a crowdsourced task to eliminate this part of the workflow.
Another issue in the early experimentation reported here was the degree of variability in the quality of the work submitted despite the use of test questions and reward payments. When these are in place and a core of responsive workers have been secured, the crowd can be expected to mature and the overall quality of results can be expected to rise over a period of engagement. Furthermore, a well-structured task instruction page and intuitive user interface are essential to facilitate good crowd responses, and this will generally require some iteration through pilot testing. While our software platform facilitated the design of optimised task workflows, there are limits to what can be achieved using the most common crowdsourcing platforms such as CrowdFlower and mTurk. Since neither of these platforms gives the task provider control over the choice of individuals when allocating work, it is not easy to develop the best workers over a period of time. Ideally, this would be done by initial screening tests and then progressively harder jobs in preparation for patent analysis tasks which require high levels of reasoning and judgement.
from very different contexts. It would be desirable to run further tests with a more focussed patent set, perhaps centred on a particular technical topic, to understand whether the crowd is able to discern between patents at this more detailed level. We anticipate that with appropriate guidelines and task design for workers, this should be viable, but the effect on completion time and acceptance rate would be revealing.
As we have outlined above, we anticipate the patent sets to be clustered and accessed in the application of this approach to be in the hundreds rather than the thousands. However, a clear benefit of the algorithmic approach is the ability to scale into thousands of patents at no additional cost. To achieve a larger data set using the crowdsourcing approach, the most practical approach would be to run the task a number of times and synthesise the results for analysis. The global source of workers suggests that there would be no issues in terms of the execution of this; however, there is an additional cost in terms of time (if running the tasks sequentially) and cost (on a worker-by-worker basis). A combination of algorithmic and crowd approaches may have advantages in, for example, first acquiring and refining a patent set for a particular design problem through computational approaches and then utilising the crowd to further parse and cluster. This focusses the human effort where it is most valuable – in interpreting and synthesising design information.
6. Conclusion
The research reported here provides a new approach for the utilisation of patents in design contexts. While a significant amount of material has been written on how patents relate to innovation at a macroeconomic or strategic level, we have focussed on how value and insights can be extracted from functional groupings to support design problem solving. Specifically, we have demonstrated the advantages and limitations of utilising crowdsourcing to review, cluster and label patents. The construction of a bespoke software platform meant that we had an architecture flexible enough to design visually orientated tasks where information was clearly presented to workers. The design of the clustering workflow, implementing similarity, labelling and relevance ranking tasks and aggregating them for analysis, has allowed us to establish the viability of the crowd in comparison with computational and expert approaches. In practice, different stages of the design process require different types of patent sets. For example, a scoping exercise requires a large and diverse patent set to allow for effective horizon scanning, whereas embodiment design may require a more focussed and technical patent set to solve a particular mechanical issue. In future work, we therefore intend to work with patent sets of varying size and diversity, developing search strategies to define these. Using these, we will monitor the effect on crowd performance, and evaluate the effect of the generated visualisations on the work produced by designers.
Acknowledgments
Appendix A. Patent set
The 45 patent set table used in crowdsourcing studies.
Study index number Patent number (US) Patent title
1 6,082,923 Converging sphere joint assembly
2 5,984,148 Self-cleaning pressure relief
and bypass valve, dispensing apparatus and method
3 5,375,948 Cutting insert for cutting and
grooving tools
4 6,367,521 Gravity feed fluid dispensing
valve
5 6,497,607 Interactive toy
6 4,853,977 Patient garment
7 5,993,410 Adjustable probe
8 4,223,996 Apparatus for mixing solid and
liquid constituents of mortar or the like
9 4,589,668 Wheeled cart with removable skis
10 3,962,735 Movable bulkhead with guiding
and overcanting prevention means
11 4,124,051 Shock absorbing wheel hub
12 4,984,583 Air bubbling mats for
therapeutically agitating bath water
13 7,175,212 Latch having releasable cinching mechanism
14 4,259,034 Bale handling apparatus
15 6,634,325 Fuel injection system for linear engines
16 4,139,981 Escapement mechanism for
pendulum clocks
17 5,909,815 Single drive, multi-screw sorter with pusher means
18 4,402,483 Earthquake isolation floor
19 4,103,708 Ventilated poppet damper
20 3,964,473 Bone prosthesis
21 4,705,064 Safety seal for an operating lever
22 6,142,689 Envelope leveller for printer
feeder
23 5,273,173 Screw top
Continued on next page.
Study index number Patent number (US) Patent title
24 5,438,724 Method for using plastic fasteners for shoe-lasting applications
25 5,234,096 Hanger tilt mechanism for
hanging transportation apparatus 26 4,867,134 Fluid-heating solar collector 27 4,568,937 Induction loop vehicle detector
28 6,109,282 Self-erecting loop structure
29 4,303,397 Smoke generating apparatus
30 5,899,571 Beach towel, tote bag and beach umbrella system
31 6,234,452 Hand operable motorcycle stand
32 4,335,611 Accelerometer
33 5,085,240 Shelter structure
34 6,634,044 Compact stretcher
35 4,270,310 Support device for an upstanding plant support rod in a plant pot 36 5,423,097 Emergency drop fowler and gatch
37 5,277,276 Compensating rope sheave tie
down
38 3,938,909 Single needle alternating flow blood pump system
39 5,647,066 Safety helmet visor
40 6,119,041 Apparatus and method for linear lesion ablation
41 4,484,762 Ski binding and boot
42 4,762,262 Side-fed stapler
43 6,164,698 Steering device for automobiles
44 6,062,856 Dental implant hole guide
extension
45 4,739,727 Animal waterer
Appendix B. Clustering tasks set to the crowd
Task 1: Group patents
You are going to support an engineer who is currently solving the following design problem.
radio or lighting device, hopefully leading to an increase in the quality of life of the communities by increasing productivity, connection to the outside world, etc. The target energy production is 1 kW-hour per day, roughly enough to power eight 25 Watt compact florescent light bulbs for 5 hours each per day, or enough to power a CB radio for the entire day.’
The engineer identified 45 patents that could help in this task. However, these patents need to be grouped to help the engineer to easily navigate among them. Patents should be grouped based on ‘functional similarity’ to facilitate searching through the collection of patents for potential inspiration to solve the abovementioned design problem. The group of patents should capture functional similarity, and not necessarily problem or technological domain similarity. The example for functional similarity is a patent for ‘a car suspension system’ is grouped with ‘a running shoe’ based on the fact that ‘shock absorbing’ is a function that is common in both patents.
Your task is to structure these 45 patents into smaller groups based on functional similarity, and provide a suitable functional group title.
Task 2: Patent relevance to the design problem
Your task is to rate your patent groups on a scale of 1 to 6 based on importance to the given problem.
Appendix C. Predicting expert and algorithm outcomes
using the crowd
[image:27.493.137.457.468.607.2]Table 10 presents the positive Phi nominal correlation values with statistical significance between the crowd workers’ pairs and the other clustering approaches, as well as the maximum Phi nominal correlation values achieved. The results show that the average and maximum number of crowd-generated clusters are correlated significantly with the PatentInspiration software and Expert 1 outputs. However, the highest significant correlation achieved is only 0.286, which provides moderate confidence in predicting experts’ outcomes from individual crowd cluster results.
Table 10. Phi nominal correlations between crowd workers and other approaches
Fu algorithm Expert 1 Expert 2 PatentInspiration
Number of crowd workers with
statistically significant positive correlations
27 35 29 37
Average correlation value (significance <0.05)
0.106 0.133 0.125 0.113
Maximum correlation value (significance <0.05)
0.247 0.259 0.286 0.205
Table 11. Chi-square values and percentage of correct prediction of unlinked and linked pairs through crowd workers’ results of logistic regression
Dependent Predictor χ2(1) Significance % of variance Prediction percentage
variable explained
Fu’s algorithm 26.604 <0.001 2.7%–5% Unlinked pairs – 99.9 Linked pairs – 0.8
Expert 1 Sum of all crowd
workers 53.853 <0.001 5.3%–13.3% Unlinked pairs –99.6 Linked pairs –
2.9
Expert 2 32.971 <0.001 3.3%–6.3% Unlinked pairs –
99.7 Linked pairs – 0.8
PatentInspiration 44.259 <0.001 4.4%–6.4% Unlinked pairs – 98.2 Linked pairs – 5.9
This conclusion is further confirmed in logistic regression of the sum of patent pairs generated by all of the crowd workers concerning other approaches (Table11). The logistic regression establishes that there is a statistically significant prediction possibility of Fu’s algorithm, experts and PatentInspiration outcomes from the aggregated sum of all of the crowd workers’ results. However, the prediction percentage is higher only for unlinked patent pairs (i.e. ungrouped patent pair) in all cases. This result shows that patent clustering is a complex activity, in which each and every approach and person generates different results, which makes prediction difficult.
References
Abbas, A.,Zhang, L.&Khan, S. U.2014A literature review on the state-of-the-art in patent analysis.World Patent Information37, 3–13.
Atzmüller, P.&Landl, G.2009Semantic enrichment and added metadata – examples of efficient usage in an industrial environment.World Patent Information31(2), 89–96.
Burnap, A.,Ren, Y.,Gerth, R.,Papazoglou, G.,Gonzalez, R.&Papalambros, P. Y.2015
When crowdsourcing fails: a study of expertise on crowdsourced design evaluation.
Journal of Mechanical Design, Transactions of the ASME137(3), doi:10.1115/1.4029065.
Choi, S.,Park, H.,Kang, D.,Lee, J. Y.&Kim, K.2012An SAO-based text mining approach to building a technology tree for technology planning.Expert Systems with Applications39(13), 11443–11455.
Dereli, T.&Durmuşoğlu, A.2009Classifying technology patents to identify trends: applying a fuzzy-based clustering approach in the Turkish textile industry.Technology in Society31(3), 263–272.
Dražić, M.,Kukolj, D.,Vitas, M.,Pokrić, M.,Manojlović, S.&Tekić, Z.2013
Fan, C. Y.,Lai, M.,Huang, T.&Huang, C.2011Applying K-means Clustering and Technology Map in Asia Pacific-Semiconductors Industry Analysis.Paper presented at the Industrial Engineering and Engineering Management (IEEM), 2011 IEEE International Conference on.
Fantoni, G.,Apreda, R.,Dell’Orletta, F.&Monge, M.2013Automatic extraction of function–behaviour–state information from patents.Advanced Engineering Informatics27(3), 317–334.
Fu, K.,Cagan, J.&Kotovsky, K.2011A Methodology for Discovering Structure in Design Databases.Paper presented at the DS 68-6: Proceedings of the 18th International Conference on Engineering Design (ICED 11), Impacting Society through Engineering Design, Vol. 6: Design Information and Knowledge,
Lyngby/Copenhagen, Denmark, 15–19.08. 2011.
Fu, K.,Cagan, J.,Kotovsky, K.&Wood, K.2013aDiscovering structure in design databases through functional and surface based mapping.Journal of Mechanical Design135(3), 031006.
Fu, K.,Chan, J.,Schunn, C.,Cagan, J.&Kotovsky, K.2013bExpert representation of design repository space: a comparison to and validation of algorithmic output.Design Studies34(6), 729–762.
Fu, K.,Dilmore, J.,Cagan, J.&Dougherty, C. H. Jr.2013cUsing Design Database Structures to Characterize Freedom-to-Operate in a Design Space: A Legal Case Study.
Paper presented at the DS 75-1: Proceedings of the 19th International Conference on Engineering Design (ICED13), Design for Harmonies, Vol. 1: Design Processes, Seoul, Korea, 19–22.08. 2013.
Fu, K.,Murphy, J.,Yang, M.,Otto, K.,Jensen, D.&Wood, K.2014Design-by-analogy: experimental evaluation of a functional analogy search methodology for concept generation improvement.Research in Engineering Design26(1), 77–95.
Huang, C.-Y.,Lin, Y.-H.&Tsai, P.-F.2015Developing a rework process for underfilled electronics components via integration of TRIZ and cluster analysis.IEEE
Transactions on Components, Packaging and Manufacturing Technology5(3), 422–438.
Igami, M.2008Exploration of the evolution of nanotechnology via mapping of patent applications.Scientometrics77(2), 289–308.
Ipeirotis, P.2010Demographics of Mechanical Turk. NYU Center for Digital Economy Research Working Paper CeDER-10-01, New York University.
Jeong, C.&Kim, K.2014Creating patents on the new technology using analogy-based patent mining.Expert Systems with Applications41(8), 3605–3614.
Jin, G.,Jeong, Y.&Yoon, B.2015Technology-driven roadmaps for identifying new product/market opportunities: use of text mining and quality function deployment.
Advanced Engineering Informatics29(1), 126–138.
Jun, S.,Park, S.-S.&Jang, D.-S.2014Document clustering method using dimension reduction and support vector clustering to overcome sparseness.Expert Systems with Applications41(7), 3204–3212.
Kim, J.-M.&Jun, S.2015Graphical causal inference and copula regression model for apple keywords by text mining.Advanced Engineering Informatics29(4), 918–929.
Kim, Y. G.,Suh, J. H.&Park, S. C.2008Visualization of patent analysis for emerging technology.Expert Systems with Applications34(3), 1804–1812.
Kitamura, Y.,Kashiwase, M.,Fuse, M.&Mizoguchi, R.2004Deployment of an ontological framework of functional design knowledge.Advanced Engineering Informatics18(2), 115–127.
Kukolj, D.,Tekic, Z.,Nikolic, L.,Panjkov, Z.,Pokric, M.,Drazic, M.&Nemet, D.2012
Comparison of Algorithms for Patent Documents Clusterization.Paper presented at the MIPRO, 2012 Proceedings of the 35th International Convention.
Lee, C.,Kang, B.&Shin, J.2015Novelty-focused patent mapping for technology opportunity analysis.Technological Forecasting and Social Change90, 355–365.
Lee, S.,Yoon, B.&Park, Y.2009An approach to discovering new technology
opportunities: keyword-based patent map approach.Technovation29(6–7), 481–497.
Li, Z.,Atherton, M.&Harrison, D.2014Identifying patent conflicts: TRIZ-led patent mapping.World Patent Information39, 11–23.
Luo, J.2015The united innovation process: integrating science, design, and entrepreneurship as sub-processes.Design Science1, doi:10.1017/dsj.2015.2.
Moehrle, M. G.&Passing, F.2016Applying an anchor based patent mapping approach: basic conception and the case of carbon fiber reinforcements.World Patent
Information45, 1–9.
Moser, P.2013Patents and innovation: evidence from economic history.The Journal of Economic Perspectives27(1), 23–44.
Murphy, J.,Fu, K.,Otto, K.,Yang, M.,Jensen, D.&Wood, K.2014Function based design-by-analogy: a functional vector approach to analogical search.Journal of Mechanical Design136(10), 101102.
Park, H.,Kim, K.,Choi, S.&Yoon, J.2013A patent intelligence system for strategic technology planning.Expert Systems with Applications40(7), 2373–2390.
Park, H.,Yoon, J.&Kim, K.2011Identifying patent infringement using SAO based semantic technological similarities.Scientometrics90(2), 515–529.
Ross, J.,Irani, L.,Silberman, M. S.,Zaldivar, A.&Tomlinson, B.2010Who are the Crowdworkers?: Shifting Demographics in Mechanical Turk. Paper presented at the CHI ’10 Extended Abstracts on Human Factors in Computing Systems, Atlanta, Georgia, USA.
Ryley, J. F.,Saffer, J.&Gibbs, A.2008Advanced document retrieval techniques for patent research.World Patent Information30(3), 238–243.
Segev, A.&Kantola, J.2012Identification of trends from patents using self-organizing maps.Expert Systems with Applications39(18), 13235–13242.
Spangler, S.,Ying, C.,Kreulen, J.,Boyer, S.,Griffin, T.,Alba, A.&Yan, S.2011
Exploratory analytics on patent data sets using the SIMPLE platform.World Patent Information33(4), 328–339.
Suh, J. H.&Park, S. C.2006A New Visualization Method for Patent Map: Application to Ubiquitous Computing Technology.Paper presented at the International Conference on Advanced Data Mining and Applications.
Suh, J. H.&Park, S. C.2009Service-oriented Technology Roadmap (SoTRM) using patent map for R&D strategy of service industry.Expert Systems with Applications36
(3), 6754–6772.
Tekic, Z.,Kukolj, D.,Nikolic, L.,Drazic, M.,Pokric, M.,Vitas, M.&Nemet, D.2012
PSALM-Tool for Business Intelligence. Paper presented at the MIPRO, 2012 Proceedings of the 35th International Convention.
Trappey, A. J.,Trappey, C. V.,Hsu, F.-C.&Hsiao, D. W.2009A fuzzy ontological knowledge document clustering methodology.IEEE Transactions on Systems, Man, and Cybernetics, Part B (Cybernetics)39(3), 806–814.
Trappey, C. V.,Trappey, A. J. C.&Wu, C.-Y.2010Clustering patents using
non-exhaustive overlaps.Journal of Systems Science and Systems Engineering19(2), 162–181.
Trappey, C. V.,Wu, H.-Y.,Taghaboni-Dutta, F.&Trappey, A. J. C.2011Using patent data for technology forecasting: China RFID patent analysis.Advanced Engineering Informatics25(1), 53–64.
Vandevenne, D.,Verhaegen, P.,Dewulf, S.&Duflou, J.2016SEABIRD: scalable search for systematic biologically inspired design.Artificial Intelligence for Engineering Design, Analysis and Manufacturing30(1), 78–95.
Vasantha, G.,Corney, J.,Maclachlan, R.&Wodehouse, A.2016The Analysis and Presentation of Patents to Support Engineering Design. Paper presented at the 7th International Conference on Design Computing and Cognition (DCC16), Chicago, USA.
Verhaegen, P.-A.,Peeters, J.,Vandevenne, D.,Dewulf, S.&Duflou, J. R.2011
Effectiveness of the PAnDA ideation tool.Procedia Engineering9, 63–76.
Widodo, A.&Budi, I.2011Clustering Patent Document in the Field of ICT (Information
&Communication Technology). Paper presented at the 2011 International Conference on Semantic Technology and Information Retrieval.
World Intellectual Property Organization2016WIPO IP Facts and Figures 2016. Retrieved from Geneva, Switzerland. Available at:http://www.wipo.int/edocs/pubdoc s/en/wipo_pub_943_2016.pdf.
Xu, C.,Zhiyong, P.&Bin, L.2013Technology and Effect Matrix for Patent Clustering.
Paper presented at the Web Information System and Application Conference (WISA), 2013 10th.
Yan, M.1993Representing design knowledge as a network of function, behaviour and structure.Design Studies14(3), 314–329.
Yoon, B.&Park, Y.2004A text-mining-based patent network: analytical tool for high-technology trend.The Journal of High Technology Management Research15(1), 37–50.
Yoon, B. U.,Yoon, C. B.&Park, Y. T.2002On the development and application of a self-organizing feature map-based patent map.R&D Management32(4), 291–300.
Yoon, J.,Park, H.&Kim, K.2012Identifying technological competition trends for R&D planning using dynamic patent maps: SAO-based content analysis.Scientometrics94
(1), 313–331.
Zhang, L.-w.&Zhu, D.-h.2010Research of Technical Development Trend and Hot Points Based on Text Mining.Paper presented at the 2nd International Conference on Information Engineering and Computer Science (ICIECS).