City, University of London Institutional Repository
Citation
:
Turkay, C., Lundervold, A., Lundervold, A. J. and Hauser, H. (2013). Hypothesis
generation by interactive visual exploration of heterogeneous medical data. Paper presented
at the Third International Workshop, HCI-KDD 2013, 1 July 2013 - 3 July 2013, Maribor,
Slovenia.
This is the unspecified version of the paper.
This version of the publication may differ from the final published
version.
Permanent repository link:
http://openaccess.city.ac.uk/3553/
Link to published version
:
Copyright and reuse:
City Research Online aims to make research
outputs of City, University of London available to a wider audience.
Copyright and Moral Rights remain with the author(s) and/or copyright
holders. URLs from City Research Online may be freely distributed and
linked to.
City Research Online:
http://openaccess.city.ac.uk/
publications@city.ac.uk
Hypothesis Generation by Interactive Visual
Exploration of Heterogeneous Medical Data
Cagatay Turkay1
, Arvid Lundervold2
Astri Johansen Lundervold3 , and Helwig Hauser1
1
Department of Informatics, University of Bergen, Norway
{Cagatay.Turkay,Helwig.Hauser}@uib.no, 2
Department of Biomedicine, University of Bergen, Norway
Arvid.Lundervold@biomed.uib.no, 3
Department of Biological and Medical Psychology, University of Bergen, Norway
Astri.Lundervold@psybp.uib.no
Abstract. High dimensional, heterogeneous datasets are challenging for
domain experts to analyze. A very large number of dimensions often pose problems when visual and computational analysis tools are considered. Analysts tend to limit their attention to subsets of the data and lose potential insight in relation to the rest of the data. Generating new hy-potheses is becoming problematic due to these limitations. In this paper, we discuss how interactive analysis methods can help analysts to cope with these challenges and aid them in building new hypotheses. Here, we report on the details of an analysis of data recorded in a comprehensive study of cognitive aging. We performed the analysis as a team of visual-ization researchers and domain experts. We discuss a number of lessons learned related to the usefulness of interactive methods in generating hypotheses.
Keywords: interactive visual analysis, high dimensional medical data
1
Introduction
As in many other domains, experts in medical research are striving to make sense out of data which is collected and computed through several different sources. Along with new imaging methodologies and computational analysis tools, there is a boom in the amount of information that can be produced per sample (usu-ally an individual in the case of medical research). This increasingly often leads to heterogeneous datasets with very large number of dimensions (variables), up to hundreds or even thousands. This already is a challenging situation since most of the common analysis methods, such as regression analysis or support vector machines [1], for example, do not scale well to such a high dimensionality. Con-sider for instance applying factor analysis to understand the dominant variations within a 500-dimensional dataset. It is a great challenge to correctly interpret the resulting factors even for the most skilled analyst.
a study or high operational costs. This results in datasets with small number of observations (small n) but a very high number of variables (large p). Since most of the statistical methods need sufficiently large number of observations to provide reliable estimates, such “long” data matrices lead to problematic computations [2]. Both the high dimensionality of the datasets and the “p≫n
problem”, pose big challenges for the analyst and the computational tools. These challenges lead to the fact that the experts tend to limit their analyses to a subset of the data based on a priori information, e.g., already published related work. Limiting the analysis to a subset of the data dimensions hides relations in the data that can potentially lead to new, unexpected hypotheses.
At this stage, the field of visual analytics can offer solutions to analysts to overcome these limitations [3] [4]. The visual analysis methods enable analysts to quickly build new hypotheses through interaction with the data. The user also gets immediate feedback on whether or not these hypotheses call for a further investigation. Moreover, the interactive tools enable analysts to check for known hypotheses and relationships that have been already studied and reported in the related literature.
In this application paper, we discuss how interactive visual analysis meth-ods facilitate the hypothesis generation process in the context of heterogeneous medical data. We discuss how we utilize the dual analysis of items and dimen-sions [5] in the interactive visual analysis of high dimensional data. We report on the analysis of data related to a longitudinal study of cognitive aging [6] [7]. We demonstrate how our explorative methods lead to findings that are used in the formulation of new research hypotheses in the related study. We additionally showcase observations that are in line with earlier studies in the literature. We then comment on a number of lessons learned as a result of the analysis sessions that we performed as a team of visualization researchers and domain experts.
2
Interactive Visual Analysis Environment
The analysis of the cognitive aging study data is performed through a coordi-nated multiple view system [8], that primarily makes use of scatterplots. The user is able to make selections in any of the views and combine these selections through Boolean operators, i.e., ∪,∩,¬. In order to indicate the selections and
skewness
kur
tos
is
age
educ
at
ion
µ
σ
Older & Lower Education
Higher values for selection
[image:4.595.137.483.114.232.2]a) b) c)
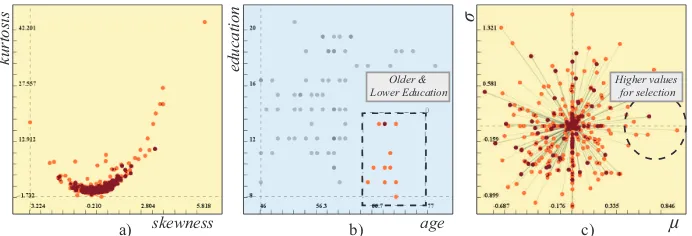
Fig. 1.Dual analysis framework where visualizations of items have a blue and those of
dimensions a yellow background. a) We employ a visualization of the dimensions over their skewnessand kurtosisvalues, where each dot represents a single dimension b) We select a group of participants who are older and have a lower education. c) The deviation plot shows how theµandσvalues change when the selection in (b) is made.
between the dimensions as a distance metric to MDS and as a result, it places the highly inter-correlated groups close to each other. These computational analysis tools are available through the integration of the statistical computation package R [10].
The analysis approach employed in this paper is based on the dual analysis method by Turkay et al. [5]. In this model, the visualization of data items is ac-companied by visualizations of dimensions. In order to construct visualizations where dimensions are represented by visual entities, a number of statistics, such as mean (µ), standard deviation (σ), median, inter-quartile-range (IQR), skew-ness, and,kurtosis are computed for each dimension (i.e., column of the data). These computed statistics are then used as the axes of a visualization of dimen-sions. In Fig. 1-a, the dimensions are visualized with respect to their skewness and kurtosis, where each dot here represents a dimension.
3
Cognitive Aging Study Data
We analyze the data from a longitudinal study of cognitive aging where the par-ticipants were chosen among healthy individuals [6] [7]. All the parpar-ticipants were subject to a neuropsychological examination and to multimodal imaging. One of the expected outcomes of the study is to understand the relations between image-derived features of the brain and cognitive functions in healthy aging [7]. The study involves 3D anatomical magnetic resonance imaging (MRI) of the brain, followed by diffusion tensor imaging (DTI) and resting state functional MRI in the same imaging session [12] [13]. In this paper, we focus on the anatomical MRI recordings together with the results from the neuropsychological examination. The examination included tests related to intellectual function (IQ), memory function, and attention/executive function. IQ was estimated from two sub tests from the Wechsler Abbreviated Scale of Intelligence [14]. The total learning score across the five learning trials of list A (learning), the free short and long delayed recall and the total hits on the Recognition scores from the California Verbal Learning Test (CVLT) II [15] were together with the subtest Coding from Wech-sler Adult Intelligence Scale-III [16] used to assess memory function. The Color Word Interference Test from the Delis-Kaplan Executive Function System [17] and the Trail Making Test A and B from the Halstead-Reitan Test Battery [18] were used to assess attention/executive function.
The resulting dataset from the study contains information on 82 healthy indi-viduals who took part in the first wave of the study in 2004/2005. T1-weighted MRI images were segmented into 45 anatomical regions. For each segmented brain region, seven features were derived automatically, namely:number of vox-els,volume andmean, standard deviation, minimum, maximum and range of the intensity values in the regions. All these automated computations were done in the FreeSurfer software suite [19]. This automated process creates 45×7 = 315
dimensions per individual. Additional information on the participants, such as age and sex, and, the results of two neuropsychological tests are added to the data. With this addition, the resulting dataset has 373 dimensions, i.e., the re-sulting table’s size is 82×373. Moreover, meta-data on the dimensions is also
incorporated. This meta-data contains whether each dimension is a test score or a brain segment statistic, which brain regions that dimension is related to, and, which statistical feature (e.g., volume or mean intensity) is encoded.
4
Analysis of Cognitive Aging Study Data
often the case), all the operations need to be redone from the beginning – a considerably long time to build/evaluate a single hypothesis. On the contrary, in our interactive methods, the whole data is available throughout the analysis and analysts switch the current focus quickly through interactive brushes.
In order to direct the analysis, we treat age, sex, and the test scores as the dependent variables and try to investigate how they relate to the imag-ing based variables. Moreover, we investigate the relations within the brain segments. In each sub-analysis, we derive a number of observations purely ex-ploratively. We then discuss these findings as an interdisciplinary team of vi-sualization researchers, experts in neuroinformatics and neuropsychology. We comment on the observations using a priori information and suggest explana-tions/hypotheses around these new findings. These hypotheses, however, needs to be confirmed/rejected through more robust statistical and/or clinical tests to be considered for further studies. Our aim here is to enable analysts to generate new hypotheses that could potentially lead to significant findings when careful studies are carried out.
Prior to our analysis we handle the missing values and perform normaliza-tion on the data. To treat missing values, we apply one of the methods known as statistical imputation and replace the missing values with the mean (or mode) of each column [20]. We continue with a normalization step where different normal-ization schemes are employed for different data types. Here, dimensions related to the imaging of the brain are z-standardized and the rest of the columns are scaled to the unit interval.
Inter-relations in Test Results. We start our analysis by looking at the rela-tions between the test scores. We first focus our attention on the results related to IQ & Memory function and attention/executive functions related tests and apply a correlation-based-MDS on the 15 dimensions. The rest of the dimensions are not used in the computation and are placed in the middle of the view and colored in gray in Fig. 2-a. Here, we choose to focus on the two large groups, that are to the left and to the right of the view. For a micro analysis, one can focus on the sub-groupings that are visible in both of the clusters. The first group relates to test results assessing IQ and memory function (Group-1). The second group relates to test scores assessing attention and executive function (Group-2). This grouping is in line with the interpretation of these scores and we investigate these two sub-groups separately in the rest of the analysis. We interactively select these sub-groups and locally apply PCA on them. We then use the resulting principal components (PC) to represent these two groups of test scores. We observed that for both of the groups much of the variance is captured by a single PC, so we decide to use only the first PC for each group. Hypothesis 1: There are two dominant factors within the test results, IQ & memory andattention & executive function.
P Cat
te
nt
ion &
e
xe
c.
PCIQ & memory Group-2:
Attention & Executive Function
Group-1: IQ & Memory Function
MDS1
MD
S2
median
IQ
R
learning
R
. L
at
. V
ent
. V
ol
a) b)
[image:7.595.169.447.111.394.2]c) d)
Fig. 2.a) MDS is applied on thetest score dimensions, where related dimensions are
placed close to each other. Two groups for the test scores (Group-1: IQ and memory re-lated, Group-2: attention) show up in the results. b) Each group is represented through an application of PCA and the resulting first principal components are mapped to the axes of the scatterplot. A group of participants, who are better in learning and at-tentive function is selected. c) Some brain regions are smaller for this subgroup, i.e., have smallermedian value. d) We select one of the dimensions that shrink the most,
right lateral ventricle volume (red circle), and visualize these values against the learn-ing scores from CVLT. We notice that there is indeed a negative correlation with the learning score from the CVLT.
age
se
x
med
IQ
R
med
IQ
R
sex
T
hal
am
us
v
ol
.
a) b)
c) d)
Male Participants
IQ & Memory Func. Related Tasks
Larger volumes in men
[image:8.595.171.447.112.403.2]Attention & Executive Func. Tasks
Fig. 3. Male participants are selected (a) and the deviation plot shows that for IQ
& memory related tasks, males generally perform worse. However, for attentive and executive function related tests, there is no visible difference (b). When the changes in volume for the brain segments are observed, it is clearly seen that males have larger brains (c). When the volume of one of the segments, thalamus, is visualized with a linear regression line, the sex based difference is found to be significant.
which is a known fact. We analyze further by selecting one of the regions that changed the most,Thalamus volume, and look at its relation with sex (Fig. 3-d). We see that there is a significant change, however, this apparent sex difference in thalamic volume has shown to be negligible when the intracranial volume (ICV) difference between sexes are taken into account [21]. This finding could probably be further explored by normalizing segmented brain volumes with the subject’s ICV (if this measure is available).
Hypothesis 2:Males perform worse inIQ & memory related tests but not in those related toattention & executive function.
age
ge
nde
r
med
IQ
R
age
R
ight
Caudat
e V
ol
um
e
a) b)
c) Elderly Participants ( > 60)
Shrinking segments
Enlarging segments
med
IQ
R
Test Scores
d) Ventricles
[image:9.595.171.447.112.397.2]& CSF space
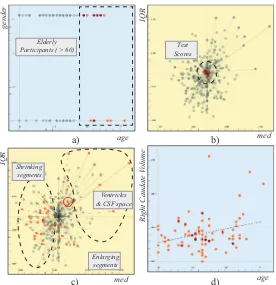
Fig. 4. Elderly patients (> 60 years old) are selected (a). No significant relation is
observed in the test scores (b). When we focus on the volumes of the segments, we see most of the regions are shrinking with age, but some, especially the ventricles, are enlarging (c). Apart from the expected enlargement of the ventricles,the right caudate
is also found to enlarge with age (d).
ob-served (Fig. 4-d). This is an unexpected finding that needs to be investigated further.
Hypothesis 3: There is no significant relation between age and performance in IQ & memory and attentive & executive functions for individuals undergoing a healthy aging. Moreover, in contrast to the most of the brain regions, there is a significant enlargement inthe right caudate in healthy aging individuals.
IQ & Memory Function vs. Brain Segment Volumes. We oppose the first principal components for the two groups of test scores (Fig. 2-a) and select the participants that show better IQ & memory function performance (Fig. 2-b). A linked deviation plot shows the change inmedian and IQRvalues where we observe the change in the imaging related variables (Fig. 2-c). We limit our interest to the variables that are thevolumes of the brain segments by selecting the volume category through a histogram that displays the related meta-data (not shown in the image). In the deviation plot, we see a sub-group of segments (dashed circle) that have lower volumes for the selected participants (i.e., those that showed better performance). Among those segments are the lateral ventri-cles that show a significant change. Lateral ventriventri-cles are filled with cerebrospinal fluid and have no known function in learning and IQ. We use the integrated lin-ear regression computation on a scatterplot showing learning vs. right lateral ventricle volume and observe that there is in fact a negative correlation. This could be explained such that, when the ventricles have larger sizes, it indicates less gray matter volume in the brain parenchyma responsible in cognitive func-tion, and is thus associated with reduced performance in IQ & memory function. However, although ventricles tend to grow with age, we observed no significant relation between aging and the performance (See Hypothesis 3). These are now two related observations that leads to an interesting hypothesis.
Hypothesis 4: Regardless of age, the larger sizes of the ventricles are associated with low performance. However, the (expected) enlargement of the ventricles with aging does not directly influence the overall performance.
non-WM-hypoint. vol.
L
ef
t_L
at
_V
ent
ri
cl
e V
ol
.
a)
MDS1
MD
S2
b)
Volumes for brain segments
[image:11.595.171.447.117.267.2]Correlated Group
Fig. 5.After MDS is applied on the volume dimensions for brain segments, a correlated
group of brain segments is observed (a). Although most of these dimensions are related to the volume of different parts ofthe ventricles (which is expected),non white matter hypointensities (scars on the white matter) is also related. This is an interesting finding which led to an hypothesis on the relation between the enlargement of the scars on the white matter and the ventricles.
process would be increasingly frequent with age, but such relationship between age and non-white matter hypointensities was observed to be insignificant in our analysis.
Hypothesis 5: There is a positive relation between lesions on brain tissue and the volume of the ventricles. However, no significant relation with such lesions and age has been detected, this is likely due to the fact that the study involves only participants going through healthy aging.
5
Discussions, Lessons Learned & Conclusions
In a typical analysis of this data, domain experts usually utilize complex machine learning methods, such as neural networks [1], to analyze the data and confirm hypotheses. With such methods however, the process is not transparent and the results can be hard to interpret.
statistical verification methods. In our current framework, we employ linear re-gression to check for the statistical significance of certain relations (see Fig. 4-d). Such functionalities, and even more advanced inferential statistics, are feasible to incorporate through the embedding of R. Such extensions are desirable for domain experts and can increase the reliability of the results considerably in interactive frameworks.
In this work, we only employed scatterplots and the deviation plot. One can easily extend the selection of visualizations using more advanced methods discussed in the literature. The changes can be encoded by flow-based scatter-plots [25] and the comparison of groups can be enhanced by using clustered parallel coordinates [26].
In a significantly short analysis session, we were able to build 5 hypotheses from the healthy aging data. Building this many potential hypotheses using the conventional analysis process would require a considerable amount of time. Throughout the analysis, we discovered relations that lead to novel hypotheses for the healthy aging domain. In addition, we came up with a number of findings that have been already confirmed in the related literature.
6
Acknowledgments
We would like to thank Peter Filzmoser for the valuable insights on the statistical foundations of this work. The study on cognitive aging was supported by grants from the Western Norway Regional Health Authority (# 911397 and #911687 to AJL and 911593 to AL).
References
1. Mitchell, T.M.: Machine learning. McGraw Hill series in computer science. McGraw-Hill (1997)
2. Chen, J., Chen, Z.: Extended bic for small-n-large-p sparse glm. Statistica Sinica
22(2) (2012) 555
3. Keim, D., Mansmann, F., Schneidewind, J., Thomas, J., Ziegler, H.: Visual ana-lytics: Scope and challenges. Visual Data Mining (2008) 76–90
4. Kehrer, J., Ladst¨adter, F., Muigg, P., Doleisch, H., Steiner, A., Hauser, H.: Hy-pothesis generation in climate research with interactive visual data exploration. IEEE Transactions on Visualization and Computer Graphics (IEEE TVCG)14(6) (Oct 2008) 1579–1586
5. Turkay, C., Filzmoser, P., Hauser, H.: Brushing dimensions – a dual visual anal-ysis model for high-dimensional data. IEEE Transactions on Visualization and Computer Graphics17(12) (dec. 2011) 2591 –2599
6. Andersson, M., Ystad, M., Lundervold, A., Lundervold, A.: Correlations between measures of executive attention and cortical thickness of left posterior middle frontal gyrus - a dichotic listening study. Behavioral and Brain Functions5(41) (2009)
are important predictors for memory function in elderly women. BMC medical imaging 9(1) (2009) 17
8. Ward, M.O.: Xmdvtool: integrating multiple methods for visualizing multivari-ate data. In: Proceedings of the conference on Visualization ’94. VIS ’94, IEEE Computer Society Press (1994) 326–333
9. Yang, J., Hubball, D., Ward, M., Rundensteiner, E., Ribarsky, W.: Value and relation display: Interactive visual exploration of large data sets with hundreds of dimensions. Visualization and Computer Graphics, IEEE Transactions on 13(3) (may-june 2007) 494 –507
10. Team, R.D.C.: R: A Language and Environment for Statistical Computing. R Foundation for Statistical Computing. (2009)
11. Turkay, C., Parulek, J., Hauser, H.: Dual analysis of dna microarrays. In: Pro-ceedings of the 12th International Conference on Knowledge Management and Knowledge Technologies. i-KNOW ’12 (2012) 26:1–26:8
12. Hodneland, E., Ystad, M., Haasz, J., Munthe-Kaas, A., Lundervold, A.: Auto-mated approaches for analysis of multimodal mri acquisitions in a study of cogni-tive aging. Comput. Methods Prog. Biomed.106(3) (June 2012) 328–341 13. Ystad, M., Eichele, T., Lundervold, A.J., Lundervold, A.: Subcortical functional
connectivity and verbal episodic memory in healthy elderly – a resting state fmri study. NeuroImage52(1) (2010) 379 – 388
14. Wechsler, D.: Wechsler abbreviated scale of intelligence. Psychological Corporation (1999)
15. Delis, D.C.: California verbal learning test. Psychological Corporation (2000) 16. Wechsler, D.: Wechsler adult iintelligence scale-iii (wais-iii). Psychological
Corpo-ration, San Antonio (1997)
17. Delis, D.C., Kaplan, E., Kramer, J.H.: Delis-Kaplan executive function system. Psychological Corporation (2001)
18. Reitan, R., Davison, L.: Clinical neuropsychology: current status and applications. Series in Clinical and Community Psychology. Winston (1974)
19. FreeSurfer: http://surfer.nmr.mgh.harvard.edu (2012)
20. Scheffer, J.: Dealing with missing data. Research letters in the information and mathematical sciences3(1) (2002) 153–160
21. Sullivan, E.V., Rosenbloom, M., Serventi, K.L., Pfefferbaum, A.: Effects of age and sex on volumes of the thalamus, pons, and cortex. Neurobiology of aging 25(2) (2004) 185–192
22. Walhovd, K.B., Fjell, A.M., Reinvang, I., Lundervold, A., Dale, A.M., Eilertsen, D.E., Quinn, B.T., Salat, D., Makris, N., Fischl, B.: Effects of age on volumes of cortex, white matter and subcortical structures. Neurobiology of aging 26(9) (2005) 1261–1270
23. Hawkins, D.M., et al.: The problem of overfitting. Journal of chemical information and computer sciences44(1) (2004) 1–12
24. Kohavi, R., et al.: A study of cross-validation and bootstrap for accuracy estimation and model selection. In: International joint Conference on artificial intelligence. Volume 14., Lawrence Erlbaum Associates Ltd (1995) 1137–1145
25. Chan, Y.H., Correa, C.D., Ma, K.L.: Flow-based scatterplots for sensitivity analy-sis. In: Visual Analytics Science and Technology (VAST), 2010 IEEE Symposium on, IEEE (2010) 43–50