Ion acceleration and plasma jet formation in ultra-thin foils undergoing
expansion and relativistic transparency
M. Kinga, R. J. Graya, H. W. Powella, D. A. MacLellana, B. Gonzalez-Izquierdoa, L. C. Stockhausenb, G. S. Hicksc,
N. P. Doverc, D. R. Rusbya,d, D. C. Carrolld, H. Paddaa, R. Torresb, S. Kare, R. J. Clarked, I. O. Musgraved, Z. Najmudinc, M. Borghesie, D. Neelyd, P. McKennaa
aSUPA Department of Physics, University of Strathclyde, Glasgow G4 0NG, UK
bCentro de Laseres Pulsados (CLPU), Parque Cientifico, Calle del Adaja s/n. 37185 Villamayor, Salamanca, Spain cThe John Adams Institute for Accelerator Science, Blackett Laboratory, Imperial College London, London SW7 2BZ, UK
dCentral Laser Facility, STFC Rutherford Appleton Laboratory, Oxfordshire OX11 0QX, UK eCentre for Plasma Physics, Queens University Belfast, Belfast BT7 1NN, UK
Abstract
At sufficiently high laser intensities, the rapid heating to relativistic velocities and resulting decompression of
plasma electrons in an ultra-thin target foil can result in the target becoming relativistically transparent to the laser
light during the interaction. Ion acceleration in this regime is strongly affected by the transition from an opaque to
a relativistically transparent plasma. By spatially resolving the laser-accelerated proton beam at near-normal laser
incidence and at an incidence angle of 30◦, we identify characteristic features both experimentally and in
particle-in-cell simulations which are consistent with the onset of three distinct ion acceleration mechanisms: sheath acceleration;
radiation pressure acceleration; and transparency-enhanced acceleration. The latter mechanism occurs late in the
interaction and is mediated by the formation of a plasma jet extending into the expanding ion population. The effect
of laser incident angle on the plasma jet is explored.
1. Introduction 1
Intense laser-driven ion acceleration from thin foils
2
offers a route towards the creation of compact, high
en-3
ergy, short pulse ion sources. These sources could
po-4
tentially be applied to ion oncology and the fast ignition
5
approach to inertial confinement fusion [1, 2]. Over
6
the past 15 years, the target normal sheath
accelera-7
tion (TNSA) mechanism [3] has been investigated as a
8
promising acceleration mechanism to achieve this end.
9
Whilst much progress has been made, the spectral
con-10
trol and high maximum energies required (particularly
11
Email address:[email protected](P. McKenna)
for oncology) has not yet been achieved [4, 5]. Recent
12
advances in ultra-thin foil targetry and enhancements in
13
laser peak intensity and contrast have led to
investiga-14
tions of new acceleration mechanisms, with promising
15
potential for ion energy scaling and spectral and
diver-16
gence control.
17
The irradiation of sub-µm-thick foils with
ultra-18
intense (>1020Wcm−2) laser pulses can result in a
vari-19
ety of ion acceleration mechanisms. The TNSA
mech-20
anism will typically occur early on the rising edge of
21
the laser pulse as electrons at the target front side are
22
heated and drive the formation of sheath fields. As
the laser intensity continues to increase on the rising
24
edge, the radiation pressure acceleration (RPA)
mecha-25
nism [6], in which the target surface is directly driven
26
forward due to the pressure of the incident laser
ra-27
diation, can occur. This mechanism is predicted to
28
produce an ion beam with a narrow energy spectrum,
29
low divergence and a favourable energy scaling [7, 8].
30
In the case of ultra-thin (nanometer-scale) foil targets,
31
the RPA mechanism can become unstable to
Rayleigh-32
Taylor-like transverse instabilities, resulting in
bubble-33
like structures in the resulting proton beam [9]. If
dur-34
ing the interaction the plasma electron population heats
35
and decompresses to the extent that the target
under-36
goes relativistic-induced transparency (RIT) [10], RPA
37
ceases and the remainder of the laser pulse propagates
38
through the target. This gives rise to volumetric heating
39
of the target electrons, which can enhance the energy of
40
the TNSA accelerated ions. This mechanism is referred
41
to as transparency-enhanced acceleration or the
break-42
out afterburner (BOA) scheme [11, 12]. The collective
43
plasma electron response to the onset of RIT can give
44
rise to asymmetric electron beam distributions [13] and
45
controllable plasma structures [14]. We have recently
46
shown that in the case of relatively long (hundreds of
47
femtoseconds) laser pulses, the plasma can expand tens
48
of microns during the laser pulse interaction, giving rise
49
to conditions in which a jet of high energy electrons can
50
be produced, driving enhanced laser energy coupling in
51
a localised region of the sheath-acceleration ion
popula-52
tion [15].
53
In this article, following on from results reported in
54
our earlier paper [15], we report on the influence of the
55
angle of incidence of the laser light on the formation
56
of the plasma jet and the complex dynamics occurring
57
during the onset of RIT.
58
Target Normal
Laser Axis
Target RCF Stack
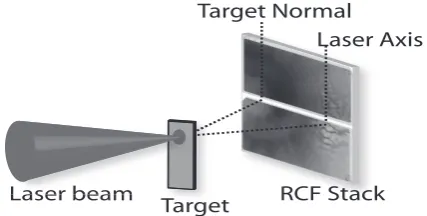
[image:2.595.308.522.111.219.2]Laser beam
Figure 1: Schematic illustrating the experimental arrangement.
2. Experiment results 59
Using the Vulcan petawatt laser at the Rutherford
Ap-60
pleton Laboratory, pulses of 1.054µm-wavelength light,
61
with (1.0±0.2) ps duration (full width at half maximum
62
(FWHM)) and (200±15) J energy were focused onto an
63
aluminium target with a thickness of 10 nm. The spot
64
size was 7.3 µm (FWHM) producing a peak intensity
65
of 2×10²⁰ Wcm−2. A plasma mirror was employed to
66
improve the laser intensity contrast by a factor of≈100.
67
The angle of incidence of the laser light with respect to
68
the target normal was set at either near-normal ( 0◦) or 69
30◦. In all cases the laser pulse was p-polarized. 70
The focus of the experimental results presented here
71
is the proton spatial-intensity profile, as measured
us-72
ing a stack of radiochromic (dosimetry) film (RCF). The
73
stack contains filters which enables the energy of the
74
protons stopped at each RCF layer to be set. It was
po-75
sitioned 7.5 cm behind the target with the centre off-set
76
to position the laser axis close to one side as illustrated
77
in Fig. 1. Both the beams of protons accelerated along
78
the laser axis and target normal can be detected on the
79
same RCF stack when the incident angle is changed to
80
30◦. A narrow slot along the central horizontal axis of
81
the stack enabled ion energy spectra measurements
us-82
ing a Thomson parabola spectrometer.
83
Example measurements of the proton
A
C
A
B
B
(a) (b)
Figure 2: Proton spatial-intensity profiles in the energy range 5-7
MeV, for a 10 nm-thick aluminium target at an laser incident angle
to the target of: (a) 0◦(b) 30◦. Dashed circular lines indicate radii at
15◦and 30◦centred on the laser propagation axis. Feature A indicates
a ring-like distribution around target normal, B indicates bubble-like
structures directed along laser-axis and feature C indicates a localised,
higher proton energy feature.
intensity distribution, obtained with a 10 nm-thick
alu-85
minium target irradiated at 0◦ and 30◦ incident angle
86
is shown in Fig 2. The dashed lines are reference
cir-87
cles corresponding to 15◦ and 30◦ with respect to the
88
laser propagation axis. From these measurements, it is
89
clearly observed that different proton beam features are
90
separated when the target is irradiated at an oblique
an-91
gle. Three features are observed, and labelled A, B and
92
C in Fig. 2 to aid the discussion below.
93
The annular ring-like distribution (labeled feature A)
94
is consistent with proton spatial profiles previously
mea-95
sured in targets undergoing RIT [12, 16]. For this
partic-96
ular target, the ring has a divergence half-angle of∼12◦. 97
From 2(a), feature A is centred directly along the laser
98
propagation axis for an incidence angle of 0◦. The pro-99
tons present in this feature have been driven by TNSA at
100
the rear of the target. This is demonstrated in Fig. 2(b)
101
when the angle of incidence is changed to 30◦. In this
102
case, the annular ring-like structure is still present with
103
a similar divergence half-angle, centred at∼30◦ which
104
is along the target normal axis.
105
Feature B comprises small bubble-like structures,
106
similar to that observed due to the transverse
instabil-107
ities associated with RPA [9]. In Fig 2(a) these
bubble-108
like structures are contained within a circular area up to
109
∼15◦ around the laser propagation axis. As these are 110
structures associated with RPA in an expanding plasma,
111
they are observed along the laser axis in Fig 2(b). The
112
bubbles appear elongated along the laser polarization
113
axis, suggesting an additional effect from interacting at
114
a non-normal incidence.
115
Feature C is difficult to distinguish at near-normal
in-116
cidence in Fig. 2(a) as it overlaps with the bubble-like
117
structures. When irradiating at 30◦ incidence angle, a 118
strong feature can be seen between the target normal
119
and the laser axes. This is associated with the
forma-120
tion of an electron jet from the rear of the target that is
121
created in the expanding plasma as the target undergoes
122
RIT [15]. This jet feature is found to be susceptible to
123
hosing and is observed to vary in position from
shot-to-124
shot. It is thus problematic to measure the ion energy
125
spectrum produced by this feature using a fixed
spec-126
trometer sampling a small solid angle. From the RCF
127
data, feature A is only observed up to energies of∼15
128
MeV, whereas feature C is observed up to ∼26 MeV.
129
The maximum energy of feature B is harder to
deter-130
mine because the bubble-like structure is hard to resolve
131
at higher energies. A fuller discussion of the proton
en-132
ergies, together with spectra, is presented in reference
133
[15].
134
3. Simulation results 135
To investigate the features observed experimentally,
136
2D and 3D PIC simulations were undertaken using the
137
EPOCH code [17]. For the 2D simulations, the
simula-138
tion box was defined as 130 µm×72µm, with 26000
139
× 7200 mesh cells. The simulations were run with a
−20 0 20 40 60 80 −20 0 20 40 60 80
−20 0
(b) (a)
(d) (c)
20 40 60 80 −20 0 20 40 60 80
−10 0 10 −10
−3 1
0
Y(
µm)
log(n
e
/nc
)
Y(
µm)
X(µm) X(µm)
X(µm) X(µm)
10
H+
C
Target normal Laser axis Laser axis
Laser axis Laser axis
Target normal Target normal
Target normal
A A
A C
Al11+ Al11+ H+
−3 0
log(n
i
/nc
[image:4.595.68.528.118.295.2])
Figure 3: Top row: 2D PIC results showing electron density for the target initialised at (a) 0◦and (b) 30◦incident angle to the laser. Bottom row:
density of the Al11+and H+ions initialised at (c) 0◦and (d) 30◦incident angle to the laser. All plots are shown at an example time of 0.3 ps after
the peak of the laser pulse has reached the target surface. The laser pulse is incident from the left along the Y=0 axis. The dotted lines mark the laser and target normal axes.
target thickness of 40 nm due to computational
con-141
straints at the resolution required for 10 nm simulations.
142
The main target was initialised with an electron density
143
ne=630nc (where ncis the critical density) neutralised 144
with the Al11+ions. A neutral layer of 12 nm H+ions
145
with ne=60ncis initialised on the rear of the target, to 146
act as proton source. The initial electron temperature for
147
both the target and the surface layer is set to 10 keV. To
148
simplify the simulation, there is no front surface layer
149
and no carbon or oxygen species present. Simulations
150
are undertaken with the target at both normal incidence
151
to the laser and at a 30◦incidence. The incoming laser
152
pulse was linearly polarised along the Y-axis and
fo-153
cused to a transverse Gaussian profile with a FWHM of
154
5µm at the front of the target (defined as X=0µm) with
155
the temporal profile defined as a Gaussian pulse with a
156
FWHM of 570 fs.
157
In the 3D simulations, the simulation box was defined
158
as 55 µm× 14.4 µm× 14.4 µm with 2000× 360 ×
159
360 mesh cells. Due to the reduction of mesh resolution
160
the target (Al11+) and contamination layer (H+) was
pre-161
expanded to a Gaussian spatial profile along the target
162
normal axis with a peak electron density of ne=53ncand 163
ne=5nc maintaining the same areal density as the 2D 164
simulation. Simulations were run with the target at both
165
0◦and 30◦incidence. The laser pulse temporal duration 166
was slightly reduced to 500 fs and the spatial profile was
167
focused to a 2D Gaussian profile with a FWHM of 5µm
168
at the front of the target, again linearly polarised along
169
the Y-axis.
170
Fig. 3 shows example density plots of the electrons
171
(a)-(b) and ions (c)-(d) for simulations at both 0◦ and
172
30◦ incidence angle, 0.3 ps after the peak of the laser
173
pulse has interacted with the target. In both cases the
174
laser pulse enters the system at X=-30µm, with the
spa-175
tial profile centred at Y=0µm. As the laser pulse
inter-176
acts with the target, expansion of both the main Al11+
177
target and H+ contaminant layer occurs. Due to their
178
higher charge-to-mass ratio, the H+ions expand in front
179
of the Al11+ions. The highest energy Al11+ions push
[image:4.595.56.533.379.757.2]against the rear of the H+layer, driving them out
radi-181
ally. This forms the ring-like feature A, as observed in
182
the RCF data. Further investigation of this effect will
183
be the subject of future work. As this process is formed
184
due to the target normal expansion of the ions, feature
185
A can always been seen to be centred around the target
186
normal direction for both the 0◦and 30◦incidence angle
187
cases.
188
A plasma jet structure, corresponding to feature C, is
189
clearly observed at both incident angles. As discussed
190
in Powellet al. [15], this jet is formed as the target
191
undergoes RIT, and is contained by a self-generated
az-192
imuthal magnetic field. The portion of the laser pulse
193
which is transmitted through the remainder of the
tar-194
get during RIT directly accelerates electrons in the jet
195
to energies higher than the background electrons heated
196
earlier in the laser pulse interaction. This in turn results
197
in a localised energy increase in the sheath-accelerated
198
ion population [15]. When the laser is at near-normal
in-199
cidence, the jet is primarily directed along the common
200
laser and target normal axis over a distance of∼50µm,
201
into the H+layer, before it becomes subject to a
hosing-202
like instability as the plasma density decreases. For the
203
case of 30◦incidence, the jet is initially directed along 204
the laser axis, but deviates more quickly due to the local
205
plasma density asymmetry around it. The enhancement
206
in the proton energy thereby typically occurs at an angle
207
between the laser axis and the target normal direction.
208
We note that in the experiment results, feature C is
al-209
ways observed at angle between these two axes when
210
irradiating the target at 30◦incidence. 211
The overall results for the 3D simulations are in good
212
agreement with the 2D simulations [15] and enable the
213
proton distribution in the Y-Z plane (the plane of the
214
detector) to be plotted, enabling feature B to be more
215
−10 −5 0
(a)
A
B
5 10
−10
−5
0
5
10
−10 −5 0 5 10
Z(
µm)
−1 1
log(ni) (arb.)
(b)
Y(µm) Y(µm)
[image:5.595.311.530.114.220.2]B
C
A
Figure 4: 3D results showing a summation of the proton density in the
Y-Z plane for energies<15 MeV with the target initialised at (a) 0◦
and (b) 30◦incidence.
clearly observed, as seen in Fig 4. This figure shows the
216
density of the summation of the lower energy band (<15
217
MeV) of the protons and thus enables a comparison with
218
the RCF measurements in Fig 2. Fig 4(a) shows the 0◦ 219
incidence case, and looks very similar to that of Fig 2(a).
220
The ring-like feature A is again centred along the laser
221
axis and contains an unstable structure similar to that
222
of feature B. At this incidence angle it is again difficult
223
to observe feature C as it overlaps with the bubble-like
224
instability structure. At 30◦ incidence angle, these
fea-225
tures can be resolved in Fig 4(b). The ring-like structure
226
has clearly moved to be centred along the target normal
227
direction. In the experimental case, the ions have 7.5 cm
228
distance to travel before reaching the RCF diagnostic,
229
whereas in the 3D simulations they are diagnosed at an
230
approximate distance of 20µm from the target. This
re-231
sults in the ring-like structure overlapping with the laser
232
axis features. The unstable structures remain centred
233
along the laser axis, although the overlapping
distribu-234
tions make this difficult to clearly resolve. The short
235
sample distance from the target means that the jet
(fea-236
ture C) also overlaps with the edge of feature A (a longer
237
propagation distance is required for the jet to steer off
-238
axis). Nevertheless, the localised proton energy is
en-239
hanced in this region due to the presence of the electron
jet, as discussed in reference [15].
241
4. Summary 242
In summary, the interaction of an ultraintense laser
243
pulse with an ultrathin foil target undergoing expansion
244
and RIT has been investigated experimentally and
nu-245
merically. When irradiating the target at an oblique
an-246
gle of incidence, three distinct components are observed
247
in the spatial-intensity profile of proton beam, which
248
have characteristic signatures of three distinct ion
accel-249
eration mechanisms. The effect of the laser incidence
250
angle on the characteristics of a plasma jet generated
251
during the onset of RIT has been explored. The
elec-252
trons in this jet are directly accelerated to higher
en-253
ergy by the laser pulse and couple additional energy to
254
a local region of the sheath-accelerated proton
distribu-255
tion, enhancing both the flux and maximum energy of
256
the protons in this region. The higher flux, evidenced
257
in the proton density plots in Fig 2, is produced by the
258
Coulombic interaction between the electron jet and the
259
background protons and the higher energies result from
260
an additional longitudinal electrostatic field produced in
261
the region of the jet, as discussed in reference [15]. The
262
effect of the laser incidence angle on the jet formation,
263
direction and energy coupling to ions will be
investi-264
gated in more detail in a future experiment.
265
5. Acknowledgments 266
We acknowledge the support of Central Laser Facility
267
staffand the use of the ARCHIE-WeST and ARCHER
268
computers. This work is supported by EPSRC
269
(grants: EP/J003832/1, EP/L001357/1, EP/K022415/1,
270
EP/J002550/1 and EP/L000237/1), the US Air Force
271
Office of Scientific Research (grant:
FA8655-13-1-272
3008) and LASERLAB-EUROPE (grant: 284464).
273
LCS acknowledges the EU-funded LA3NET
consor-274
tium (grant: GA-ITN-2011-289191). EPOCH was
de-275
veloped under EPSRC grant EP/G054940/1. Data
asso-276
ciated with research published in this paper is accessible
277
at http://dx.doi.org/10.1088/1367-2630/17/10/103033.
278
References 279
[1] H. Daido, et al., Rep. Prog. Phys. 75 (2012) 056401, and refer-280
ences therein. 281
[2] A. Macchi, et al., Rev. Mod. Phys. 85 (2013) 751, and references 282
therein. 283
[3] S. C. Wilks, et al., Phys. Plasmas 8 (2001) 542. 284
[4] J. Fuchs, et al., Nat. Phys. 2 (2006) 48–54. 285
[5] L. Robson, et al., Nat. Phys. 3 (2007) 58–62. 286
[6] T. Esirkepov, et al., Phys. Plasmas 92 (2004) 175003. 287
[7] A. Macchi, et al., Phys. Plasmas 92 (2004) 175003. 288
[8] S. Kar, et al., Phys. Rev. Lett. 109 (2012) 185006. 289
[9] C. A. J. Palmer, et al., Phys. Rev. Lett. 108 (2012) 225002. 290
[10] V. A. Vshivkov, et al., Phys. Plasmas 5 (1998) 2727. 291
[11] L. Yin, et al., Laser Part. Beams 24 (2006) 291. 292
[12] D. Jung, et al., New. J. Phys. 15 (2013) 123035. 293
[13] R. J. Gray, et al., New. J. Phys. 16 (2014) 093027. 294
[14] B. Gonzalez-Izquierdo, et al., Nat. Phys. (2016) doi: 295
10.1038/nphys3613. 296
[15] H. W. Powell, et al., New. J. Phys. 17 (2015) 103033. 297
[16] N. P. Dover, et al., New. J. Phys. at press. 298
[17] T. D. Arber, et al., Plasma Phys. Control. Fusion 57 (2015) 299