City, University of London Institutional Repository
Citation
:
Aitken, L. M., Macfarlane, B., Chaboyer, W., Schuetz, M., Joyce, C. & Barnett, A. G. (2015). Physical Function and Mental Health in Trauma Intensive Care Patients: A 2-Year Cohort Study. Critical Care Medicine, 44(4), pp. 734-746. doi:10.1097/CCM.0000000000001481
This is the accepted version of the paper.
This version of the publication may differ from the final published
version.
Permanent repository link:
http://openaccess.city.ac.uk/13446/Link to published version
:
http://dx.doi.org/10.1097/CCM.0000000000001481Copyright and reuse:
City Research Online aims to make research
outputs of City, University of London available to a wider audience.
Copyright and Moral Rights remain with the author(s) and/or copyright
holders. URLs from City Research Online may be freely distributed and
linked to.
City Research Online: http://openaccess.city.ac.uk/ publications@city.ac.uk
1
Title: Physical function and mental health in trauma intensive care patients: a 2 year cohort
study
Leanne M Aitken, RN, PhD, FACN, FAAN, FACCCN
Professor of Critical Care Nursing
Centre for Health Practice Innovation, Griffith Health Institute, Griffith University;
Intensive Care Unit, Princess Alexandra Hospital, Brisbane; School of Health Sciences, City
University London
l.aitken@griffith.edu.au
Ph. +61 7 3176 7256
Fax. +61 7 3176 7356
Bonnie Macfarlane, BHSc (Public Health), MPH (Epidemiology and Biostatistics)
Epidemiologist/Data Analyst, Critical Care Nursing Research Team
Princess Alexandra Hospital & Griffith University, Brisbane, Queensland
Wendy Chaboyer, RN, PhD
Director, NHMRC Centre of Research Excellence in Nursing Interventions for Hospitalised
Patients, Centre for Health Practice Innovation (HPI), Griffith University, Gold Coast campus
Michael Schuetz, FRACS, FAOrthA, Dr med (RWTH Aachen), Dr med. Habil (HU Berlin),
Director of Trauma Service & Professor of Trauma, Princess Alexandra Hospital and
2 Christopher Joyce MB, ChB, PhD, FANZCA, FCICM
Director of Intensive Care, Princess Alexandra Hospital; Associate Professor, School of
Medicine, University of Queensland, Brisbane
Adrian G Barnett, BSc, PhD
Associate Professor, School of Public Health and Social Work & Institute of Health and
Biomedical Innovation
Queensland University of Technology, Brisbane
Institution where the work was performed: Princess Alexandra Hospital, Brisbane,
Australia
Address for reprints: Leanne M Aitken, Professor of Critical Care Nursing, School of
Nursing and Midwifery, 170 Kessels Rd, Nathan, Griffith University, Brisbane, Qld 4111,
Australia.
Conflicts of Interest and Source of Funding: This study was supported by the PA Research
Foundation. The authors declare no conflict of interest.
Key words: Recovery of Function; Critical Care; Health Status; Illness Perception;
Self-Efficacy
3
ABSTRACT
Objectives: This study was designed to examine changes in function over time after injury
and to identify factors associated with long-term recovery that may be amenable to change
through intervention.
Design: Prospective cohort study
Setting: Intensive Care in a tertiary hospital in Queensland, Australia
Patients: Adult (n=123) admitted to Intensive Care for treatment of injury.
Interventions: Data were collected prior to hospital discharge and 1, 6, 12, and 24 months
post injury. Data included demographics, pre-injury health, injury characteristics, acute care
factors, psychosocial measures and health status. Linear mixed effects modelswere used to
identify factors associated with physical function and mental health over time.
Measurements and Main Results: Physical function and mental health improved over time,
however the averages remained below Australian norms at 24 months. Optimistic perception
of illness and greater self-efficacy were potentially modifiable factors associated with
improved mental health and physical function over time. Greater perceived social support,
also potentially modifiable, was associated with improved mental health. Injury insurance
and income were significant non-modifiable factors for mental health, with mental health
gains associated with higher income. Hospital length of stay and injury insurance were
non-modifiable factors linked with physical function.
Conclusions: Improvements in physical function and mental health are evident in the 24
months following injury but most patients remain below Australian population norms. Factors
4 potentially amenable to change include illness perception, self-efficacy and perceived social
support.
5
INTRODUCTION
Injury is a major cause of preventable mortality and morbidity worldwide (1-3).
Injured patients experience reduced quality of life (4-6), functional ability (7-9) and
psychological status that is sustained over time (10-12). Probably as a result of this reduced
function, injured patients have a greater ongoing use of health services (13) than others in the
community (14). Although there is widespread evidence of reduced function during recovery
after injury, the predictors of that function are not fully understood. It is recognised that a
range of factors influence function after injury, based on the biopsychosocial view of health
(15). These include various aspects of a person’s health condition including diseases,
disorders and injuries and both personal (education, coping styles, character) and
environmental (social attitudes and support, housing) contextual factors.
Some known predictors of recovery after injury include age, gender, education, injury
type and severity, duration of hospitalisation and comorbidities (8, 9, 11, 12, 16-19), however
these factors are generally not modifiable during the initial hospital stay. Initial evidence
suggests that potentially modifiable factors such as early post-ICU distress (11), early
physical and mental function (20), illness perception (21), self-efficacy (22-24) and
depression after hospital discharge (25) may influence recovery, although the latter three
factors have only been examined in those with minor or chronic injuries rather than the
seriously injured patient population. Further, much of the evidence of reduced function
during recovery and associated factors has been limited to relatively short time-frames of
approximately one year (11, 17, 19, 26). As many of the study participants continued to
report reduced function at one year, further examination of longer term outcomes was
warranted.
Given the complexity of injured patients’ recovery pathway, it is likely that complex
6 MRC guidance (27), measurement of associations between recovery and patient, illness and
care characteristics are needed. Identification of potentially modifiable factors that influence
recovery will enable development of theoretically derived, evidence-based interventions to
improve physical and psychological health during recovery after injury. Outcomes of interest
in this study were the physical function (PF) and mental health (MH) subscales of the
SF-36v2 (28). Although the original intention had been to use the Physical Health Component
Score (PCS) and Mental Health Component Score (MCS) as the outcomes of interest, the PF
and MH subscale scores were chosen over these summary scores given the documented
problems with correlation between the PCS and MCS (29); this decision was made prior to
the commencement of analysis. The aim of this study was to examine changes in physical and
psychological function over time and to identify potentially modifiable factors related to
improved recovery in trauma intensive care patients.
MATERIALS AND METHODS
A prospective cohort of trauma patients who required admission to ICU in a tertiary
referral hospital in south-east Queensland, Australia were consecutively recruited from June
2008 to August 2010. Injured patients were those allocated an injury code within the
International Classification of Diseases, 10th Revision – Australian Modification
(ICD-10-AM), in other words those patients injured through physical force such as road traffic crashes,
falls, physical violence, and recreational injury. Patients were excluded for the following
reasons: (1) spinal cord injuries with sensory and/or motor loss; (2) burn injuries to >20% body
surface area; (3) traumatic brain injuries with a Glasgow Coma Score <14 after 24 hours or on
extubation; (4) history of psychosis or self-inflicted injury; (5) inability to communicate in
English; (6) prisoners; (7) people without a home telephone; (8) palliative care/patients
expected to die. The detailed methods and baseline demographic, injury and clinical
7 Data were collected from hospital records and directly from the participants prior to
hospital discharge, with follow-up at 1, 6, 12, and 24 months after acute hospital discharge.
Follow-up questionnaires were posted to participants asking them to complete the
questionnaires within the next week, without assistance from family members or friends and
return them via mail or provide data to the research assistant during phone interview. The
national death registry was searched for all participants who could not be located at
follow-up.
Information was collected on demographic and socioeconomic details, pre-injury
health, injury characteristics and acute care factors. There is ample evidence that health prior
to critical injury or illness affects long term recovery (30-32) therefore it was essential that
injury health be incorporated into analysis. Two methods exist for measurement of
pre-injury health including proxy measure and retrospective measure by the patient; given the
inconsistent results reported in regard to the proxy measure of health status (33) we used
patients’ retrospective self-report of health status (34) in line with other studies conducted in
the severely injured trauma population(35). Other factors measured included psychosocial
factors (self-efficacy [SE] (36), illness perception [IP] (37), perceived social support
[MSPSS] (38), post-traumatic stress disorder [PTSD] symptoms using the PTSD Checklist –
Civilian version [PCL], (39) psychological distress using the Kessler Psychological Distress
Scale [K10] (40)) and health status using the Medical Outcome Study Short Form-36 Version
2 [SF-36] (28) (see Table 1 for details). The outcomes of interest were the physical function
(PF) and mental health (MH) subscales of the SF-36.
Data analysis
Categorical data are reported as percentages and continuous data are reported as mean
and standard deviation (SD) or median and interquartile range (IQR). Comparisons of the
8 (those who did not complete 24 month follow-up) were made using chi-square or Fisher’s
exact test, t-test for differences in means, and nonparametric tests for rank differences.
Summary scores for PF and MH domains are presented as standardised scores using a
population mean of 50 and standard deviation of 10 (41). Mixed effect regression models
with a random intercept per subject were used to find predictors of long-term health whilst
accounting for repeated data from the same subjects.
A multi-staged modelling process was used to determine predictors of long-term
health. Important predictors were identified by first using regression tree analysis (42) to
reduce the large number of variables down to a subset of less than ten, and then an exhaustive
search to identify the best set of predictors for the mixed regression models. Exhaustive
model selection searches across all possible models and find subsets of variables that yield a
‘good’ model based on the Akaike Information Criteria (AIC). The AIC provides the criteria
for model selection, where the model with a lower AIC is favoured (43). This is a feasible
approach when the number of variables is moderate and is considered a good starting point
when dealing with a larger number of competing factors (44). Predictors identified were then
used in the mixed regression models to estimate predictors of outcome over the 24 months of
follow-up. Model results are expressed as unstandardized coefficients (means), 95%
confidence intervals and p values. Model diagnostics included assessment of influential
observations and residual checks to assess normality assumption for linear mixed models. To
check for collinearity amongst predictors and model over-fitting we used the variance
inflation factor (VIF) dropping variables that had a VIF over 5.
Logistic regression was used to identify predictors of drop-out using baseline
variables (which had almost no missing data), and to estimate inverse probability weights
(IPWs) to compensate for drop-out (45). The variables used to predict drop-out were: time (6,
9 length of stay. Weighting the observed data with IPWs to account for drop-outs had little
impact on final model estimates (IPWs: median 1.5, range 1.1 to 3.9), indicating minimal
impact of drop-outs for these results. Data analyses were performed using Stata 11
(Statacorp/Texas) and R (3.0.2).
Ethical Considerations
This study received approval from Griffith University (NRS/16/08/HREC) and
Princess Alexandra Hospital (2008/059) Human Research Ethics Committees. All
participants provided written informed consent in hospital and reconfirmed this verbally prior
to each data collection point.
RESULTS
Two-hundred and seven patients were identified as eligible, of these 123 patients
consented and provided baseline (in-hospital) data. Response rates reduced over the 24 month
period but remained over 56% at all follow-up (Figure 1). Study participants were similar in
characteristics to the total cohort of eligible trauma patients in the study ICU over the period
of recruitment where females represented one fifth of the trauma caseload, patients averaged
40 years of age and stayed in ICU for approximately 4 days. Those participants who
completed data collection (i.e. responders) were older than those who were lost to follow-up
(i.e. non-responders) and reported better psychological health on both the K10 and the PCL at
one month (Table 2), but were similar in regard to all other measures. We compensated for
this informative drop-out in our regression models.
Characteristics of participants
Detailed baseline, 1 and 6 month characteristics of the cohort are published elsewhere
(10). In summary, the majority of participants were male and young and spent an average of 3
days in ICU and 20 days in hospital after experiencing serious injury (Table 3). Injuries
10 22%) and other injuries (n=25, 20%). Two-thirds were the result of a road traffic crash and
15% from falling (Table 3).
Mental and physical health over 24 months
There was improvement in both physical function (PF) and mental health (MH)
subscale scores over time, yet both still remained below Australian population norms (Figure
2). The largest improvement in PF was evident in the first 12 months following injury, when
PF scores improved by an average 9 units. A smaller improvement occurred from 12 to 24
months. Although mental health was not as far below the population norms as physical
function, it increased by an average of only 4 units over time (Table 4). Similar changes in all
SF-36 domains were reported over the 24 month follow-up (Figure 3). Average physical
function scores at 6, 12 and 24 months were significantly different from one month scores,
whereas there were no statistically significant differences in mean mental health scores over
time.
Psychological health
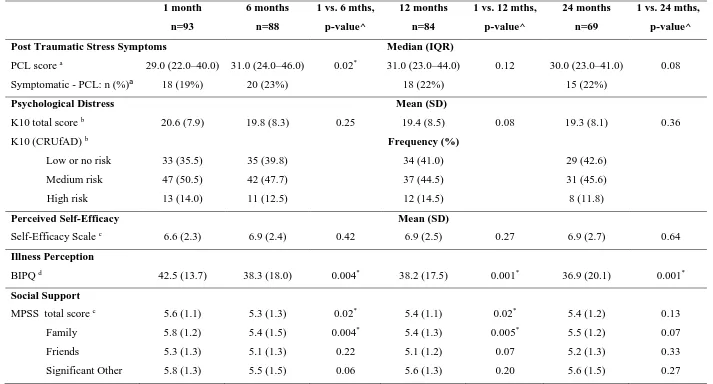
Post-traumatic stress symptom scores (PCL) improved significantly from one to six
months (p=0.02), although a two unit increase is not considered as clinically significant
{Weathers, 2013 #32156}. Mean scores at 12 and 24 months remained high but were not
significantly different from one month scores (Table 5). The percentage of patients
considered symptomatic for PTSD on the PCL remained constant over time, at around 20% at
each follow-up. Five out of the 15 participants considered symptomatic at 24 months showed
no PTSD symptoms at any prior follow-up. The remaining 10 were symptomatic at some
point prior, with half reporting PTSD symptoms at all four follow-up points. From the 54
participants considered non-symptomatic at 24 months, 17% reported PTSD symptoms at
11 Psychological distress scores on the K10 showed little change over time. Two-thirds
of participants were classified medium or high risk for psychological distress at one month.
Although this percentage decreased over time, more than 50% of patients remained at
medium to high risk of psychological distress throughout the 24 month period. All
participants classified as high risk for psychological distress at 24 months (n=8) had been
medium to high risk at some prior follow up, and three were high risk at all four follow-ups.
Around 60% of participants at low to no risk at 24 months (n=29) reported medium to high
risk for psychological distress at a prior follow-up point, only 12 participants reported low to
no risk at all four follow-ups. There was no significant change in mean K10 scores over time
(Table 5).
Self-efficacy increased (i.e. better perceived ability to undertake tasks and achieve
results) slightly from one to six months, but then remained unchanged at 12 to 24 months;
changes in mean scores over time were not statistically significant. There was a gradual
decline in illness perception over time, (which is viewed as positive as the perception of the
influence the injury has had on one’s life reduces) the largest reduction occurring over the
first six months post discharge. Mean perception scores at 6, 12 and 24 months were all
significantly lower than one month scores (Table 5).
Perceived social support reduced from 1 month to 12 months post hospital discharge,
with perceived family support showing the most significant decline. There were negligible
changes from 6 months onward for all sources of social support other than family support
(Table 5).
Predictors of physical function and mental health over time
Illness perception and self-efficacy were both associated with physical function and
mental health over the 24 months of follow-up (Table 6 and 7). Higher illness perception
12 and mental health (β=-2.3, 95% CI -3.2 – -1.4, p<0.0001). Higher self-efficacy scores were
associated with better physical function (β=1.8, 95% CI 1.2 – 2.4, p<0.0001) and mental
health (SE: β=1.5, 95% CI 0.9 – 2.1, p<0.0001).
Longer hospital length of stay was predictive of lower physical function over the 24
months of follow-up (β=-1.7, 95% CI -2.5 – -0.9, p<0.0001). Increased perceived social
support (β=2.0, 95% CI 1.1 – 2.8, p<0.0001) and increased income (p<0.0001) were
associated with improved mental health over time while having insurance such as traffic or
work insurance that covered the injury (e.g. work cover) was associated with poorer mental
health over time (β=-2.6, 95% CI -4.9 – -0.2, p<0.03) .
DISCUSSION
Participants in this study had treatment in ICU as a result of traumatic injury and were
followed for 24 months, with 68% retention at 12 months and 56% at 24 months. They have
reported reduced physical function and mental health throughout the first 24 months after
hospital discharge which is consistent with other similar cohorts in USA and Europe (6-8, 16,
18, 46, 47). More than half of the participants reported medium to high risk of psychological
distress at all follow-up times and approximately one-fifth of participants reported symptoms
of post-traumatic stress. This may be an under-representation of the extent of the problem
given that participants in our study who were lost to follow-up reported high incidence and
levels of psychological distress at baseline. Illness perception and self-efficacy were
significantly associated with both physical function and mental health.
As expected, participants reported poorest health status one month after hospital
discharge. Physical function dropped significantly at this time and improved markedly by six
months with continued improvement over time. In contrast mental health was not as low one
month post discharge and only improved slightly over time. This significant drop and rapid
13 health is consistent with that reported in some trauma ICU cohorts in other countries (18, 48)
although there are occasional reports in conflict with this. In a Greek cohort of 85 patients
using the EQ-5D severe problems of anxiety were reported in a greater proportion of patients,
with more than 60% of patients reporting severe anxiety 6 months after injury, with similar
problems in mobility and self-care (46). Follow-up interviews in this Greek study were all
conducted in person and this may have influenced the higher levels of compromise in
comparison to the current study where self-report was used, although previous examination
of the effect of data collection method has found clinical interview resulted in less
compromised, rather than more compromised, quality of life results when compared to
self-report (49).
The pattern of recovery seen in our cohort was similar to that reported in Australian
trauma cohorts not specific to ICU with outcomes measured up to 12 months post-injury (32,
35, 50). The function reported by the current cohort also represents a more severe reduction
than that reported by several Australian ICU medical and surgical cohorts (51-53), however
this pattern is consistent with other studies where trauma patients have reported more
disability than other critical illness survivors (54, 55). Importantly, participants in our cohort
reported physical aspects of function (physical function and role function – physical) 8 – 9
points below Australian population norms and some emotional aspects of function (social
function and role function – emotional) 7 – 10 points below Australian population norms at
24 months. Given 5 points is considered a clinically important difference (56), and almost all
domain scores of the SF-36 exceeded this benchmark at 24 months, this represents a
persistent and important reduction in function. In this study we did not record rehabilitation
activities undertaken by study participants, although in anecdotal conversations with
participants at each of the follow-up points very few were undertaking structured
14 physical recovering. Consideration of the potential of both inpatient and outpatient
rehabilitation programs is important in developing future strategies {Parker, 2013 #32716}.
Slightly more than 20% of participants were classified as symptomatic using the PCL
which is consistent with that identified in a systematic review of 26 predominantly general
ICU studies conducted over the past 15 years {Wade, 2013 #32501}. Importantly, although
the incidence of reduced psychological function was reasonably consistent over time, this
consisted of different individuals, with few individuals reporting consistent function.
Fluctuations in psychological health have also been reported in a cohort of more than 1000
injured individuals (57). Similarly, O’Donnell et al (58) reported that of 73 (9%) of 834
injury patients who had PTSD at 12 months 22 patients had no or minimal symptoms at 3
months and a further 17 had partial or subsyndromal PTSD at that time. The additional
finding in our own data that some patients who had high risk of psychological distress or
were symptomatic of PTSD at early follow-up points, but reported improved psychological
health at later follow-up points, emphasises the different recovery pathways that injured
individuals experience.
Variable pathways of recovery appear to not be limited to psychological health, but
have also been reported in regard to cognitive function after critical illness (59). These
various recovery patterns probably occur as a result of the complex interaction of personal
and environmental factors that are recognised as influencing function, disability and health
(60). These findings in different cohorts suggest we need to ensure there are multiple
screening strategies and interventions available at various points in the recovery pathway.
They also suggest we would benefit from identifying those who have no dysfunction, or
recover spontaneously despite early dysfunction, as the characteristics of these patients may
15 A further consideration is whether any reduction in health status or function is due to
ICU admission and associated treatment, or the injury and/or the hospitalisation. In our
cohort the mechanism of injury was the only injury characteristic that was associated with
outcome, and only with mental health but not physical function. We only studied patients
who had been admitted to ICU, however in a cohort of more than 800 trauma patients
admitted to five hospitals in Australia the sub-group of patients admitted to ICU were
significantly more likely to develop PTSD than those patients not admitted to ICU suggesting
that ICU admission itself may contribute to dysfunction(62). In contrast, in a cohort of more
than 11000 general patients in Canada and the USA the amount of reduction in HRQoL
associated with hospitalisation was no different for those patients admitted to ICU than those
patients admitted to hospital but not to ICU (31).
Although many studies have examined the factors associated with health status
following both injury and ICU admission, the majority of factors that have been examined
have been non-modifiable after the injury occurs, e.g. female, co-morbid disease (12),
perceived threat to life, persistent physical problems, previous emotional problems, previous
anxiety disorder and involvement in litigation/compensation (63). Non-modifiable factors
that have been identified in this study as being associated with health status included income,
hospital length of stay and injury insurance. Of interest, insurance for the injury was
associated with reduced mental health; although this might seem counter-intuitive it has been
reported by others (64). The relationship with reduced mental health might reflect the
integration between the biological, psychological and social aspects of health. A number of
participants described the challenges of their care being covered by insurance, particularly
after they left hospital; for example appointments with allied health personnel could not be
made until they were approved by the insurance provider and some participants felt they were
16 Whether the presence of health insurance leads to increased use of post-discharge services
such as allied health visits has not been explored in the injury setting, but has been found in
people with chronic illness{Skinner, 2014 #32717} and should be explored to inform national
debate and interventions related to health insurance.
The purpose of identifying factors associated with recovery is to inform the
development of relevant interventions and identify patients most likely to benefit. Given the
relationship between multiple factors affecting recovery, and the changing nature of health
status reported by patients, it is likely that relevant interventions will be complex in nature.
These interventions are more likely to be effective if developed and tested in a systematic
manner that is consistent with the MRC process of development based on evidence, theory
and modelling followed by feasibility and then effectiveness testing (27). Importantly, a
number of factors found to be associated with recovery that are potentially amenable to
change through intervention have been identified in this study. Self-efficacy has been
identified as a factor related to health status in other groups of injured patients (22) although
there is not yet evidence of the ability to improve this characteristic in this group of people.
Some success has been achieved in improving self-efficacy in people with rheumatic disease
(65) and caregivers of cancer patients (66), although the impact on wider health status is
inconsistent. There is also some evidence that other types of early psychological interventions
might be beneficial for injured patients. O’Donnell and colleagues (67) tested the
effectiveness of a stepped early psychological intervention in a group of 46 patients at high
risk for psychological dysfunction following traumatic injury. Initial testing suggests patients
who received the intervention of 4–10 sessions of CBT experienced treatment benefit.
Although the effect sizes (unstandardized regression coefficients) for illness
perception and self-efficacy in the current study were relatively small, studies in other
17 (65-67) which might translate to an increase of 5 points in SF-36 domains, in other words an
improvement that is considered an important difference. The lengthy time that patients spend
in acute wards after ICU discharge may provide an opportunity to commence interventions
designed to continue post-hospital discharge and could incorporate a combination of
individual instruction and generic information presented within a manual or on an
audio-visual disk supplemented by follow-up phone calls or visits. Interventions specifically aimed
at improving both self-efficacy and illness perception appear to have potential and might
target education about symptom management (e.g. pain) and physical and emotional
strategies to enhance rehabilitation and recovery.
An obvious strength of the current study is the longitudinal nature and repeated
measurement of recovery in the study participants. However the limitations of being a
single-centre study and retention of only 56% at 24 months should be noted. This is particularly
important given the differences in baseline characteristics of those retained in the study
compared to those who were lost to follow-up (although we attempted to compensate for this
loss in our analysis). Although disappointing, this retention rate compares favourably with
other similar cohorts, with retention rates ranging from 76% in 1906 patients in the USA (11)
and 68% in 332 patients in the Netherlands at 12 months (12) to 41% in 241 patients in the
USA at 12 months (68) and 39% in 146 patients in Sweden at 24 months (48). When
designing studies to test the effectiveness of interventions designed to improve recovery it is
essential to incorporate strategies, and associated funding, for detailed and multi-dimensional
follow-up of patients to improve the likelihood of high retention rates. A further limitation is
that participants were able to return questionnaires via the post or to provide responses by
telephone – we did not record the method of response or examine the influence of this
difference. Finally, it should be noted that no a priori sample size calculation was undertaken
18 this study; however given we have identified significant p-values in the presence of ‘minimal’
effect sizes for some predictors (i.e. mean change of 1.8 for outcome physical function for a one unit
of change in self-efficacy) this suggests sufficient power existed to detect relatively small changes.
CONCLUSIONS
Patients reported a range of areas of reduced physical and psychological function
throughout 24 months following injury requiring admission to ICU. Although improvements
in physical function and mental health are evident over this time period, many patients remain
below Australian population norms. Factors associated with physical function and mental
health outcomes over time that are potentially amenable to change include illness perception,
self-efficacy and perceived social support. Development of interventions that target these
19
ACKNOWLEDGEMENTS
The authors wish to thank Jennie Abbey for conducting participant recruitment and
data collection, Regina Boyce, Anne-Marie Kelly and Kelly Bures for screening & recruiting
patients, Elizabeth Burmeister for data collection and both the Princess Alexandra Hospital
20
REFERENCES
1. Peden M, McGee K, Krug E, editors. Injury: A Leading Cause Of The Global Burden Of Disease, 2000. Geneva: World Health Organisation; 2002.
2. Australian Institute of Health and Welfare. Australia's health 2012. Australia's health series no. 13. Cat. No. Aus 156. Canberra: AIHW; 2012.
3. Hyder AA, Aggarwal A. The increasing burden of injuries in Eastern Europe and Eurasia: making the case for safety investments. Health Policy 2009;89(1):1-13.
4. Aitken LM, Davey TM, Ambrose J, et al. Health outcomes of adults 3 months after injury. Injury 2007;38(1):19-26.
5. Richmond TS, Kauder D, Strumpf N, et al. Characteristics and outcomes of serious traumatic injury in older adults. J Am Geriatr Soc 2002;50(2):215-222.
6. Sluys K, Haggmark T, Iselius L. Outcome and quality of life 5 years after major trauma. J Trauma 2005;59(1):223-232.
7. Holbrook TL, Anderson JP, Sieber WJ, et al. Outcome after major trauma: 12-month and 18-month follow-up results from the Trauma Recovery Project. Journal of Trauma-Injury Infection & Critical Care 1999;46(5):765-771; discussion 771-763.
8. Holtslag HR, van Beeck EF, Lindeman E, et al. Determinants of Long-Term Functional Consequences After Major Trauma. J Trauma 2007;62(Number 4):919-927. 9. Ringburg AN, Polinder S, van Ierland MC, et al. Prevalence and prognostic factors of disability after major trauma. J Trauma 2011;70(4):916-922.
10. Aitken LM, Chaboyer W, Schuetz M, et al. Health status of critically ill trauma patients. J Clin Nurs 2014;23(5-6):704-715.
11. Davydow DS, Zatzick DF, Rivara FP, et al. Predictors of posttraumatic stress disorder and return to usual major activity in traumatically injured intensive care unit survivors. Gen Hosp Psychiatry 2009;31(5):428-435.
12. Haagsma JA, Ringburg AN, van Lieshout EM, et al. Prevalence rate, predictors and long-term course of probable posttraumatic stress disorder after major trauma: a prospective cohort study. BMC Psychiatry 2012;12:236.
13. Gabbe BJ, Sutherland AM, Williamson OD, et al. Use of health care services 6 months following major trauma. Aust Health Rev 2007;31(4):628-632.
14. Cameron CM, Purdie DM, Kliewer EV, et al. Ten-year health service use outcomes in a population-based cohort of 21,000 injured adults: the Manitoba injury outcome study. Bull World Health Organ 2006;84(10):802-810.
15. World Health Organisation. The International Classification of Functioning. Geneva: World Health Organisation; 2001.
16. Ringdal M, Plos K, Lundberg D, et al. Outcome after injury: memories, health-related quality of life, anxiety, and symptoms of depression after intensive care. J Trauma
2009;66(4):1226-1233.
17. Toien K, Myhren H, Bredal IS, et al. Psychological distress after severe trauma: a prospective 1-year follow-up study of a trauma intensive care unit population. J Trauma 2010;69(6):1552-1559.
18. Mata GV, Fernandez RR, Aragon AP, et al. Analysis of quality of life in
polytramatized patients two years after discharge from an intensive care unit. Journal of Trauma, Injury, Infection and Critical Care 1996;41(2):326-332.
21 20. Rainer TH, Yeung JH, Cheung SK, et al. Assessment of quality of life and functional outcome in patients sustaining moderate and major trauma: A multicentre, prospective cohort study. Injury 2014;45(5):902-909.
21. Lee B-O, Chaboyer W, Wallis M. Predictors of health-related quality of life three months after traumatic injury. J Nurs Scholarsh 2008;40(1):83-90.
22. Connolly FR, Aitken LM, Tower M. An integrative review of self-efficacy and patient recovery post acute injury. J Adv Nurs 2014;70(4):714-728.
23. Kyhlback M, Thierfelder T, Soderlund A. Prognostic factors in whiplash-associated disorders. Int J Rehabil Res 2002;25(3):181-187.
24. Soderlund A, Asenlof P. The mediating role of self-efficacy expectations and fear of movement and (re)injury beliefs in two samples of acute pain. Disabil Rehabil
2010;32(25):2118-2126.
25. Richmond TS, Guo W, Ackerson T, et al. The effect of postinjury depression on quality of life following minor injury. J Nurs Scholarsh 2014;46(2):116-124.
26. Ringdal M, Plos K, Ortenwall P, et al. Memories and health-related quality of life after intensive care: a follow-up study. Crit Care Med 2010;38(1):38-44.
27. Craig P, Dieppe P, Macintyre S, et al. Developing and evaluating complex interventions: the new Medical Research Council guidance. BMJ 2008;337:a1655. 28. Ware JE, Jr. SF-36 health survey update. Spine 2000;25(24):3130-3139.
29. Tucker G, Adams R, Wilson D. Observed agreement problems between sub-scales and summary components of the SF-36 version 2 - an alternative scoring method can correct the problem. PloS one 2013;8(4):e61191.
30. Rubenfeld GD. Does the hospital make you older faster? Am J Respir Crit Care Med 2012;185(8):796-798.
31. Feemster LC, Cooke CR, Rubenfeld GD, et al. The influence of hospitalization or intensive care unit admission on declines in health-related quality of life. Annals of the American Thoracic Society 2015;12(1):35-45.
32. Fitzharris M, Bowman D, Ludlow K. Factors associated with return-to-work and health outcomes among survivors of road crashes in Victoria. Aust N Z J Public Health 2010;34(2):153-159.
33. Gabbe BJ, Lyons RA, Sutherland AM, et al. Level of agreement between patient and proxy responses to the EQ-5D health questionnaire 12 months after injury. J Trauma Acute Care Surg 2012;72(4):1102-1105.
34. Watson WL, Ozanne-Smith J, Richardson J. Retrospective baseline measurement of self-reported health status and health-related quality of life versus population norms in the evaluation of post-injury losses. Inj Prev 2007;13(1):45-50.
35. Wasiak J, Paul E, Lee SJ, et al. Patterns of recovery over 12 months following a burn injury in Australia. Injury 2014;45(9):1459-1464.
36. Lorig K. Outcome measures for health education and other health care interventions Thousand Oaks:: Sage Publications Inc.; 1996.
37. Broadbent E, Petrie KJ, Main J, et al. The brief illness perception questionnaire. J Psychosom Res 2006;60(6):631-637.
38. Zimet GD, Dahlen NW, Zimet SG, et al. The Mulitdimensional Scale of Perceived Social Support. J Pers Assess 1988;52(1):30 - 41
39. Weathers FW, Litz BT, Herman DS, et al. The PTSD Checklist (PCL): reliability, validity and diagnostic utility. In: Annual Meeting of International Society for Traumatic Stress Studies; 1993; San Antonio, TX; 1993.
22 41. Hawthorne G, Osborne RH, Taylor A, et al. The SF36 Version 2: critical analyses of population weights, scoring algorithms and population norms. Qual Life Res 2007;16(4):661-673.
42. Breiman L, Friedman J, Olshen R, et al. Classification and Regression Trees Monterey, CA: Wadsworth & Brooks/Cole Advanced Books & Software; 1984.
43. Burnham KP, Anderson DR. Model Selection and Multi-model Inference: A Practical Information-Theoretic Approach. 2nd Edition ed. New York, NY: Springer-Verlag New York Inc.; 2002.
44. Kadane JB, Lazar NA. Methods and criteria for model selection. Journal of the American Statistical Association 2004;99(465):279-290.
45. Hogan JW, Roy J, Korkontzelou C. Handling drop-out in longitudinal studies. Stat Med 2004;23(9):1455-1497.
46. Stergiannis P, Katsoulas T, Fildissis G, et al. Health-related quality of life and rehabilitation cost following intensive care unit stay in multiple trauma patients. J Trauma Nurs 2014;21(3):115-121.
47. Ulvik A, Kvale R, Wentzel-Larsen T, et al. Quality of life 2-7 years after major trauma. Acta Anaesthesiol Scand 2008;52(2):195-201.
48. Orwelius L, Bergkvist M, Nordlund A, et al. Physical effects of trauma and the psychological consequences of preexisting diseases account for a significant portion of the health-related quality of life patterns of former trauma patients. J Trauma Acute Care Surg 2012;72(2):504-512.
49. Lyons RA, Wareham K, Lucas M, et al. SF-36 scores vary by method of administration: implications for study design. J Public Health Med 1999;21(1):41-45. 50. Wasiak J, Mahar P, Lee S, et al. 12-month generic health status and psychological distress outcomes following an Australian natural disaster experience: 2009 Black Saturday Wildfires. Injury 2013;44(11):1443-1447.
51. Denehy L, Skinner EH, Edbrooke L, et al. Exercise rehabilitation for patients with critical illness: a randomized controlled trial with 12 months of follow-up. Crit Care 2013;17(4):R156.
52. Elliott D, McKinley S, Alison J, et al. Health-related quality of life and physical recovery after a critical illness: a multi-centre randomised controlled trial of a home-based physical rehabilitation program. Crit Care 2011;15(3):R142.
53. Skinner EH, Warrillow S, Denehy L. Health-related quality of life in Australian survivors of critical illness. Crit Care Med 2011;39(8):1896-1905.
54. Niskanen M, Ruokonen E, Takala J, et al. Quality of life after prolonged intensive care. Crit Care Med 1999;27(6):1132-1139.
55. Badia X, Diaz-Prieto A, Gorriz MT, et al. Using the EuroQol-5D to measure changes in quality of life 12 months after discharge from an intensive care unit. Intensive Care Med 2001;27(12):1901-1907.
56. Dowdy DW, Eid MP, Sedrakyan A, et al. Quality of life in adult survivors of critical illness: a systematic review of the literature. Intensive Care Med 2005;31:611-620.
57. Bryant RA, O'Donnell ML, Creamer M, et al. A multisite analysis of the fluctuating course of posttraumatic stress disorder. JAMA Psychiatry 2013;70(8):839-846.
58. O'Donnell ML, Varker T, Creamer M, et al. Exploration of delayed-onset posttraumatic stress disorder after severe injury. Psychosom Med 2013;75(1):68-75. 59. Woon FL, Dunn CB, Hopkins RO. Predicting cognitive sequelae in survivors of critical illness with cognitive screening tests. Am J Respir Crit Care Med 2012;186(4):333-340.
23 61. Iwashyna TJ. Trajectories of recovery and dysfunction after acute illness, with
implications for clinical trial design. Am J Respir Crit Care Med 2012;186(4):302-304. 62. O'Donnell ML, Creamer M, Holmes AC, et al. Posttraumatic Stress Disorder After Injury: Does Admission to Intensive Care Unit Increase Risk? J Trauma 2010;28:28.
63. Heron-Delaney M, Kenardy J, Charlton E, et al. A systematic review of predictors of posttraumatic stress disorder (PTSD) for adult road traffic crash survivors. Injury
2013;44(11):1413-1422.
64. Harris IA, Young JM, Rae H, et al. Predictors of general health after major trauma. J Trauma 2008;64(4):969-974.
65. Garnefski N, Kraaij V, Benoist M, et al. Effect of a cognitive behavioral self-help intervention on depression, anxiety, and coping self-efficacy in people with rheumatic disease. Arthritis Care Res (Hoboken) 2013;65(7):1077-1084.
66. Hendrix CC, Landerman R, Abernethy AP. Effects of an individualized caregiver training intervention on self-efficacy of cancer caregivers. West J Nurs Res 2013;35(5):590-610.
67. O'Donnell ML, Lau W, Tipping S, et al. Stepped early psychological intervention for posttraumatic stress disorder, other anxiety disorders, and depression following serious injury. J Trauma Stress 2012;25(2):125-133.
68. Livingston DH, Tripp T, Biggs C, et al. A fate worse than death? Long-term outcome of trauma patients admitted to the surgical intensive care unit. J Trauma 2009;67(2):341-348; discussion 348-349.
69. Weathers FW, Litz BT, Keane TM, et al. The PTSD Checklist for DSM-5 (PCL-5): National Center for PTSD at www.ptsd.va.gov; 2013.
24
Table 1. Measures of variables
Construct Measure Items Score range & categories Self-efficacy Self-Efficacy Scale
(SES)(36)
6 items measuring
participants’ confidence in undertaking daily activities and achieving results; these items related to: fatigue; physical discomfort; emotional distress; other symptoms or health problems; different tasks and activities; non-medicine related activities to reduce illness effects
1-10 Likert scale per response
Total SES generated via average response from items
Higher score indicates patients’ confidence in undertaking daily activities.
Illness perception Brief Illness Perception Questionnaire (BIPQ)(37)
8 items to assess the cognitive and emotional representations of injury, in other words how
participants respond to the threat to their health; items related to: consequences; timeline; personal control; treatment control; identity; concern; understanding; emotional response
0-10 scale per response Total score range: 0 to 80 Higher score reflects a perception that the injury exerted more influence on the participants’ life.
Perceived social support
Multidimensional Scale of Perceived Social Support (MSPSS)(38)
12 items describing perceived adequacy of support from family, friends and significant other
1-7 Likert scale per response
Total score range: 8 to 84 Higher score indicates greater participants’ perceived social support.
Post-traumatic stress
PTSD Checklist – Civilian version (PCL) (69)
17 items describing: intrusive recollect; flashbacks; upset by reminders; distressing dreams; physical reactions to reminders; avoid thoughts; avoid reminders; psychogenic amnesia; anhedonia; estrangement from others; psychic numbing; foreshortened future; sleep difficulty; irritability; concentration impaired; hypervigilant; exaggerated startle
1-5 Likert scale per response
Total score range: 17 to 85 Higher score indicating more post-traumatic stress. Considered symptomatic if rated ‘moderately’ or above on at least 1 B item
(questions 1-5), 3 C items (questions 6-12) and 2 D items (questions 13-17). 10 unit change considered clinically meaningful Psychological distress Kessler Psychological Distress Scale (K10)(40)
10 items describing: depressed mood; motor agitation; fatigue; worthless guilt; anxiety
25
– 29 – medium risk; 30 – 50 – high risk.
Health status Short Form-36 (SF-36)(70)
8 sections describing: vitality; physical
functioning; bodily pain; general health perceptions; physical role functioning; emotional role functioning; social role functioning; mental health
Weighted sums of the questions in each section which are transformed into: Total score scale: 0 – 100 Lower score indicates more disability.
Pre-injury health
Physical function sub-scale of the Medical Outcome Study SF-36
10 items describing physical functioning.
1-3 Likert scale per response
26
Table 2. Baseline characteristics and comparison of responders and non-responders at 24 months
a. Responder and non-responder comparisons for demographics, injury & acute care characteristics are based on in-hospital (baseline) data; b. Comparisons of psychological and physical health status are based on psychological scores provided at 1 month (first data collection point for psychological scores); c.Injury Severity Score from QTR data n=121 (data not available for 2 participants due to poisoning being coded as injury but not assigned an ISS); d. Length of Stay (LOS); e. Physical and Mental Component Score from SF-36v2; ^ Comparisons of responders and non-responder characteristics tested with Chi-square or Fisher’s exact test, t-test for differences in
Baseline (in-hospital) 24 months
Responders n=123 Responders n=69 Non-Responders n=54
p-value a, ^
Frequency (%)
Male 102 (83) 58 (84) 44 (82)
Female 21 (17) 11 (16) 10 (19) 0.71
Median (IQR)
Age (years) 37 (28−55) 44 (29–60) 34 (27–47) 0.03*
ISSc 19 (13–29) 17 (12–29) 19 (14–29) 0.68
APACHE III 41 (28–53) 41 (29–52) 41 (28–53) 0.88
ICU LOSd 2.9 (1.2–7.7) 3.0 (1.4–7.3) 2.7 (1.2–7.7) 0.98
Hospital LOS 20.2 (9.7–39.2) 20.2 (10–38.6) 20.0 (8.6–40.4) 0.73
1 months (first survey)# 24 months#
Responders n= 93 Responders n=61 Non-Responders n=32
p-value b, ^
Median (IQR)
K10 Score 20 (14–26) 16 (13–25) 24 (19–30) 0.002*
PCL Score 29 (22–40) 27 (21–36) 35 (25–48) 0.02*
Frequency (%) PCL symptomatic Yes No 18 (81) 75 (19) 9 (15) 52 (85) 9 (28)
23 (72) 0.12
K10 (CRUfAD)
Low or no risk Medium risk High risk 33 (36) 47 (51) 13 (14) 29 (48) 27 (44) 5 (8) 4 (13) 20 (63)
8 (25) 0.002*
27
28
Table 3. Demographic characteristics: Baseline, 1, 6, 12 and 24 months
Baseline n=123 1 month n=93 6 months n=88 12 months n= 84 24 months n= 69
Marital Status Frequency (%) Married/De facto Never married Separated/Divorced Widowed 57 (47) 40 (33) 21 (17) 4 (3) (1 missing) 47 (51) 30 (32) 14 (15) 2 (2) 43 (49) 28 (32) 15 (17) 2 (2) 40 (48) 26 (31) 17 (20) 1 (1) 37 (54) 18 (26) 13 (19) 1 (2) Employment Full time work Part time/casual Retired Student/other Disability benefit Unemployed 64 (52) 25 (20) 12 (10) 6 (5) 7 (6) 9 (7) 39 (42) 7 (8) 10 (11) 11 (12) 13 (14) 12 (13) (1 missing) 30 (34) 14 (16) 12 (14) 10 (11) 7 (8) 15 (17) 32 (39) 14 (17) 9 (11) 5 (6) 13 (16) 9 (11) (2 missing) 27 (41) 8 (12) 8 (12) 6 (9) 7 (11) 10 (15) (3 missing) Median (IQR)
Hours of work/week 40 (37–50) 40 (37–50) 38 (33–45) 40 (31–47) 38 (30–45) Household Income ($AUD)
$0 – 29 999 $30 000 – 59 999 $60 000 – 89 999 $90 000 or more
43 (35) 42 (34) 25 (21) 12 (10) (1 missing) 39 (43) 24 (26) 16 (18) 12 (13) (2 missing) 40 (46) 26 (30) 10 (12) 11 (13) (1 missing) 34 (42) 26 (32) 11 (14) 10 (12) (3 missing) 24 (36) 18 (27) 12 (18) 13 (19) (2 missing) Private Health Insurance
Yes No 32 (26) 91 (74) 24 (26) 69 (74) 24 (27) 64 (73) 25 (30) 59 (70) 26 (38) 43 (62) Type of Health Insurance a
Hospital only Extra only Both 5 (16) 1 (3) 26 (81) 2 (8) 3 (13) 19 (79) 2 (9) 1 (4) 20 (87) (1 missing) 2 (9) 2 (9) 18 (82) (3 missing)
4 (16) 1 (4) 20 (80) (1 missing) Injury Insurance Yes No 38 (31) 85 (69) 28 (30) 65 (70) 28 (32) 60 (68) 31 (37) 53 (63) 25 (36) 44 (64)
29
Table 4. Mean norm-based SF-36 scores at 1, 6, 12 & 24 monthsa, b
1 month 6 months 12 months 24 months
SF-36 Domains Mean (SD)
Physical function 30.2 (13.8) 39.1 (14.7) 40.5 (14.1) 42.0 (14.3) Role function-physical 25.8 (10.4) 36.2 (15.3) 39.2 (15.0) 40.9 (14.6) Bodily Pain 35.5 (11.4) 42.4 (11.9) 44.7 (12.5) 44.8 (12.3) General health 45.6 (9.7) 45.3 (11.1) 45.3 (11.1) 46.3 (10.2) Vitality 40.9 (10.1) 45.8 (11.0) 45.4 (11.2) 46.9 (11.8) Social function 32.2 (13.8) 40.2 (13.3) 41.1 (14.1) 42.6 (12.7) Role function-emotional 30.9 (22.2) 37.4 (18.1) 38.5 (19.4) 40.4 (17.8) Mental health 43.1 (12.1) 43.3 (13.0) 43.2 (12.3) 44.4 (12.2)
Physical component summary 32.7 (10.4) 40.9 (13.2) 42.8 (11.7) 43.7 (12.3)
Mental component summary 40.6 (15.7) 42.6 (14.0) 42.4 (13.8) 44.6 (12.5)
a Norm-based scores for domains and summary score are calculated from raw scores using Australian population norms (SAHOS); scores are interpreted with a population
mean of 50 and
30
Table 5. Psychosocial recovery over 24 months#
1 month
n=93
6 months
n=88
1 vs. 6 mths,
p-value^
12 months
n=84
1 vs. 12 mths,
p-value^
24 months
n=69
1 vs. 24 mths,
p-value^
Post Traumatic Stress Symptoms Median (IQR)
PCL score a
Symptomatic - PCL: n (%)a
29.0 (22.0–40.0) 18 (19%)
31.0 (24.0–46.0) 20 (23%)
0.02* 31.0 (23.0–44.0)
18 (22%)
0.12 30.0 (23.0–41.0) 15 (22%)
0.08
Psychological Distress Mean (SD)
K10 total score b
K10 (CRUfAD) b
Low or no risk Medium risk High risk 20.6 (7.9) 33 (35.5) 47 (50.5) 13 (14.0) 19.8 (8.3) 35 (39.8) 42 (47.7) 11 (12.5)
0.25 19.4 (8.5)
Frequency (%)
34 (41.0) 37 (44.5) 12 (14.5)
0.08 19.3 (8.1)
29 (42.6) 31 (45.6) 8 (11.8)
0.36
Perceived Self-Efficacy
Self-Efficacy Scale c 6.6 (2.3) 6.9 (2.4) 0.42
Mean (SD)
6.9 (2.5) 0.27 6.9 (2.7) 0.64
Illness Perception
BIPQ d 42.5 (13.7) 38.3 (18.0) 0.004* 38.2 (17.5) 0.001* 36.9 (20.1) 0.001*
Social Support
MPSS total score e
Family Friends Significant Other 5.6 (1.1) 5.8 (1.2) 5.3 (1.3) 5.8 (1.3) 5.3 (1.3) 5.4 (1.5) 5.1 (1.3) 5.5 (1.5) 0.02* 0.004* 0.22 0.06 5.4 (1.1) 5.4 (1.3) 5.1 (1.2) 5.6 (1.3) 0.02* 0.005* 0.07 0.20 5.4 (1.2) 5.5 (1.2) 5.2 (1.3) 5.6 (1.5) 0.13 0.07 0.33 0.27
a. PTSD Checklist – Civilian Version (PCL-C): Symptom severity score range (17–85) higher scores indicate more symptoms of post-traumatic stress,
Symptomatic on PCL: PTSD symptoms consistent with diagnosis of PTSD; b. Kessler Psychological Distress Scale: Score range (10–50) higher scores indicate greater distress,
31
Multidimensional Scale of Social Support (MSPSS): Score range (1–7) higher scores indicate greater perceived social support; #Due to limited data unable to calculate/impute scores for several
32
Table 6. Predictors of physical function (SF-36) over 24 months
Predictors/Factors Mean [95% CI]^ p-value
(Intercept) 27.7 [20.0, 35.7] -
Month 6 months 7.4 [5.3, 9.4] <0.0001
12 months 9.2 [7.2, 11.3] <0.0001
24 months 10.4 [8.1, 12.6] <0.0001
Hospital length of stay (per 10 days) -1.7 [-2.5, -0.9] <0.0001
Illness perception score (per 10 units) -1.4 [-2.4, -0.4] 0.006
Self-efficacy score (per 1 unit) 1.8 [1.2, 2.4] <0.0001
Education Primary/Secondary (8,9,10) Ref -
Secondary (11,12) 3.3 [-1.4, 7.9] 0.19
Trade/Vocation 1.4 [-2.4, 5.1] 0.50
University -0.4 [-5.8, 4.9] 0.88
Marital Status Married Ref -
Never married 1.9 [-1.1.1, 5.0] 0.24
Separated/Divorced/Widowed 0.5 [-3.0, 3.9] 0.79
Injury insurance (e.g. work cover) No Ref -
Yes -2.6 [-5.4, 0.0] 0.058
AIC for best model= 2323
^ Unstandardised regression coefficients: represent the mean change/difference over 24 months in physical
33
Table 7. Predictors of mental health (SF-36) over 24 months
Predictors Mean [95% CI]^ p-value
(Intercept) 30.5 [21.9, 38.9] -
Illness perception score (per 10 units) -2.3 [-3.2, -1.4] <0.0001
Social support (MSPSS) (per 1 unit) 2.0 [1.1, 2.8] <0.0001
Self-efficacy score (per 1 unit) 1.5 [0.9, 2.1] <0.0001
Employment Full-time Ref -
Part-time/casual -2.1 [-5.3, 1.0] 0.21
Retired -1.1 [-5.1, 2.8] 0.59
Student/other 0.4 [-2.9, 3.8] 0.80
Disability benefits 1.0 [-2.3, 4.3] 0.58
Unemployed -2.5 [-5.9, 0.7] 0.14
Income $0-$29,000 Ref -
$30,000-$59,999 4.6 [2.1, 7.2] <0.0001
$60,000-$89,999 6.0 [2.9, 9.3] <0.0001
$90,000 or more 6.0 [2.6, 9.4] 0.0001
Injury insurance (e.g. work cover) No Ref
Yes -2.6 [-4.9, -0.2] 0.03
Mechanism of injury Road traffic crash Ref -
Fall 0.9 [-0.24, 4.2] 0.61
Collision -5.2 [-11.2, 0.7] 0.10
Other -2.7 [-5.9, 0.5] 0.12
35 Figure 2. Physical health (PH) and mental health (MH) over 24 months
[image:36.595.71.525.386.653.2]