http://dx.doi.org/10.1080/21681376.2016.1209981
© 2016 The Author(s). Published by Informa UK Limited, trading as Taylor & Francis Group.
This is an Open Access article distributed under the terms of the Creative Commons Attribution License (http://creativecommons.org/licenses/ ORIGINAL ARTICLE
Metropolitan misery: why do Scots live in ‘bad
places to live’?
Stewart Dunlop
a, Sara Davies
band Kim Swales
aINTRODUCTION
Orkney has been named the best place to live in Scotland for the third year in a row according to the 2015 Bank of Scotland Quality of Life Survey … rural areas scored consistently high across a range of categories covering health and life expectancy, personal well-being and a low crime rate. Glasgow, Scotland’s biggest city and the most densely populated area of the country, was ranked lowest. (Scotsman, 18 December 2015)
There is an increased academic and policy focus on cities as centres of economic development. This follows the rise of the New Economic Geography (NEG), spearheaded by Krugman (1991) and is evidenced by the work of Edward Glaeser (Glaeser, 2011) and increased interest in the seminal publications of Jane Jacobs (Jacobs, 1961). Relevant to the growth of larger economic areas, studies in recent decades argue that the main rationale for regional policy should be to help generate agglomeration economies, particularly knowledge spillovers (Morgan, Aydalot & Keeble). This has recently become a central element in UK spatial policy, with the emphasis on the role of city mayors and the ‘Northern Powerhouse’, an initiative supported by the UK gov-ernment of investment in transport, skills, support for business and regeneration focused on the major cities of northern England.1
ABSTRACT
This paper uses data from the Scottish Household Survey to investigate urban–rural variations in life satis-faction in Scotland. It reviews the previous literature on spatial differences in life satissatis-faction and develops an econometric model that includes a range of factors previously shown to affect life satisfaction. Holding these factors constant, Scottish rural dwellers are found to have a significantly higher life satisfaction than city residents. Possible reasons for higher life satisfaction in rural areas are explored before finally drawing policy conclusions.
ARTICLE HISTORY
Received 23 March 2016; Accepted 4 July 2016 KEYWORDS
life satisfaction; urban–rural differences; Scotland; New Economic Geography
CONTACT
(Corresponding author) s.dunlop@strath.ac.uk
aFraser of Allander Institute, Department of Economics, University of Strathclyde, Glasgow, UK
bEuropean Policies Research Centre, University of Strathclyde, Glasgow, UK
This academic and policy interest in cities has been accompanied by a global move towards increased urbanization (United Nations, 2011). The situation in the UK, however, is less straight-forward. Over a 20-year period, 1991–2011, for example, the share of UK population located in London increased from 14% to 15%, but the share in the top 23 cities remained constant at 46%.2 The position in Scotland, the focus of the present study, is even more nuanced. Between 1991 and 2008 the top four Scottish cities lost population share followed by a slight subsequent improve-ment, so that at 2011 they had 26.6% of the Scottish population. Of the top four Scottish cities, only Edinburgh has experienced a continuing population increase over the period 1991–2011.
A central mechanism in the process of spatial adjustment proposed in the NEG, and also more traditional neo-classical economic models, is that workers migrate in search of higher wages and that this mechanism equalizes real wages between different areas. However, reliable local consumer price index (CPI) data are not available within the UK, and this creates real difficulties in testing for real wage equality over space. Moreover, variations in local valued amenities should be reflected in real wage differences. Therefore, rather than take the real wage as an appropriate indication of whether a location is a ‘good place to live’, this paper uses the average life satisfaction score to measure the quality of life in local areas.
This paper addresses three issues. First, it attempts to identify the determinants of life satis-faction in Scotland.3 There is now a well-established body of academic work on happiness, but this is the first time this type of analysis has been conducted for Scotland. Second, it focuses on life satisfaction in Scottish cities versus other areas. Finally, it tests the NEG account of spatial development by examining whether life satisfaction is equalized across different types of area. The results show that Scottish cities are locations with low life satisfaction scores.
We approach this through econometric analysis using information from the Scottish Household Survey (SHS). This data source includes key demographic, social and economic data and also specifies the respondent’s life satisfaction and their home location. We can therefore use the SHS to explain interpersonal variations in self-reported life satisfaction, focusing specifically on the question of cities versus other areas. This is also augmented by information on local services and other information at Scottish local authority area.
HAPPINESS RESEARCH
Work on happiness can be dated to the Easterlin (1974) seminal analysis that found that self- reported happiness in America did not increase over time, despite considerable increases in average US income. Since then, a key question in this literature has been: how does income affect welfare – essentially, does being richer make people feel happier? The argument is not that additional income necessarily has no effect on well-being, but rather that people’s lives are also enhanced by a wide range of other variables. Focusing policy on factors other than economic growth may therefore increase overall welfare.
The call to set policy according to a broader set of quality of life indicators was also made by the Sarkozy Commission which recommended that the type of well-being analysis undertaken in academic circles should also be used to guide welfare policy (Fitoussi, Sen, & Stiglitz, 2009). This suggestion has been adopted in the UK, where the Office for National Statistics (ONS) began to collect UK national well-being data in 2011.
conventionally approached utility in terms of revealed preference and argued that an individual’s utility should be identified by what they do rather than what they say.
That said, research on well-being reveals a high correspondence between an individual’s self- reported well-being and objective indicators. For example, individuals with higher happiness scores also tend to have higher levels of life expectancy and suffer from fewer mental health problems (Deiner et al., 1996). The extensive well-being literature also shows that a common set of influences affect happiness, both across time and nations, including income, health, unem-ployment, age and gender. In most cases, the results reflect the intuitively expected outcome. For example, studies consistently find that poor health and unemployment are major determinants of well-being (e.g., Dolan, Peasgood, & White, 2008, pp. 100, 101). For variables where there is no prior intuitive expectation as to sign, the results are consistent across studies. For example, it is typically found that women have higher levels of life satisfaction than men and that life satisfaction increases after middle age.
A second concern is that people’s perceptions are socially constructed, leading to differing self-interpretations of life satisfaction. For example, Skidelsky and Skidelsky (2012, p. 109) argue:
Ask an American how he is doing and the chances are he will say ‘great, thanks’. Ask a Russian the same question and he is likely to shrug and say ‘normalno’, suggesting that things could be worse.
Many well-being studies are pan-European, where difficulties might arise in controlling for differences in social norms. The present study uses data for areas within one country – Scotland – and the results are therefore much less likely to be affected by differences in the way in which individuals interpret this basic question.
A third question is: which term should be used to indicate well-being? The various terms that have been used include well-being itself, happiness and life satisfaction. However, these are not synonymous; asking someone whether they are ‘happy’ is likely to provide a result that reflects temporary emotional responses, while responses to ‘life satisfaction’ are more likely to measure people’s reflections on their longer-term life experience. Previous studies have shown that happi-ness and life satisfaction are not necessarily closely related. Bjornskov, Dreher, and Fischer (2008), for example, found that in the World Values Survey the correlation between self-reported life satisfaction and happiness was only 0.44. The SHS uses life satisfaction. Our assessment is that this term is preferable to ‘happiness’ in that it is more likely to provide a cognitive assessment of an individual’s entire life experience and so provide a more comprehensive measure of how people rate their well-being.
PREVIOUS ANALYSIS OF LIFE SATISFACTION
LIFE SATISFACTION ANALYSIS – GENERAL
A substantial body of work has been conducted since Easterlin’s (1974) analysis and there is now broad agreement on the principal determinants of well-being. Notably, higher income is almost invariably associated with greater well-being, a point confirmed by Blanchflower and Oswald (2011, p. 8), who concluded:
Some textbooks have wrongly told generations of psychology undergraduates that money is not a source of happiness. In so far as regression equations can settle the question, the answer is unambiguous: yes, money buys happiness.
for both income and education generally tend to find that the relationship comes through the influence of education on income – more highly qualified people tend to earn more. More recent research using mental well-being data also questions the effect of education by demonstrating that educational level has no impact on mental well-being (Stewart-Brown, Chandimali Samaraweera, Taggart, Ngianga-Bakwin, & Stranges, 2015). Our results find no impact of education on life satisfaction.
Age is also typically found to significantly impact well-being (Ferrer-i-Carbonell & Gowdy,
2007). Studies consistently find a negative relationship with age and a positive relationship with age squared. This implies a ‘U’-shaped relationship with life satisfaction reaching a minimum point in middle age and then increasing as people get older. This result is also reflected in our findings. Gender consistently has some influence (Alesina, Di Tella, & MacCulloch, 2004), as also does ethnicity. For example, the UK study undertaken by Oguz, Merad, Snape, and UK Office for National Statistics (2013) found that on average people of non-white ethnicities rated their life satisfaction lower than white people.
Other studies have noted the significance of social capital. Bjornskov et al. (2008) argue that having a wide range of social connections creates greater social cohesion between people and increases trust, thereby improving individuals’ life satisfaction. The ONS has also recently stated that ‘networks of individual relationships with family and friends, local community and civic engagement form the fabric of a cohesive society’ (Seigler, 2015, p. 2).
LIVING IN THE CITY – SPATIAL DIFFERENCES IN LIFE SATISFACTION
Table 1 reviews studies that have included an area variable as one of the determinants of happi-ness. The spatial context and the particular urban/rural definitions employed vary widely between studies and countries and this should be borne in mind when interpreting the results in Table 1. However, all these studies find that living in more densely populated areas, including cities, reduces life satisfaction.
For Sweden, Gerdtham and Johannesson (2001) explore the relationship between life satisfaction and several socio-economic variables, including an urbanization measure. They found that those living in the three largest Swedish cities reported a lower level of life satisfaction than respondents in other areas.
The Australian study reported in Dockery (2003) included a variable measuring whether respondents lived in a major city. Controlling for other factors, life satisfaction was significantly lower in these cities.4 Hayo (2004) investigated life satisfaction in seven Eastern European coun-tries, controlling for a range of characteristics including age, gender, marital status, education and unemployment. The paper showed that people living in relatively rural areas (fewer than 5000 inhabitants) had a statistically significantly higher level of life satisfaction than those living in all other areas.
Other authors confirm that life satisfaction is typically lower in cities than in rural areas. Hudson (2006) found that those living in villages were happier than others, while Graham and Felton’s (2006) study of Latin America revealed that people in small towns had higher life sat-isfaction compared with residents of large cities.5 Shucksmith, Cameron, Merridew, and Pichler (2009) used 2003 European Quality of Life Survey (EQLS) data for 28 European countries and found that rural residents in the 12 richest countries of the EU had higher well-being than city residents.
Table 1.
W
ell-being studies reporting spatial characteristics.
Study
Area
Question
LS point scale
Data
Number of area types
Result
Gerdtham and Johan
-nesson (
2001
)
Sweden
(Daily life is never a source of personal satisfaction, daily life is sometimes a source of personal satisfaction, daily life is a source of personal satis
-faction most of the time)
3
Level of Living Survey (LNU, 1991) (Institutet for Social F
orskning,
1992)
3
Lower life satisfaction in the larger cities
Dockery (
2003
)
Australia
Happiness with your life as a whole (unhappy
, fairly
unhappy
, fairly happy or very
happy)
4
Longitudinal Surveys of Australian Youth (LSA
Y) and the Household
Income and Labour Dynamics Australia survey (HILDA)
2
Lower life satisfaction in cities
Hayo (
2004
)
Eastern Europe
On the whole, are you very satisfied, not very satisfied, or not at all satisfied with the life you lead?
3
1000 respondents per country from opinion surveys in seven countries, organized by the Paul-Lazarsfeld-Society
3
Higher level of life satisfaction among those living in relatively rural areas
Hudson (
2006
)
European Union member states On the whole, are you very satisfied, fairly satisfied, not very satisfied or not at all sat
-isfied with the life you lead?
3
Eurobarometer survey (2001)
2
Those living in villages happier than others
Graham and F
elton
(
2006
)
Latin America
On the whole, are you very satisfied, fairly satisfied, not very satisfied or not at all sat
-isfied with the life you lead?
3
Annual survey conducted by the Latinobaro metro organization (2004)
2
Residents of small cities had a higher life satisfaction compared with residents of large cities
Shucksmith et al. (2009
)
Europe
Life satisfaction – scale of 1 (very dissatisfied) to 10 (very satisfied)
10
2003 European Quality of Life Survey
3
Rural residents in the 12 richest European Union member states had higher life satisfaction than city residents
Sørensen (
2014
)
Europe
All things considered, how satisfied are you with your life as a whole these days?
10
European V
alues Study
4
Significant difference between rural areas and cities, with life satisfac
-tion higher in rural areas
Oguz et al. (2013)
UK
Overall, how satisfied are you with your life nowadays?
10
Office for National Statistics, Measuring National W
ell-being
programme survey
2
UK’s ONS also finds higher life satisfaction scores in rural areas compared with cities (Oguz et al., 2013).
The studies summarized in Table 1 measure well-being with different dependent variables and across a variety of different area definitions. However, the consistent conclusion is that being less happy in larger areas, including cities, is common in many countries.
LIFE SATISFACTION IN SCOTLAND – SCOTTISH HOUSEHOLD SURVEY
(SHS) DATA
The main dataset used in this paper is the 2009 SHS, a random survey conducted biennially by the Scottish government and weighted to be representative of the Scottish population to local authority level. The information collected covers a wide range of measures on life in Scotland, including both life satisfaction scores and many indicators which previous research has shown affects life satisfaction. The respondent’s location is identified separately, and respondents are classified into cities, towns and rural areas on the basis of population size (see below).6
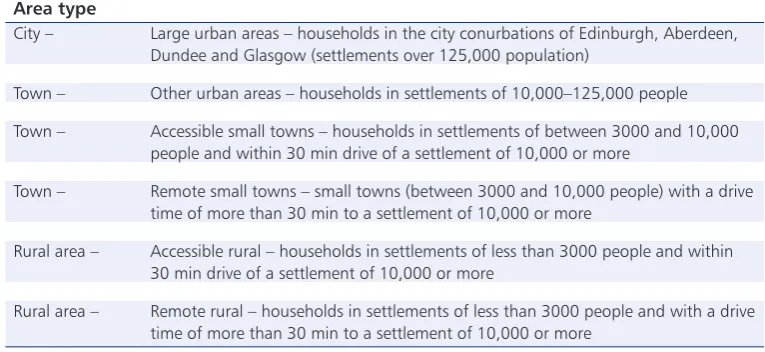
SHS data draw on the Scottish Government’s (2011) classification of areas in terms of their urban or rural characteristics, including: large urban areas, other urban areas, accessible small towns, remote small towns, accessible rural areas and remote rural areas. This classification is sim-ilar to the methodology developed by the OECD (2011) and also to that used by the European Commission (Dijkstra & Poelman, 2011). The OECD divides regions into five categories: Predominantly urban (PU), Intermediate close to a city (INC), Intermediate remote (INR), Predominantly rural close to a city (PRC) and Predominantly rural remote (PRR). Dijkstra and Ruiz (2010) have emphasized the need to differentiate between two classes of rural regions, namely areas with good access to urban areas (e.g., for commuting and business activity) and areas more distant from cities. We show below that this is important in identifying which type of rural area has higher life satisfaction.
DESCRIPTIVE STATISTICS
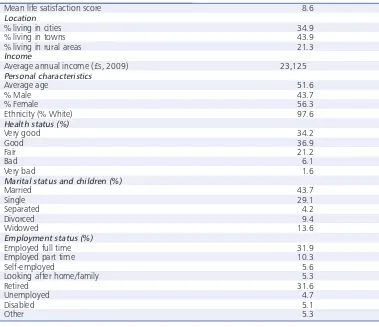
Table 2 shows the values of some of the key variables. The SHS provides a large sample size, 24,982 responses, approximately 0.5% of Scotland’s total population. As discussed above, the well-being measure used is the respondent’s life satisfaction score. Specifically, respondents were asked: ‘All things considered, how satisfied are you with your life as a whole nowadays?’ with responses scored from 1 to 10.
Urbanization measure
Results are classified by three area types: cities, towns and rural areas. Rural areas have a population of fewer than 3000, towns between 3000 and 125,000, and cities over 125,000 residents. Areas identi-fied as cities are the four largest Scottish urban areas: Glasgow, Edinburgh, Aberdeen and Dundee.7 Table 3 shows the average life satisfaction scores for the three types of area. The figures show that rural areas score highest, followed by towns and then cities. The difference between cities and towns is relatively small, with the town score only 1.5% above the city score. However, there is a more evident difference in life satisfaction when we compare cities with rural areas, where life satisfaction is almost 6% above the city score.
Scottish local authority data
other data available at this level to reflect details of the local areas. As a result, the model also includes measures of the local unemployment rate, a crime index, a measure of local income inequality and two measures of the quality of local public services (school education and health) collected for all 32 local authority areas in Scotland.
METHODS AND RESULTS
Table 4 gives the results from regressing life satisfaction against the urban/rural measures alone, with city dwelling as the reference. There are statistically significantly higher levels of life satis-faction for towns and rural areas, as compared with cities. Both the size of the coefficient and the level of significance is greater for rural areas.
[image:7.493.57.436.64.391.2]There are two puzzles with this finding. First, the NEG (and standard neo-classical economic) argument is that migration should eliminate variations in life satisfaction over space, but this is Table 2. Descriptive statistics (sample population).
Mean life satisfaction score 8.6
Location
% living in cities 34.9
% living in towns 43.9
% living in rural areas 21.3
Income
Average annual income (£s, 2009) 23,125
Personal characteristics
Average age 51.6
% Male 43.7
% Female 56.3
Ethnicity (% White) 97.6
Health status (%)
Very good 34.2
Good 36.9
Fair 21.2
Bad 6.1
Very bad 1.6
Marital status and children (%)
Married 43.7
Single 29.1
Separated 4.2
Divorced 9.4
Widowed 13.6
Employment status (%)
Employed full time 31.9
Employed part time 10.3
Self-employed 5.6
Looking after home/family 5.3
Retired 31.6
Unemployed 4.7
Disabled 5.1
Other 5.3
Table 3. Average life. Satisfaction by area
City 8.41
Town 8.53
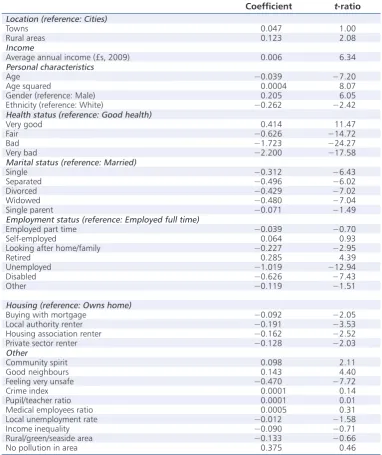
clearly not the case. Second, if there are differences one would perhaps expect, as the NEG argues, that life satisfaction would be greater in vibrant urban spaces. The reality is clearly more complex. We next ask to what extent differences in life satisfaction over space can be linked to the char-acteristics of the local area or to the personal charchar-acteristics of the populations that are attracted to specific areas. In order to determine this, Table 5 reports results from a regression model that includes a range of explanatory factors typically found to influence life satisfaction. The results are, in general, very consistent with previous findings.8
In selecting explanatory variables, we focused in particular on the well-being model developed by the ONS, reported in Oguz et al. (2013), so that this approach will, as far as possible, produce findings that reflect official thinking and well-being policy in the UK.
The model reported here explains 24.9% of variations in life satisfaction in the Scottish sample, in comparison with the ONS model which explains 19% of UK variations (Oguz et al., 2013, p. 49). Just less than 1% of the variation is explained in the Scottish model when the area type is entered alone. Clearly explicitly incorporating personal and specific local amenity measures substantially improves our overall understanding of life satisfaction.
The results reported in Table 5 show that even after controlling for personal characteristics and the availability of locally provided services and amenities, the type of area continues to affects life satisfaction in Scotland, although the size and statistical significance of the relevant regres-sion coefficients is reduced. When we control for other factors, there is no longer a statistically significant difference between the life satisfaction in towns and cities. However, those living in rural areas of Scotland continue to have a significantly higher life satisfaction than those living in cities. As reported in the discussion of Table 1, this finding corresponds with results from other studies of how place affects well-being, which typically find that rural residents have a higher level of life satisfaction than those living in cities.
Nevertheless, while the type of area does have some effect, it is only one of several factors that affect life satisfaction and it is useful to consider its relative importance compared with other factors.
The results in Table 5 can be discussed in terms of how different types of factors affect well- being. People have little conscious choice over some of these, e.g., personal characteristics like age and sex, but how these are distributed by area will still affect the average level of life satisfaction in different areas. Controlling for these characteristics should remove these compositional effects. The same applies to personal characteristics over which there is more individual choice (e.g., marital status). In contrast, some factors are variables will vary across areas, including average incomes, unemployment, deprivation, housing and the local environment. It is therefore important to try to isolate the extent to which life satisfaction is affected specifically by spatial factors.
Dolan et al. (2008) develop a framework that classifies the influences on subjective well-being under the following headings, many of which are included in the present analysis:
• Income.
• Personal characteristics (e.g., age, gender).
• Socially developed characteristics (e.g., education, type of work). • How we spend our time (e.g., hours worked).
• Relationships (e.g., marriage, seeing family and friends).
[image:8.493.56.434.68.106.2]• Wider economic and social environment (including area impacts). Table 4. Regression results (area only – reference = Cities).
Regression coefficient t-value Regression R2
Towns 0.13 4.04 0.01
We use this framework to discuss the results in Table 5, though a full categorization is not possible because this includes some variables not measured in the SHS.
Income
[image:9.493.55.438.69.525.2]Echoing the conclusion noted by Blanchflower and Oswald (2011), for people in Scotland there is a positive relationship between income and well-being. This provides support for the argument that increasing gross domestic product (GDP) should be a component of economic and welfare policy.
Table 5. Determinants of life satisfaction in Scotland.
Coefficient t-ratio Location (reference: Cities)
Towns 0.047 1.00
Rural areas 0.123 2.08
Income
Average annual income (£s, 2009) 0.006 6.34
Personal characteristics
Age −0.039 −7.20
Age squared 0.0004 8.07
Gender (reference: Male) 0.205 6.05
Ethnicity (reference: White) −0.262 −2.42
Health status (reference: Good health)
Very good 0.414 11.47
Fair −0.626 −14.72
Bad −1.723 −24.27
Very bad −2.200 −17.58
Marital status (reference: Married)
Single −0.312 −6.43
Separated −0.496 −6.02
Divorced −0.429 −7.02
Widowed −0.480 −7.04
Single parent −0.071 −1.49
Employment status (reference: Employed full time)
Employed part time −0.039 −0.70
Self-employed 0.064 0.93
Looking after home/family −0.227 −2.95
Retired 0.285 4.39
Unemployed −1.019 −12.94
Disabled −0.626 −7.43
Other −0.119 −1.51
Housing (reference: Owns home)
Buying with mortgage −0.092 −2.05
Local authority renter −0.191 −3.53
Housing association renter −0.162 −2.52
Private sector renter −0.128 −2.03
Other
Community spirit 0.098 2.11
Good neighbours 0.143 4.40
Feeling very unsafe −0.470 −7.72
Crime index 0.0001 0.14
Pupil/teacher ratio 0.0001 0.01
Medical employees ratio 0.0005 0.31
Local unemployment rate −0.012 −1.58
Income inequality −0.090 −0.71
Rural/green/seaside area −0.133 −0.66
Personal characteristics
The model does not include a variable measuring inherited personality, as in Diener (1996), because such information is not available through SHS. However, a number of personal char-acteristics are highly significant. Both age and age-squared are statistically significant and life satisfaction in Scotland has the same ‘U’-shaped profile as seen elsewhere. The results suggests that, holding other factors constant, life satisfaction in Scotland falls to the age of 49 and subse-quently rises. Both gender and ethnicity also matter – women and white population groups both have a statistically significant higher level of life satisfaction when compared with the relevant reference groups.
Health
As in other studies, a central personal determinant of life satisfaction is the individual’s health status. This is the most important single characteristic in the Scottish regression results. Moving from ‘Good’ to ‘Bad’ and then ‘Very bad health’ reduces average life satisfaction by 20.0% and 25.5% respectively.9
Socially developed characteristics
As noted above, Blanchflower and Oswald (2011) question whether the link between education and life satisfaction is direct or whether it operates through the impact of education on income. The education measure used here was not found to be statistically significant when included with the income measure. Similarly, the individual’s occupational status, as measured by the Standard Occupational Classification skill categorization, did not additionally significantly affect life satisfaction.10
How we spend our time
There is robust evidence that being unemployed is associated with a significant reduction in well-being and this result is replicated here. Unemployment is the second most important factor, after health, in determining life satisfaction. Other things being equal, a move from employment to unemployment reduces life satisfaction by 11.8% compared with full-time employment.
However, there is less evidence that the number of hours worked affects well-being. Working part-time marginally lessens life satisfaction compared with full-time employment, but the effect is not statistically significant. Despite the possibility that those who are self-employed may work longer hours, this also has little effect. Only two time-related variables (other than being unem-ployed) impact on well-being. These are being retired (positively) and spending time looking after home and family (negatively), suggesting that it may not be the amount of free time we have but how we are able to spend it that impacts on life satisfaction.
Relationships
The wider economic and social environment Housing
Full home ownership plays a statistically significant role in life satisfaction as against purchasing with a mortgage and all forms of renting. Of course, those individuals who own their home out-right no longer have to meet rent or mortgage repayments so have a higher disposable income. Local authority renting has the biggest negative impact on life satisfaction.
Local economic, social and physical environment Public services
The econometric model incorporates a very limited coverage of local public services: very imperfect measures of local school and health provision are included. The quality of local education is measured by the teacher/pupil ratio and the measure of local health provision is the number of health workers as a share of the local population. Moreover, the measures used are for the whole local authority area, but there are likely to be variations in provision within these areas which the study simply cannot pick up. Neither of the two indicators used, which attempt to measure the quality of local public health and educational services, has a statistically significant influence on well-being.
Despite its links to deprivation and its presumed importance to the quality of local life, there has been relatively little previous work on how local crime rates affect well-being though Di Tella and MacCulloch (2008) do find a negative relationship between happiness and the levels of violent crime. In the present Scottish study, crime is measured by the number of crimes per 10,000 of pop-ulation, where the figures relate to the relevant local authority area. This measure shows a sizeable variation across Scotland, with all Scottish cities having a crime rate above the Scottish average.
However, the regression results reveal no relationship between life satisfaction and the objec-tive level of crime at the local authority level. The measured impact is very small, statistically insignificant (and is actually slightly positive). This result may again be due to the fact that it is measured at the level of the relatively aggregated local authorities, whereas crime might well be concentrated in localized ‘hotspots’ within these areas. Further research on objective crime impacts at sub-local authority level would be useful to address this question further.
This conjecture is supported by the fact that there is a strong negative relationship between life satisfaction and the perception of crime. While the incidence of crime is not significant, there is a very strong association between life satisfaction and feeling safe in one’s local area; on average, a move from feeling ‘Very safe’ to ‘Very unsafe’ reduces happiness by 5.5%. Unlike the objective crime index, this variable is measured for individuals and is more likely to register any local experience of crime. Alternatively, it may be that fear of crime is only weakly related to the volume of crime that actually occurs in a locality. Whatever the reason, we show below that this measure helps to explain differences in life satisfaction between rural and other areas because as is discussed later, the incidence of feeling safe is much lower in cities than in rural areas.
Other measures of deprivation appear to make little difference to perceived life satisfaction. Neither the local unemployment rate nor living in an area of multiple deprivation had a signifi-cant effect. The first of these is measured at local authority level and therefore might suffer from the same problem as identified with several other variables discussed already: the area definition is simply too aggregated to detect more localized impacts. However, this issue does not apply to the deprivation variable, which is measured for individuals.
Income inequality
ills to income inequality. They maintain that all levels of society are affected by the corrosive nature of inequality. However, we find no relationship between inequality and life satisfaction at local authority level in Scotland. Again this finding might simply reflect an inappropriate spatial aggregation.
Social capital
Respondents to the SHS are asked to answer a series of questions about what they liked about their local area, including two measures of social capital:
• Whether they felt that the area had a sense of community spirit. • Whether they felt they had good neighbours.
Both measures were positive and significant in the regression model. Given that people do appear to value living in areas where there is a strong sense of community support, social capital does play a positive role in increasing life satisfaction.
Local environment
The responses to what people liked about their area in the SHS also included two environmental measures. The first was whether they liked the area because it was a ‘Rural/green/countryside/ seaside’ area and the second was whether it had ‘No pollution/fresh air’. Neither variable was significant in our analysis. This result is rather unexpected, given that rural areas are found to be positively related to life satisfaction.
HOW IMPORTANT ARE SPATIAL DIFFERENCES TO LIFE SATISFACTION?
The econometric analysis suggests a very limited impact from a number of spatial measures which might be expected to influence life satisfaction. This includes measures of the quality of local life such as crime, deprivation, living in an area of high unemployment, income inequality and the quality of local public services. The converse is true for many personal and relationship measures, such as age, gender, marital status and health, which impact significantly on people’s happiness.11
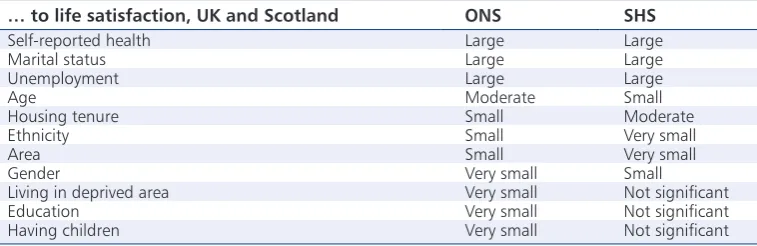
[image:12.493.57.436.534.657.2]Table 6 compares the contribution of spatial variables in the Scottish regressions against the findings of the ONS’s well-being study for the UK as a whole (Oguz et al., 2013, table 1, p. 3).12 The comparison is made using the R2 statistic which shows the proportion of life satisfaction that is explained by the econometric model. For example, the model results reported in Table 5 have an R2 equal to 24.9%. This means that the variables included in the model explain 24.9% of all variations in life satisfaction across the individuals included in the Scottish study.
Table 6. Contribution of variables.
… to life satisfaction, UK and Scotland ONS SHS
Self-reported health Large Large
Marital status Large Large
Unemployment Large Large
Age Moderate Small
Housing tenure Small Moderate
Ethnicity Small Very small
Area Small Very small
Gender Very small Small
Living in deprived area Very small Not significant
Education Very small Not significant
The importance of each measure is assessed by measuring the change in the R2 value associated with dropping that variable. The following criteria are used:
• Large = contribution of 1.0 percentage points or more to R2.
• Moderate = contribution of 0.05 < 1.0 percentage points to R2.
• Small = contribution of 0.1 < 0.5 percentage points to R2.
• Very small = contribution of less than 0.10 percentage points to R2.
These two exercises use different databases and a different range of variables and definitions. For example, the variables identifying age, gender, health and marital status and housing tenure are identical or very similar. On the other hand, the measures for deprivation differ, as do those for ethnicity, work status and having children, in each case because the ONS variables are wider than those used in the Scottish study. For example, the definition of ethnicity in the Scottish regressions is white versus non-white, while the ONS includes nine different ethnic groups.13
Despite this, the same variables enter in very similar ways, including the area results. The ONS uses residence in London as the reference variable and compares life satisfaction there against Nomenclature of Territorial Units for Statistics 1 (NUTS-1) regions across the UK. Each of these NUTS-1 geographies was further subdivided by a rural/urban dummy variable. Similar to the present study, the ONS found that ‘generally across regions, people living in rural areas give higher ratings for their well-being than those living in urban areas when other factors have been taken into account’ (Oguz et al., 2013, p. 42). In both cases, the area in which people live made only a limited contribution to the model’s explanatory power. Overall, the results for Scotland are consistent with those for the UK; what makes people in Scotland happy does not differ greatly from people elsewhere in the UK.
What explains urban–rural differences in life satisfaction?
As in other studies, the results presented here show that the type of area has some impact on life satisfaction. In Table 2 the coefficients are reported where only the area dummies are entered in the regression equation. In the results shown in Table 5, when a number of other variables are introduced, the regression coefficients on the area dummies are much reduced. It is interesting to investigate what is causing the reduced area effect. In a sense, spatial variations in the added variables account for some of differences between the broad areas, though there is still an unex-plained residual, especially for rural areas against cities.
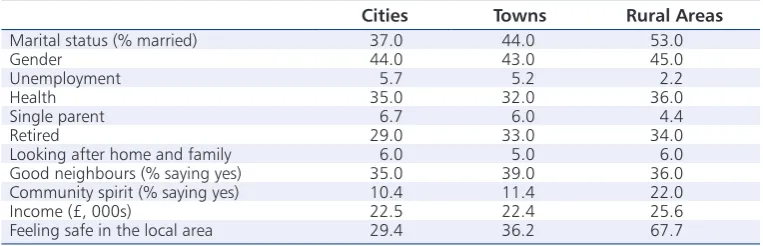
[image:13.493.56.438.534.657.2]Table 7 details differences in the distribution of variables which were statistically significant in the main regression equation across the three area types – cities, towns and rural areas. The distribution is for the population in the sample.
Table 7. Area endowments of key variables (% by area).
Cities Towns Rural Areas
Marital status (% married) 37.0 44.0 53.0
Gender 44.0 43.0 45.0
Unemployment 5.7 5.2 2.2
Health 35.0 32.0 36.0
Single parent 6.7 6.0 4.4
Retired 29.0 33.0 34.0
Looking after home and family 6.0 5.0 6.0
Good neighbours (% saying yes) 35.0 39.0 36.0
Community spirit (% saying yes) 10.4 11.4 22.0
Income (£, 000s) 22.5 22.4 25.6
Table 7 demonstrates that part of the reason that rural areas in Scotland have a higher level of life satisfaction compared with urban areas is because their endowment of several significant factors is in their favour. This comes out very strongly in the variable measuring ‘Feeling safe’, where rural dwellers are much more likely to report that they do. This is the most important determinant of difference in life satisfaction between the two areas. The second is marital status – rural residents are much more likely to be married. The third determinant is the unemployment rate, which is lower in rural areas than cities and whilst there is quite a large difference between the average income (in favour of rural regions), this plays only a small part in explaining the difference, as does the higher sense of community spirit. Note that the makeup of the surveyed population runs counter to some common preconceptions. The city population has a similar health, retirement and good neighbourliness score as those in rural areas.
Rural inhabitants perform better against two key economic variables; annual net income and the probability of unemployment. Both findings are surprising given the data reported in other surveys such as the European Quality of Life Survey. This has further implications for the NEG.
However, note that both these economic variables are measured by where respondents live and not by where they work. In a country the size of Scotland, it is perfectly possible to live in a rural area and to commute to work in a town or city. We addressed this by rerunning the model with the wider area categorization shown in Table 8. This specification differs from that used in the main model in that it distinguishes areas by whether or not they are accessible to larger settlements, although only to those with a population above 10,000.14
While life satisfaction is always greater than in cities, it is only statistically significantly higher when individuals live in an area which is both rural and accessible to a larger area, including cities. The coefficient on ‘Accessible rural’ is larger than the on rural alone15 and the statistical significance also increases. Other things being equal, living in the country does increase life satisfaction, but only where rural residents are also able to access the services (including employment) available in larger areas.
CONCLUSIONS: URBAN–RURAL DIFFERENCES IN LIFE SATISFACTION IN
SCOTLAND
UK growth policy focuses on cities as the location of growth-supporting agglomeration effects, such as knowledge spillovers, labour pooling and producer–supplier linkages (BIS (Department for Business, Innovation and Skills), 2013; HM Government, 2011). Even the policy objective of geographically rebalancing the UK economy is expressed in terms of strengthening ‘challenger’ cities to offset the dominance of London (PwC, 2015). However, the growth of UK cities, in terms of population, has been no higher than that of the rest of the country in the 20-year period 1991–2011. Moreover, in 2011, 15% of the British population lived in London and 27% of the Scottish population lived in the four largest Scottish cities.
[image:14.493.54.436.69.134.2]However, the econometric analysis in this paper finds a significant negative relationship between city living and life satisfaction where these variables are regressed alone. When additional variables are incorporated in the regressions, many of which act to capture area compositional effects, the Table 8. Accessibility and life satisfaction.
t-ratio
Small urban areas 0.98
Accessible small towns 0.05
Remote small towns 1.34
Accessible rural areas 2.37
coefficients on the area dummies are reduced in size and statistical significance. But there still remains an unexplained significant difference between the life satisfaction in city and rural areas. Also a number of the additional variables that identify specific area affects are significant and go some way to explaining why rural regions provide greater life satisfaction. From these results, it is difficult to maintain the notion that cities are inherently desirable places to live from these data. In commenting on the implications for economic development policy it should be stressed that the data in the Scottish survey relate to where people live rather than where they work. Nevertheless, the results suggest that policy-makers should be wary of endeavouring to increase city size as a means to stimulate economic growth. At the very least, if cities are to be promoted as growth hubs, complementary policies need to be implemented that address the social and environmental costs of cities. The concentration of job opportunities in cities increases inter-regional migration, which in turn stretches family, friendship and community relationships. In addition, commuting times tend to be longer in large cities, leading to a reduction in leisure and family time, and potentially generating strains in family relationships and broader social capital. Similarly, in the absence of effective policy responses, environmental quality is likely to be lower in agglomerations, partly due to congestion and pollution, but also due to more limited access to green space and the natural environment.
Additional policy issues relate to the implications of land use, urban and transport planning for the promotion of life satisfaction, rather than solely business development and economic growth. In particular, effective urban planning can contribute to reducing commuting times and difficul-ties via decisions on the location of business, housing, amenidifficul-ties and public services. Land use planning can help to safeguard and promote more widespread access to the natural environment and green space, in both urban and rural areas.
Further, the study suggests the need for public policy to address both the interpersonal and the interregional dimensions of inequality. It shows that the disadvantage of cities diminishes if account is taken of individual characteristics which are known to affect life satisfaction. It there-fore supports the importance of targeted support to individuals and social groups which suffer particular or multiple dimensions of disadvantage (e.g., in terms of income, access to employment or education/training, mental health and family support). However, even after allowing for such individual factors, cities remain characterized by lower levels of life satisfaction, suggesting that there is also a need for additional policy intervention in particular areas. This may take the form of policy instruments aimed, for example, at the physical regeneration of certain urban areas, to create employment in areas with high unemployment, or to empower communities to find their own solutions to local problems.
The Scottish results reported here are more successful than those from the UK-wide analysis carried out by the ONS (Oguz et al., 2013). Nevertheless, just over three-quarters of the varia-tion in life satisfacvaria-tion between individuals in Scotland remains statistically unexplained. In the analysis a number of issues have been raised which we wish to explore more fully in future work. The first is that the regression results failed to identify any impact of objective measures of local service provision on life satisfaction. The reason might well be that publically available data is only available at the local authority level which might be for an inappropriately large area. We are actively investigating the possibility of access to a more spatially disaggregated data set for these variables. This would not affect the relative desirability of city as against rural locations but would better identify exactly what causes this adverse impact on life satisfaction.
Third, the approach that has been adopted is standard in this literature and accounts for impact of personal characteristics as long as these operate additively and homogeneously across the population. However, these assumptions might be inappropriate; Regressions focusing solely on the employed failed to provide qualitatively different results. However, we aim to test more options along these lines whilst attempting to avoid excessive data mining.
ACKNOWLEDGEMENTS
The authors are grateful to Darryl Holden and to two anonymous referees for comments made on earlier drafts.
FUNDING
The authors acknowledge financial support from the International Public Policy Institute at the University of Strathclyde.
NOTES
1. See https://www.gov.uk/government/uploads/system/uploads/attachment_data/file/427339/ the-northern-powerhouse-tagged.pdf/.
2. The 23 cities are those with a population over 500,000 in 1991. Only nine had population growth greater than the British average over the subsequent period to 2011. The growth of London was by far the highest (Cheshire, Nathan, & Overman, 2014, p. 14).
3. For reasons discussed below, ‘happiness’ is measured by life satisfaction scores. In this paper, except where specifically identified, the terms ‘happiness’, ‘well-being’ and ‘life satisfaction’ are used interchangeably.
4. The study did not define ‘major’ cities.
5. The paper did not define ‘small towns’ or ‘large cities’.
6. All variables used in the study are defined in the Appendix.
7. Note that all area measures used here follow Scottish government definitions and are based on data available at Scottish local authority level, which does not allow us to take account of variations within local authorities.
8. Very similar findings emerge even if we exclude pensioners and limit the analysis only to those who are in the labour market.
9. These are calculated as the coefficient on the Bad health and Very bad health dummies divided by the average life satisfaction score, 8.6. This is the general method used when calculating the average change in life satisfaction contributed by particular characteristics
10. The skill categorization was: Higher managerial and professional occupations, Lower man-agerial and professional occupations, Intermediate occupations, Small employers and own account workers, Lower supervisory and technical occupations, Semi-routine occupations and Routine occupations.
11. The overall effect of personal measures would probably be further increased if a measure of personality could be included in the model.
12. Income was significant in the in the Scottish analysis, but is not included in Table 6 because the ONS analysis does not include a comparable income measure.
13. See Oguz et al. (2013) for a full set of ONS variable definitions.
14. While we included all variables shown in Table 3, there is little difference in the other var-iables and we report results only for the revised areas. The reference case is cities.
REFERENCES
Alesina, A., Di Tella, R., & MacCulloch, R. (2004). Inequality and happiness: Are Americans and Europeans different? Journal of Public Economics,88, 1009–2042.
BIS (Department for Business, Innovation and Skills). (2013). Smart Cities: Background paper. London: Department for Business, Innovation and Skills.
Bjornskov, C., Dreher, A., & Fischer, J. A. V. (2008). Cross country determinants of life satisfaction: Exploring different determinants across groups in society. Social Choice and Welfare,30, 119–173.
Blanchflower, D. G., & Oswald, A. J. (2004). Well-being over time in Britain and the USA. Journal of Public Economics,88, 1359–1386.
Blanchflower, D., & Oswald, A. (2011). “International happiness” National Bureau of Economic Research, Working paper 16668. Retrieved from http://www.nber.org/papers/w16668
Cheshire, Nathan, M., & Overman, H. G. (2014). Urban economics and urban policy: Challenging conventional policy wisdom. London: Edward Elgar.
Di Tella, R., & MacCulloch, R. J. (2008). Gross national happiness as an answer to the Easterlin Paradox. Journal of Development Economics,86, 22–42.
Diener, E. (1996). Traits can be powerful but are not enough: Lessons from subjective wellbeing. Journal of Research in Personality,30, 389–399.
Dijkstra, L., & Poelman, H. (2011). Regional typologies: A compilation, regional focus (Vol. 1). Brussels: European Commission.
Dijkstra, L., & Ruiz, V. (2010). Refinement of the OECD regional typology: Economic performance of remote rural regions. Paris: European Commission/OECD.
Dockery, A. (2003). Happiness, life satisfaction and the role of work: Evidence from two Australian surveys. Working Paper No. 03.10, School of Economics and Finance, Curtin Business School, Curtin University of Technology.
Dolan, P., Peasgood, T., & White, M. (2008). Do we really know what makes us happy? A review of the economic literature on the factors associated with subjective well-being. Journal of Economic Psychology,29, 94–122.
Easterlin, R. A. (1974). Does economic growth improve the human lot? In P. A. David, & M. W. Reder (Eds.), Nations and households in economic growth: Essays in honour of Moses Abramovitz. New York, NY: Academic Press Inc (pp. 89–125).
Ferrer-i-Carbonell, A., & Gowdy, J. M. (2007). Environmental degradation and happiness. Ecological Economics, 60, 509–516.
Fitoussi, J.-P., Sen, A., & Stiglitz, J. (2009). Report of the commission on the measurement of economic performance and social progress. Paris: Commission on the Measurement of Economic Performance and Social Progress. Gerdtham, U., & Johannesson, M. (2001). The relationship between happiness, health, and socioeconomic
factors: Results based on Swedish microdata. Journal of Socio-Economics,30, 553–557. Glaeser, E. L. (2011). Triumph of the city. New York, NY: Penguin Press.
Graham, C., & Felton, A. (2006). Inequality and happiness: Insights from Latin America. Journal of Economic Inequality,4, 107–122.
Hayo, B. (2004). Happiness in Eastern Europe. Mimeo, Philipps University Marburg, Number 12/2004. HM Government. (2011). Unlocking growth in cities. London: Cabinet Office.
Hudson, J. (2006). Institutional trust and subjective well-being across the EU. Kyklos,59, 43–62. Jacobs, J. (1961). The death and life of great American cities. New York, NY: Random House.
Krugman, P. R. (1991). Increasing returns and economic geography. Journal of Political Economy,99, 483–499. OECD. (2011). Regional Typology. Paris: OECD.
PwC. (2015). Good growth for cities 2015: Our report on economic wellbeing in UK urban areas. London: Price Waterhouse Cooper.
Samuelson, P. (1938). A note on the pure theory of consumers’ behaviour. Economica,5, 61–71. Scottish Government. (2011). Scottish household survey annual report 2011: Update note: Scottish
Government Urban Rural Classification 2011-2012 Analysis. Edinburgh: Scottish Government.
Seigler, V. (2015). Measuring national well-being – An analysis of social capital in the UK. Office for National Statistics.
Shucksmith, M., Cameron, S., Merridew, T., & Pichler, F. (2009). Urban–rural differences in quality of life across the European Union. Regional Studies,43, 1275–1289.
Skidelsky, E., & Skidelsky, R. (2012). How much is enough? Money and the good life. New York: Other Press. Sørensen, J. F. L. (2014). Rural–urban differences in life satisfaction: Evidence from the European Union.
Regional Studies,48, 1451–1466.
Stewart-Brown, Chandimali Samaraweera, P., Taggart, F., Ngianga-Bakwin, K., & Stranges, S. (2015). Socioeconomic gradients and mental health: Implications for public health. British Journal of Psychiatry, March 19, 2015, 461–465.
United Nations. (2011). World Urbanisations Prospects, the 2011 revision. Retrieved from http://esa.un.org/ unup/CD-ROM/Urban-Agglomerations.htm. File 17c: Percentage of Urban Population in Cities Classified by Size Class of Urban Settlement, Major Area, Region and Country, 1950-2025.
APPENDIX
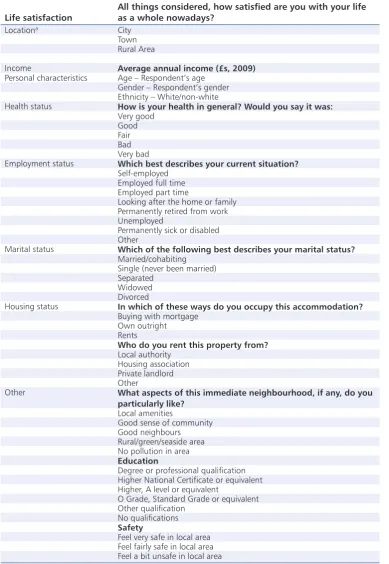
Table A1. Definition of variables.
Life satisfaction
All things considered, how satisfied are you with your life as a whole nowadays?
Locationa City
Town Rural Area
Income Average annual income (£s, 2009)
Personal characteristics Age – Respondent’s age Gender – Respondent’s gender Ethnicity – White/non-white
Health status How is your health in general? Would you say it was:
Very good Good Fair Bad Very bad
Employment status Which best describes your current situation?
Self-employed Employed full time Employed part time
Looking after the home or family Permanently retired from work Unemployed
Permanently sick or disabled Other
Marital status Which of the following best describes your marital status?
Married/cohabiting Single (never been married) Separated
Widowed Divorced
Housing status In which of these ways do you occupy this accommodation?
Buying with mortgage Own outright Rents
Who do you rent this property from?
Local authority Housing association Private landlord Other
Other What aspects of this immediate neighbourhood, if any, do you particularly like?
Local amenities
Good sense of community Good neighbours Rural/green/seaside area No pollution in area
Education
Degree or professional qualification Higher National Certificate or equivalent Higher, A level or equivalent
O Grade, Standard Grade or equivalent Other qualification
No qualifications
Safety
Feel very safe in local area Feel fairly safe in local area Feel a bit unsafe in local area
Life satisfaction All things considered, how satisfied are you with your life as a whole nowadays?
Feel very unsafe in local area
Crimeindex
Number of recorded crimes per 10,000 population, Scottish local authority area
Pupil/teacher ratio
Number of pupils/teachers, Scottish local authority area
Medical employees ratio
Number of medical employees per 10,000 population, Scottish local authority area
Incomeinequality
Ratio of income share of the top 10% of income earners to that of bottom 40%
[image:20.493.55.437.69.217.2]aSee the Scottish government’s six-fold urban rural classification in Table A2.
Table A2. Scottish’s government six-fold urban rural classification. Area type
City – Large urban areas – households in the city conurbations of Edinburgh, Aberdeen, Dundee and Glasgow (settlements over 125,000 population)
Town – Other urban areas – households in settlements of 10,000–125,000 people
Town – Accessible small towns – households in settlements of between 3000 and 10,000 people and within 30 min drive of a settlement of 10,000 or more
Town – Remote small towns – small towns (between 3000 and 10,000 people) with a drive time of more than 30 min to a settlement of 10,000 or more
Rural area – Accessible rural – households in settlements of less than 3000 people and within 30 min drive of a settlement of 10,000 or more
[image:20.493.54.437.282.458.2]Rural area – Remote rural – households in settlements of less than 3000 people and with a drive time of more than 30 min to a settlement of 10,000 or more