DOI: XXX
Molecular Dynamics Simulation of
Persistent Slip Bands Formation in Nickel-base
Superalloys
Jianfeng Huang
1∗Zhonglai Wang
2Erfu Yang
3Don McGlinchey
1Yuanxin Luo
4Yun Li
5Yi Chen
5 1School of Engineering and Built Environment, Glasgow Caledonian University, Glasgow G4 0BA, U.K.2School of Mechatronics Engineering, University of Electronic Science and Technology of China, People’s Republic of China 3Space Mechatronic Systems Technology Laboratory (SMeSTech), Department of Design, Manufacture and Engineering Management, James
Weir Building, University of Strathclyde, Glasgow G1 1XJ, U.K.
4College of Mechanical Engineering, Chongqing University, Chongqing, People’s Republic of China
5College of Computer Science and Technology Dongguan University of Technology Songshanhu, Dongguan, Guangdong 523808 People’s
Republic of China
Abstract: Persistent slip band (PSB) is an important and typical microstructure generated during fatigue crack initiation. Intensive work has been done to investigate the mechanisms of the formation of persistent slip bands since the 1950s when Wadsworth[1]observed the fatigue fracture in copper. Simulations have indicated that PSBs formation during fatigue crack initiation
related to the dislocation driving force and interaction. In this paper, a molecular dynamics (MD) simulation associated with embedded atom model (EAM) is applied on the PSBs formation in nickel-base superalloys with different microstructure and temperature under tensile-tensile loadings. Five MD models which different in microstructure(pure γphase andγ/γ0 phase), grain
orientation([1 0 0][0 1 0][0 0 1] and [1 1 1][¯1 0 1][1 ¯2 1]) and simulation temperature(300K, 600K, 900K) were built up in these simulations. Our results indicated that PSBs formed within theγphase by massive dislocations pile-up and propagation which can penetrate the grain. Also, the temperature will affect the material fatigue performance and blur PSBs appearance. The simula-tion results are in strong agreement with published experimental test result. This simulasimula-tion is based on the author’s previously work[2].
Highlight:
1. Investigation of the PSB formation via molecular dynamics simulation with three different parameters 2. A new deformation and velocity combination controlled simulation conduct for the PSB formation. 3. High performance computing of PSB formation.
4. Systematic analysis of the PSB formation at the atomic scale in which the dislocation play a critical role.
Keywords: Persistent Slip Bands, Molecular Dynamics, Superalloys, Computational Simulation, EAM.
1
Introduction
Fatigue crack is a kind of mechanical fault which causes the material crash suddenly but without evidence in ad-vance. Since this characteristic of fatigue, it has been the major fault of the industrial product or building structure. The first report of fatigue behaviour was in 1837 related to miner chain fracture caused by fatigue. Literally, fatigue is a kind of phenomena of crack propagation in the metal caused by the cyclic load for a long period of time. Fa-tigue is the most important factor of metal failure because it’s unpredictable under working environment. There were many disasters in history caused by the fatigue failure of some working part. For example, the twice Comet airliner disasters occurred in 1954 lead to 56 people dead on board due to fatigue failure[3]. These crashes caused by a small crack generated by metal fatigue near the radio direction, situated in the front of the cabin roof.
Because of the serious effect of fatigue on the safety, nu-merous researches have been done since the middle of 19th century. Many theories about metal fatigue have been for-malized and new ideas about fatigue life prediction have been published, most important, many advanced
instru-Regular paper
Manuscript received date; 05-01-2016
This work was supported by School of Engineering and Built Envi-ronment, Glasgow Caledonian University.
ments have been invented to measure and examine fatigue crack.
Fig. 1 Fatigue crack initiation from a) dislocation b) dislocations slip under critical resolved shear stress, c) dislocation blocked, d) low energy dislocation pathway and PSB formed, e) vacancy generated by dislocation annihilate, f) intrusion and extrusion formed
crack initiation
slip bands.
Considering the importance of PSBs during the fatigue crack initiation, intensive works have been done to investi-gate the persistent slip bands formation and evolution. The common knowledge is PSB form after the initial hardening ceases with the dislocation matrix formed. For example, in copper single crystals the PSBs begin to appear when the material hardening stops and the cyclic stressstrain re-sponse saturation reaches[5]. As illustrated in Fig. 1, dislo-cations generated in the material under the cyclic load and they will slip along the crystalline slip system once the criti-cal resolved shear stress reached. Some dislocations blocked by other dislocation, inhomogeneous, or grain boundary. With the cyclic load continue, the previous process repeat-ed and lower energy pathway formrepeat-ed to allow the motion of dislocation continue along this way to form the dislocation wall. While, associated with the formation of the dislo-cation wall, dislodislo-cation matrix generated outside. At the same time, positive and negative dislocations interact with each other, once if close enough, they annihilate so that the vacancy nucleate. Finally, according to vacancies diffusion, the extrusions and intrusions will be formed in the grain boundary or material surface. During the PSBs formation, A.T. Winter[6] found that the volume fraction of PSBs re-lated to the disparate strain ratio distributing in PSBs and matrix. And the relationship of the shear plastic strain in different area is represented by the formula below:
γ= (1−f)γm+f γpsb (1)
Whereγis the material shear plastic strain andγm,γpsb
represent the shear plastic strain of matrix and PSBs re-spectively. Andf is the volume fraction of PSBs. Exper-iment revealed that PSBs are likely form at the range of plastic strain amplitudes of 1×10−46pa61×10−3 on
individual cycled nickel polycrystalline grains having con-siderable different axial orientations[7].
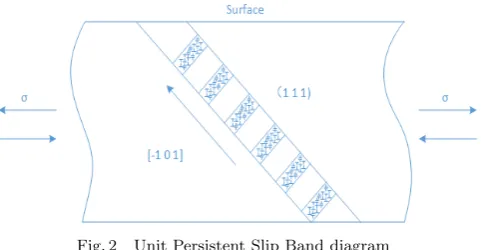
With the PSBs motivation and evolution, ladder-like dis-location wall perpendicular to the primary slip direction will be formed. Fig. 2 illustrates the typical unit PSB along the [¯1 0 1] direction on plane (1 1 1). The thickness of the slab normally 1∼2µm. The dislocation walls consist majori-ty of edge dislocation dipole and the distance between the dislocation walls is regularly about 1.3µm[8].
Fig. 2 Unit Persistent Slip Band diagram
When cyclic loads applied on the material continue, ex-trusion and inex-trusion finally emerge on the surface of the material. While dislocations motivation displays complex dynamics behaviours at this time. Among the dislocation movement, some dislocations exhibit the movability while others are the inhabitant, the first one can be called acti-vator and the later is so called inhibitor. To evaluate the dislocation, a set of spatial and temporal based disloca-tion density funcdisloca-tionsρm(x, t) andρi(x, t), as known as the
Walgraef-Aifantis model, provided by [9,10]. These dislo-cation density functions have two parts, one is to describe the activator dislocations density which is the domination. And the other part is to describe the inhibitor dislocation density which is a minor partition. The two functions are given below:
∂ρi
∂t =Di ∂2ρi
∂x2 +g(ρi)−βρi+γρmρ 2
i (2)
∂ρm
∂t =Dm ∂2ρm
∂x2 +βρi−γρmρ 2
i (3)
In this partial differential function, Dm and Di donate
the diffusion coefficient of both mobile and immobile dislo-cation separately. It is considered that the gradient of dis-location density of time is contributed by terms 1)Di∂
2ρ i ∂x2, Dm∂
2ρ m
∂x2 , the diffusion of immobile and mobile dislocations,
separately 2)βρi, the transformation of immobile
[image:2.595.70.527.72.214.2] [image:2.595.313.554.278.403.2]γρmρ2i, the transformation of mobile dislocations to
immo-bile dislocations. 4)g(ρi), which only in the equation of
im-mobile dislocation density, represents a function of the gen-eration of immobile dislocation by the applied shear stress considered. In this model, it assumed the immobile dislo-cation diffusion coefficient was far less than the mobile dis-location diffusion coefficient because of the mobility of acti-vator was much greater than that of inhibitor. This model reflected the characteristic of PSBs in dislocation generat-ing, dislocation diffusion, and dislocation interaction. And it considered the PSBs formation because of the interaction between activator and inhibitor in which the activator was incapable of damping locally the growth of fluctuations of the inhibitor by the diffusion spreading. The limitation of this model was the independent of stress and temperature since only a few parameter related.
In this paper, our purpose is to provide an atomic mod-el to investigate the unit PSB formation mechanism. We will introduce our molecular dynamic simulation method and related technician in section II and build up the atomic model at section III. Finally, we will analyse the simula-tion results in secsimula-tion IV, discuss and give the conclusion in section V and VI.
2
Methodology
Molecular dynamics is widely applied in chemical, mate-rial and biological science because of its special simulation ability on the study of the physical problem in atomic scale by solving a serial of ordinary differential functions, such as classical mechanics motion equations with Newton sec-ond law or the classical Hamilton function. Although MD is less precise than other simulation methods based on the quantum theory such as density functional theory (DFT), it is popular and well developed since the good performance. And also, the precise of the MD simulation results can be improved by adopting the potential between particles cal-culated by DFT. The fundamental of MD is to study the physical properties of the material by analysing the discrete particles trajectory which is calculated by solving these d-ifferential equations. Obviously, the molecular dynamics models consist of discrete particles, and besides, include their interactions potential which take action in a given en-semble with defined boundary conditions. It is known from the Newtons second law of motion that Fi = miai. And
also the force can be derived from the gradient of potential function ∂Etot
∂ri with respect to atomic displacements.
Fi=
∂Etot
∂ri
(4)
Normally, theEtotcan be simply represented with a sum of
pairwise interactions in which the famous one is Lennard-Jones (LJ) potential[11].
Etot=
X
i
X
j>i
Φ(|ri−rj|) (5)
While within the crystalline metal, the better representa-tion of the energy is the following embedded atom method model potential[12] which is a many-body interaction be-tween atoms associated with the function of the electron
cloud in the metal.
Etot=
1 2
X
i,j(i6=j)
ΦSiSj(rij) +
X
i
FSi( ¯ρi) (6)
In this EAM potential equation, the first term is the sum of all pair interactions between atoms similar with LJ po-tential, ΦSiSj is a pair-interaction potential between atoms
iandjin which have different atom types ofSi andSj.at
positionsriandrj=ri+rij. The second term is the sum
of embedding energy of all atoms in the system. Function
FSi denotes the energy of atomi, which depends upon the
host electron density ¯ρiat siteiinduced by all other
atom-s of the atom-syatom-stem. Baatom-sed on thiatom-s method, G.P. Purja Puna and Y. Mishin[13]published a developed Ni-Al system EAM potential which demonstrates a fairly good agreement with experimental and ab initio results for the formation energies of several other compounds of the Ni-Al system in 2009.
With the advantage of molecular dynamics simulation, many works have been deployed to research the nature of the material in the atomics level. And many post anal-ysis methodologies have been applied for the case study. For example, Musazadeh and Dehghan[14]studied the crack propagation behavior in nanocrystalline Ni which contains different shapes and types of second phases with Pd, Cu, A, and Ag. Their MD simulation found that the short cylin-drical shape exhibited a minority effect compared to the long cylinder impurity by analyzing the crack growth rate and strain energy release rate. In 2D plane case, the strain energy release rateGis defined by:
G= EW ε
2
2(1−ν2) (7)
where E is Youngs modulus and ν is Poissons ratio,W is the width of simulation box,εis the applied strain. Similar, in 2012, Paul White researched the fatigue crack growth in aluminum with the MD methods associated with isotrop-ic linear elastisotrop-ic fracture mechanisotrop-ics (LEFMs). In this sim-ulation, a cylinder atomic model with pre-notched crack containing nearly 3 million atoms simulated with three d-ifferent potentials (MFMP99[15], LEA04[16], SKCFC11[17]) potential) under a fatigue load which ratio was R=0. The significant difference between those potentials was the mea-sured stable stacking fault energy γSF which affects the
extent of dissociation of dislocation and unstable stacking fault energyγU SF which represents the energy barrier to
[image:3.595.336.523.590.732.2]Table 1 The simulation model test cases setup
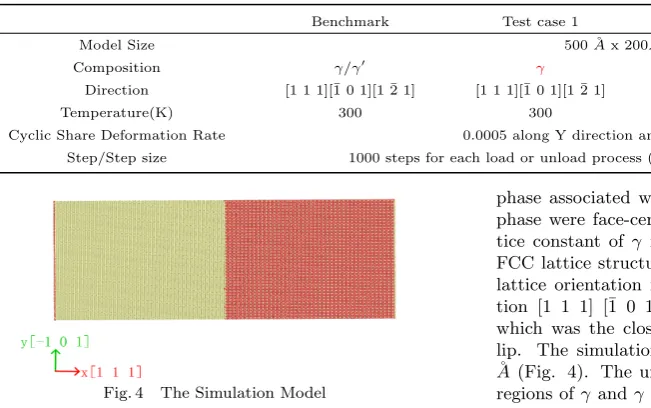
Benchmark Test case 1 Test case 2 Test case 3 and 4
Model Size 500 ˚Ax 200˚Ax 40˚A
Composition γ/γ0 γ γ/γ0 γ/γ0
Direction [1 1 1][¯1 0 1][1 ¯2 1] [1 1 1][¯1 0 1][1 ¯2 1] [1 0 0][0 1 0][0 0 1] [1 1 1][¯1 0 1][1 ¯2 1]
Temperature(K) 300 300 300 600/900
Cyclic Share Deformation Rate 0.0005 along Y direction and velocity of 0.46-0.98
Step/Step size 1000 steps for each load or unload process (1 fs for half cycle, 2 fs for whole cycle)
Fig. 4 The Simulation Model
dislocation nucleation. The simulation and energy analysis revealed that with lower stacking fault energy (SKCFC11), dislocation emission occurred faster than that with others potential, and material with lower unstable stacking fault energy appeared strong stability thus the formation of dis-location became difficult[18].
Also, Po-Hsien Sung and Tei-Chen Chen[19] studied the crack growth and propagation behavior in single crystal Ni by MD method associated with tight-binding potential. By analysis the von Mises stress and centrosymmetric parame-ter (CSP) distribution in the nanoribbon single crystal Ni, the partial dislocations slips was observed at the crack tip in the close-packed (1 1 1) plane till material fracture occur-ring and critical stress in single crystal Ni follows the order
σ[1 1 1]> σ[1 0 0]> σ[1 1 0]. Kai Zhou et al researched the effect of grain size and shape on mechanical properties of nanocrystalline copper with MD simulation by comparing the some macro properties of the material such as stress and Youngs modulus[20].
Besides the energy release rate analysis, stress - strain analysis and CSP analysis, Mao Wen et al[21] developed a deformation index (DI) during their research of the hydro-gen embrittlement phenomenon in single crystal Ni with EAM potential. The DIµiof atomiis defined as:
µi=
max(|r~ij−r~ij0|)
|b| (8)
where r~ij is the relative position vector of atom i and
j andr~ij0 is the vector in reference lattice, bis the
Burg-ers vector of 1/2[1 1 0]. With the DI analysis, the slip activities and dislocations can be traced and located im-mediately. Any lattice imperfections, torsion and structure changes can also be displayed clearly.
3
Modelling
To compare the effect of lattice orientation, phase and temperature on PSBs formation in Nickel alloy, three d-ifferent group cases were studied in this paper. The first group includes two test cases, one with γ phase pure N i, and another case, which was a benchmark test case, wasγ
phase associated with γ0 phase of N i3Al. Both γ and γ0 phase were face-centered cubic (FCC) lattice and the lat-tice constant of γ is 3.52 ˚A and γ0 was 3.572 ˚A[22]. The FCC lattice structure of N i3Al was shown in Fig. 3. The lattice orientation in the simulation box was along direc-tion [1 1 1] [¯1 0 1] [1 ¯2 1] and in the plane of (1 1 1) which was the close package plane and atoms tend to s-lip. The simulation box was about 520 ˚A x 200 ˚A x 40 ˚
A (Fig. 4). The unconstrained misfit[23] between the two regions of γand γ was 0.015 in the combined phases case. The second group included two test cases all with γ and
γ phase but the orientation was different, one was same as the test case in the first group, but another one was along [1 0 0] [0 1 0] [0 0 1] lattice direction. And the test cas-es in the final group was same as the benchmark tcas-est case in the first group but under the different temperature of 600K and 900K separately. Totally, nearly 300 thousand atoms created in all these simulation tests in which the grain size was about 10 nm. This was a very fine grain size expected with high fatigue resistance. Periodic boundary condition was set on the x y z directions which indicat-ed the repeatable atoms topography along the directions. These simulations ran with Large-scale Atomic/Molecular Massively Parallel Simulator (LAMMPS) which is a par-allel computation system. And the simulation result was visualized by OVITO(www.ovito.org). During the simula-tion of these designed test cases, at first, minimizasimula-tion of the system energy was run at the temperature of 300 K. The equilibrium of the system would make the whole sys-tem be in a stable condition. After that, a deformation rate of 0.0005 in y direction was applied in the simulation area and uneven velocity range from 0.46 to 0.98 was applied on the different simulation groups along the Y and reverse Y direction for 1000 simulation steps separately with step time of 0.001 ps, and total simulation time in this load turn was 2 ps. The whole process repeated several times to apply the cyclic load on test systems. Simulations were performed by parallel computing with 60 cores on ARCHIE-WeSt(www.archie-west.ac.uk) which is a high performance computer built with 3408 cores for distributed parallel and serial computing. It took 50 core hours for each test case.
4
Simulation Result
4.1
γ
0phase effect on PSB formation
[image:4.595.63.389.87.291.2]are two kinds of mechanism in the second phase strength-en theory: the first mechanism is that dislocations cutting through particles if the particle softer than the base ele-ment. And the another one is dislocations pass through the particle by bowing and the dislocation loops are formed af-ter them, also this is known as Orowan strengthening[24]. The first law is:
τ =πrγ
bL (9)
whereτ represents material strength,ris the second phase particle radius, γ is the surface energy, b is the Burgers vector, andL is the spacing between pinning points. This governing equation shows that the strength is proportional to r which indicates that as the size of the second phase particles increases, the particle impede dislocation move-ment and it becomes increasingly difficult for the particles to cut through the material. In other words, the strength of a material increases with increasingr.
While in Orowan strengthening mechanism, the greater size particles can’t be cut but only by bowing of disloca-tions. The equation for this model is:
τ= Gb
L−2r (10)
where τ is the material strength, Gis the shear modulus, bis the magnitude of the Burgers vector,Lis the distance between pinning points, andris the second phase particle radius. Considering the two mechanisms together, it reveal-s that the reveal-second phareveal-se particlereveal-s have a critical reveal-size with which the material will exhibit maximum yield strength. Besides that, the second phase also plays a role in enhanc-ing the fatigue resistance. For example, in Nickel alloy, a big size of impurity second phase had a strong effect to prevent the crack growth. And if in the case the alloying elemen-t aelemen-tom weighelemen-t and laelemen-telemen-tice conselemen-tanelemen-t were greaelemen-ter elemen-than Ni, less energy released rate was detected which means some elements such as Pd contribute to the strengthen of Nickel alloy than other elements such as Cu and Au.
In our simulation, we compared the effect of second phase
γ0with the pureγphase in the simulation test case 1 which showing in Table 1. By introducing theγ0phase, the lattice parameter is different thanγphase since the present of Alu-minium atoms. This misfit introduced by the second phase could cause antiphase boundary(APB) which increase the alloys tensile strength. The phase boundary plays a key role to obstacle the dislocation motion between the phase thus increases the strength. To quantify the occurrence of defects in this simulation, the microstructure of the mate-rial was analyzed by adaptive common neighbor analysis (CNA)[25] and centrosymmetric parameters (CSA)[25]. In singleγ phase with the same strain rate and temperature, the dislocations were formed along the strain direction and scatter among the material. From the centrosymmetric pa-rameter picture, the papa-rameter P was greater than 8.3˚A2
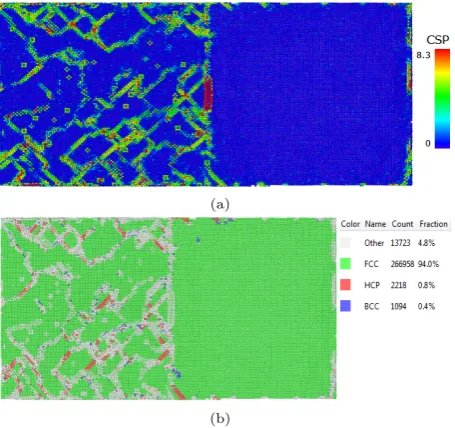
in an FCC lattice indicated an intrinsic stacking fault. The red particles in Fig. 5 a) shows the intrinsic stacking fault in pure single crystalline nickel generated along the [¯1 0 1] direction in (1 1 1) plane. From Fig. 5 b), CNA analysis in the case indicate the pure FCC structure was only 81.2%
(a)
(b)
Fig. 5 The CSP and CNA contour plot ofγphase pure nickel under fatigue load ratio (min load/max load)=0 after 40ps.a) is CSP display ofγphase pure nickel in which dislocation loop and dislocation slip along [¯1 0 1] direction. b) is CNA display of
γphase pure nickel which shows the FCC structure is 81.2%
(a)
(b)
Fig. 6 The CSP and CNA contour plot ofγ/γ0phase under
fatigue load ratio=0 after 40ps. a) is CSP display ofγphase in which dislocation pile-up occurs and dislocation slip along [¯101] direction. but few dislocation inγ0 phaseb) is CNA display of
γandγ0phase which shows the FCC structure is 92.7%
[image:5.595.318.545.73.286.2] [image:5.595.317.545.347.565.2]Fig. 7 dislocation slip in (4 3 2) and (1 1 1) plane which penetrate the grain inγphase and nucleated in the boundary
ofγ/γ0phase
(a)
(b)
Fig. 8 Diagram of energy and mean stress in different case
along the y direction inγphase. And coupled with the CNA in Fig. 6 b), the atoms which was not belong to FCC struc-ture were nearly 7.3% in the whole system that demonstrate the dislocation volume. At the same time, some dislocation-s propagate and penetrate into the body by the dislocation-slip in the plane (4 3 2) and (1 1 1). It was notable that, partial dislo-cations nucleated in the boundary ofγ andγ0 phase which demonstrated a clear view of the phase discrimination (Fig. 7).
(a)
(b)
Fig. 9 The CSP and CNA contour plot ofγ/γ0phase under
fatigue load ratio=0 along [1 0 0] directions after 40ps. a) is CSP display ofγ/γ0phase in which dislocation slip along
45 deg directions. But few dislocation inγ0phaseb) is CNA
display ofγ/γ0 phase which shows the FCC structure is 94.1%
4.2
The effect of orientation
From the atomic scale’s point of view, the microstuc-ture of metal is anisotropy and the elastic moduli is no-tably depending on the relation of grain or lattice orien-tation to the testing direction. The lattice orienorien-tation is one of the three significant microstructure variables (others two are grain size and shape).All experiments[27, 28] and simulations[29, 30] indicates that mechanical properties of metal, especially of the fracture behaviour, related to the crystal orientation. That’s because of slip systems of crystal lattice is orientation related.
In FCC structure, there are 12 slip systems which are composed by 4 primary slip planes of {1 1 1} associated with 3 different directions of<1 ¯1 0>. For the symmetry of FCC crystal structure, we only considered the primary slip plane (1 1 1) with direction [¯1 0 1] which used in the benchmark test case. It’s notable that the dislocation s-lipped and accumulated along the [¯1 0 1] direction in the
[image:6.595.318.546.74.288.2] [image:6.595.89.250.239.610.2]center. Once the dislocation slips crossed each other in the body, the intrinsic stacking fault was formed with the cyclic load increased. By comparing the stress (Fig. 8) in the test cases, it seemed that even in the test case with dislocation volume fraction was similar with that in benchmark test case, the mean stress with the same strain was much low-er than that in benchmark since thlow-ere was few dislocations pile-up with the cyclic load applied. Also in the benchmark test case, because of the load applied was perpendicular to the plane of (1 1 1) which was the closest package plane in FCC structure and caused strain along [¯1 0 1] direction, then greater magnitude of stress was needed to generate the same strain[31].
4.3
Temperature effect
Temperature has a critical effect on superalloys in vari-ous aspects. As known in crystal solid, the atoms vibrate around their equilibrium positions. When the temperature increased, the vibration amplitude increases while frequen-cy changes minor. Thus, the average interatomic distance and lattice parameters increase according to elevated tem-perature. This means the temperature will affect the nanos-tructure of the material. Besides, the distribution of atoms is different against different temperature level. The differ-ence of atoms distribution will cause the different lattice structure formatted. Consider the Ni-base alloy, with tem-perature increase, the strengthen phase of γ0 will slightly decreased from the maximum volume of fraction. What-s more, the vacancieWhat-s formation and diWhat-slocation motion in metal will be affected by temperature. For example, in BCC metals the dominant slip plane is along{2 1 1}when tem-perature below a quarter of melting point {3 2 1}, while along when temperature is above previous one but below half of melting point. Definitely, this will change the defor-mation behavior of superalloys at elevated temperature.
High temperature fatigue always accompanies with creep behavior which caused by oxidization in the material sur-face. But, in this simulation, it only reflected the mate-rial subsurface microstructure changing. So the oxidiza-tion behavior was not included in this research scope. In this group test cases, with temperature increasing, thermal activation enhanced dislocations motivation, consequently, the dislocations became more homogeneous and dislocation density increased sharply. This could be shown in the last group test cases simulated under the elevated temperature at 600K and 900K separately (Fig. 10, 11).
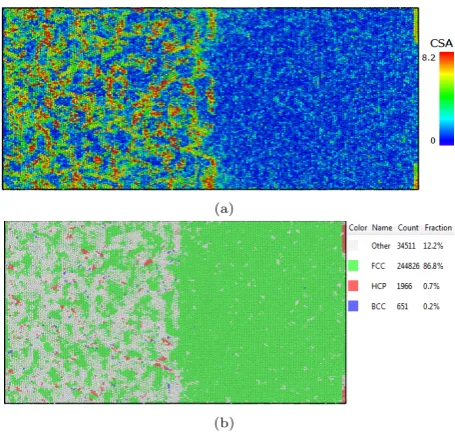
With the temperature increasing, the system became more unstable by the mean stress decreased because of sys-tem energy increased dramatically as Fig. 8 a) shows. And also some defects ofγ0 phase which were scattered also ob-served in these case but not at room temperature. It was notable that, the dislocations and defects in γ phase tend to pile up in the boundary ofγ/γ0phase. Since the bonding energy decreases in high temperature which leads to atoms oscillating at a higher frequency and speed up, microstruc-ture distortion became easier than that in room tempera-ture. But at this situation, the intrinsic stacking fault was hard to form since the recovery mechanisms ofγ/γ0at very high temperature. From the CSA and CNA graphic (Fig. 11) at 900K, we found the number of crystalline defects had
(a)
[image:7.595.317.545.73.288.2](b)
Fig. 10 The CSP and CNA contour plot ofγ/γ0phase under
fatigue load ratio=0 during temperature 600Ka) is CSP display ofγ/γ0phaseb) is CNA display ofγ/γ0phase which
shows the FCC structure is 91.6%
(a)
(b)
Fig. 11 The CSP and CNA contour plot ofγ/γ0phase under
fatigue load ratio=0 during temperature 900Ka) is CSP display ofγ/γ0phaseb) is CNA display ofγ/γ0phase which
shows the FCC structure is 86.8%
[image:7.595.316.544.362.578.2]Fig. 12 Our simulation results have good agreement with the experiment results in [27], which indicated slip band density as
a function of temperature for Nimonic 80A tested at a plastic strain range of 0.15%.
5
Discussion
By comparing the microstructure statistic chart(Fig. 13), it was evident that the volume fraction of perfect FCC lattice particles in benchmark and test case 2 were much greater than that of other test cases. This meant that the material which with the precipitated second phase strength-ening will withstand less distortion under the load which perpendicular to primary slip plane in room temperature against other cases. While in test case 1, the volume frac-tion of FCC perfect lattice percentage is the lowest among all tests which indicated that the γ0 phase was the most important strengthen phase in Nickel alloys. It increased the fatigue resistance of Nickel alloys significantly. The da-ta of test case 2 indicated that the orienda-tation of external load was an important factor but had less effect against the material composition. The temperature’s effect was no-table also but not as strong as compared to the effect of precipitated second phase.
The reason caused that behaviour of superalloys in these simulations was stated below:
a), The microstructure of superalloys is considerable on the present ofγ0 phase which is a precipitated strengthen phase in Nickel superalloys, the misfit of the lattice struc-ture between theγ/γ0phase boundary increased the phase energy and play the role of stability in the alloying sys-tem. Also, the ordered of N i3Al structure contribute to the high performance of Nickel superalloys by considering the significant degree of directional and covalent bonding between Ni and Al atoms. From the EAM potential which applied in this study as shown in Fig. 14, the Ni-Al bond energy is much lower than the pure Ni-Ni or Al-Al system. Since Gibbs free energy is directly proportional to the atom-ic bonding energy, theγ0phase free energy is less than pure Ni-Ni or Al-Al system. As a result, theγ0 is the stabilized phase in Nickel superalloys.
b), The orientation of external load is a stimulate of the slip system in the alloy system. With the different
[image:8.595.351.514.80.258.2]Fig. 13 The statistic plot of volume fraction of different microstructure particles according to different test cases
Fig. 14 Bond energy of the EAM potential presented in the effective pair format. courtesy of [13]
orientation, the number of active primary slip plane is dif-ferent thus result in the mechanical properties changes in the atomic level. In the benchmark test case, there are 2 active slip systems in the plane of (¯1 1 1) along the t-wo different directions according to the external loading. While in the test case 2, there are more than 4 active s-lip systems which were activated in all primary ss-lip planes in theγ phase since the external loading direction was not perpendicular to them but with angles. Finally, disloca-tion activities presented on all these slip planes and crossed each other, partially, rectangle dislocation loop evolved once them can’t cross each other.
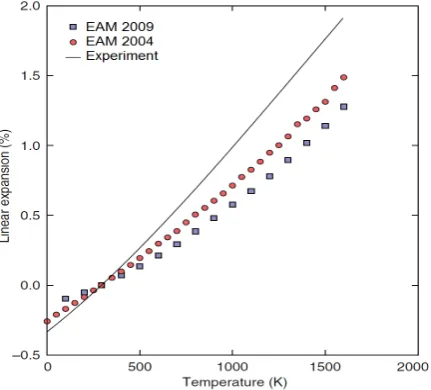
[image:8.595.318.537.314.507.2]Fig. 15 Linear thermal expansion (%) ofN i3Alrelative to room temperature (293 K) computed with the new EAM potential in comparison with the EAM-2004 potential[28]and
experimental data[29]. Courtesy of [13]
c), Atoms diffusion activity increased according to the elevated temperature and the recrystallization of grain occurred. The linear thermal expansion data of N i3Al was shown in Fig. 14 and compared with another EAM potential which provided by Mishin[28] and experimental data[29]. Since the thermal expansion factors in this EAM potential was computed by Monte Carlo which not includ-ed the quantum effects that causinclud-ed discrepancies at low temperature[13], the expected result was less than the ex-perimental result. This would affect our simulation result in the stress and strain which expected greater than current. Despite this negative effect, our result at elevated temper-ature also was also considerable because it reflect the truth that the stress at high temperature decreased according to the strain increasing by comparing the stress and energy graph in Fig. 8. But the dislocation interaction such as slip, glide, jog, and climb et. al. were not notable in this simu-lation result. From the CNA collection data were shown in Fig. 13, it indicated that the pure FCC structure decreased yet which means that the lattice torsion behaviour was s-timulated by the temperature was much more considerable than the lattice orientation. If regarding the effect of theγ0
strengthen phase, the temperature’s effect was not so much critical to the material properties.
According to the discussion aforementioned, we can give conclusion in the following chapter.
6
Conclusion
From the MD simulation of Nickel alloy under different situations, our conclusions can be stated and it seems that the simulation results agreed with the experimental results: 1, γ0 phase is the strengthening phase in Nickel alloy. During all of the simulation MD case,γ0phase is under few deformation, the PSB ladder like dislocation mostly occur inγphase. Dislocations tend to pile-up and penetrate into
[image:9.595.62.278.77.272.2]γ phase which contribute to the fatigue crack initiation in Nickel alloy.
Fig. 16 Unit PSB formation by repeated boundary condition
2, Dislocation slip is the main activity during PSB for-mation. The dislocation slip behavior is observed in all test cases. This slip activity is more related to the temperature which cause system bond energy decrease. Once intrinsic stacking fault is formed in a material, dislocations tend to pile up in the close package plane in low temperature. With temperature increased, the dislocation has difficult to pin up because of the recovery mechanisms.
3, A different orientation have the different result of cyclic loading response. Simulation results indicate if the load is perpendicular to close package plane, dislocations will pile up and restrict the dislocation motivation and then enhance the fatigue resistance of the material.
Because of spatial and temporal limitation of MD simu-lation, it is difficult to simulate the whole PSBs formation mechanism in tiny atomic structure, but with the periodic boundary condition, we have repeated the simulation and it indicates the ladder like structure is formed during fa-tigue load as on Fig. 15. Our future work will concentrate on the simulation of fatigue crack initiation within multi-crystalline nickel-base alloy and compare with the experi-mental investigation.
7
Future work
de-cision process with a state-of-the-art computational intelli-gence aided design(CIAD)[34]framework will be deployed in the prototype simulation system. Finally, the fatigue exper-iment with the fatigue crack initiation detection by jointed acoustic emission method and scanning electron microscopy will be finished in the future to validate our simulations re-sult.
Acknowledgement
The authors would like to acknowledge the scholarship award to the first author provided by the SCHOOL OF ENGINEERING AND BUILT ENVIRONMENT, GLAS-GOW CALENDONIAN UNIVERSITY. And this work was also partially supported by National Natural Science Foundation of China (Grant No. 51405044, 51105061 and 11472075). Finally, partial results were obtained us-ing the EPSRC funded ARCHIE-WeSt High Performance Computer (www.archie-west.ac.uk). EPSRC grant no. EP/K000586/1. The author thanks the support provided by UNIVERSITY OF STRATHCLYDE.
References
[1] N.J. Wadsworth, N. ThompsonObservations on the fatigue fracture of copper, The London, Edinburgh, and Dublin Philosophical Magazine and Journal of Science: Series 7, vol. 45, issue 361, pp. 223-224, 1954.
[2] J. Huang, Z. Wang, Y. Luo, Y. Li, E. Yang and Y. Chen, Computational investigation of superalloy persistent slip bands formation, Automation and Computing (ICAC), 21st International Conference on, Glasgow, 2015, pp. 1-6. doi: 10.1109/IConAC.2015.7313999
[3] R. J. Atkinson, W. J. Winkworth and G. M. Norris, Be-haviour of Skin Fatigue Cracks at the Corners of Windows in a Comet I FuselageNo. 3248, HER MAJESTY’S STA-TIONERY OFFICE, London, Jan, 1962. (Report) [4] I, Milne, R.O. Ritchie, B. KarihalooComprehensive
Struc-ture Integrity, 4.01 Cyclic Deformation, Crack Initiation, and Low-Cycle Fatigue, vol. 4. Elsevier. pp. 7.(Book style) [5] S. X. Li, Y Li, G. Y Li, J. H. Yang, Z. G. Wang and K. Lu The early stages of fatigue and evolution of persistent slip bands in a copper single crystal, Phil. Mag. A vol. 82, issue 5, pp. 867-883, 2002.
[6] A.T. Winter,A model for the fatigue of copper at low plas-tic strain amplitudes, Phil. Mag, vol. 30, issue 4, pp. 719-738, 1974.
[7] C. Buque.Persistent slip bands in cyclically deformed nickel polycrystals, International Journal of Fatigue, vol. 23, issue 6, pp. 459-466, July 2001.
[8] P. Luk´aˇs, L. Kunz,Role of persistent slip band in fatigue, Phil. Mag. vol. 84, issue 3-5, pp. 317-330, 2004.
[9] D. Walgraef and E.C. Aifantis,On the formation and sta-bility of dislocation patterns-III: Three-dimensional consid-erations, International Journal of Engineering Science, vol. 23, issue 12, pp. 1365-1372, 1985.
[10] M.V. Glazov and C. Laird,Size effects of dislocation pat-terning in fatigued metalsActa Meta. et Mat., vol. 43, issue 7, pp. 2849-2857, July 1995.
[11] Ercolessi F.A molecular dynamics primer[J]. Spring college in computational physics, ICTP, Trieste, June, 1997. (Book style)
[12] Y. Mishin, Interatomic Potentials for Metals, Handbook of Materials Modeling, Berlin, Springer., Chapter 2.2, p-p. 459-478, 2005. (Book style)
[13] G.P. Purja Puna and Y. MishinDevelopment of an inter-atomic potential for the Ni-Al system, Phil. Mag., vol. 89, issue 34-36, pp. 3245-3267, 2009.
[14] M.H. Musazadeh, K. DehghaniMolecular dynamic simula-tion of crack propagasimula-tion in nanocrystalline Ni containing different shapes and types of second phases, Computational Materials Science, vol. 50, issue 11, pp. 3075-3079, Oct.-Nov. 2011.
[15] Y. Mishin, D. Farkas, M.J. Mehl, D.A. Papaconstantopou-los,Interatomic potentials for monoatomic metals from ex-perimental data and ab initio calculations. Phys Rev B. vol. 59, issue 5, pp. 3393-3407, Feb. 1999.
[16] X.Y. Liu, F. Ercolessi, J. Adams Aluminium interatomic potential from density functional theory calculations with improved stacking fault energy, Model. Simul. Mater. Sci. Eng. vol. 12, pp. 665-670, 2004.
[17] H.W. Sheng, M.J. Kramer, A. Cadien, T. Fujita, M.W. Chen,Highly optimized embedded-atom-method potential-s for fourteen fcc metalpotential-s, Phys. Rev. B, vol. 83, issue 13, pp. 134118, Apr. 2011.
[18] Paul White,Molecular dynamic modelling of fatigue crack growth in aluminium using LEFM boundary conditions, In-ternational Journal of Fatigue, vol. 44, pp. 141-150, Nov. 2012.
[19] Po-Hsien Sung, Tei-Chen ChenStudies of crack growth and propagation of single-crystal nickel by molecular dynamic-s, Computational Materials Science, vol. 102, pp. 151-158, May, 2015.
[20] Kai Zhou, Bin Liu, Yijun Yao, and Kun ZhongEffects of grain size and shape on mechanical properties of nanocrys-talline copper investigated by molecular dynamics, Materi-als Science and Engineering: A, vol. 615, pp. 92-97, 6 Oct., 2014.
[21] M. Wen, X.J. Xu, Y. Omura, S. Fukuyama, K. Yokogawa Modeling of hydrogen embrittlement in single crystal Ni, Computational Materials Science, vol. 30, issue 3-4, pp. 202-211, Aug., 2004.
[22] S. Boucetta, T. Chihi, B. Ghebouli, M. Fatmi, First-principles study of the elastic and mechanical properties of
N i3Alunder high pressure, Materials Science-Poland, vol. 28, No. 1, pp. 347-355, 2010.
[23] G. Brunetti, et. al.Determination of γ−γ0 lattice misfit
in a single-crystal nickel-based superalloy using convergent beam electron diffraction aided by finite element calcula-tions, Micron, vol. 43, issue 2-3, pp. 396-406, Feb., 2012. [24] A.S. Argon, PRECIPITATION STRENGTHENING, In
Strengthening Mechanisms in Crystal Plasticity, by A.S. Argon, Oxford: Oxford University Press, 2007. Oxford Scholarship Online, 2007.
[25] Alexander Stukowski,Structure identification methods for atomistic simulations of crystalline materials, Modelling Simul. Mater. Sci. Eng., vol. 20, issue 4, pp. 45021, 2012. [26] Helio Tsuzuki, Paulo S. Branicio, Jose P. Rino,Structural
characterization of deformed crystals by analysis of common atomic neighborhood, Computer Physics Communications, vol. 177, issue 6, pp. 518-523, 15 Sep., 2007.
[27] Andre Pineau, Stephen D. Antolovich, High temperature fatigue of nickel-base superalloys A review with special emphasis on deformation modes and oxidation, Engineer-ing Failure Analysis, vol. 16, pp. 2668-2697, 2009. [28] Y. Mishin,Atomistic modeling of theγandγ0-phases of the
NiAl system, Acta Mater. vol. 52, issue 6, pp. 1451-1467, 2004.
[31] Mikael Segers¨all, Daniel Leidermark, Johan J. Moverare, Influence of crystal orientation on the thermomechanical fatigue behaviour in a single-crystal superalloy, Material-s Science & Engineering A, vol. 623, pp. 68-77, 19 Jan., 2015.
[32] Y. Chen, G.F. Zhang, T.D. Jin, S.M. Wu, B. Peng, Quanti-tative modelling of electricity consumption using computa-tional intelligence aided design, J. Clean. Prod. vol. 69 pp. 143-152, 2014.
[33] P. Beardmore, R. G. Davies, T. L. Johnston,On the tem-perature dependence of the flow stress of nickel-base alloys, Transactions of the Metallurgical Society of AIME, vol. 245, pp. 15371545, 1969.
[34] Y. Chen, B. Peng, Multi-objective optimization on multi-layer configuration of cathode electrode for polymer elec-trolyte fuel cells via computational-intelligence-aided de-sign and engineering framework, Applied Soft Computing, In Press, Accepted Manuscript, Available online 27 Feb., 2016, DOI: 10.1016/j.asoc.2016.02.045.
Jianfeng Huang who born in China, 1978, now is a doctoral student of School of Engineering and Built Environment, Glas-gow Caledonian University(GCU), GlasGlas-gow, Scotland, United Kingdom. His research subject is Computational Intelligence Based
Optimal Design of Superalloys. he acquired his Master degree of Material Processing and Engineering in 2004 from School of Materi-al Engineering, Huazhong University of Sci-ence and Technology(HUST), Wuhan, China and the Bachelor degree of Mechanical Engineering in 2000 from Xiangtan Univer-sity, Xiangtan, China. Before the study in Glasgow Caledonian University, he riched his working experience in CAD/CAE/CAM software development, especially in the pre-processing and post-processing of dynamic simulation and FEM, in Siemens PLM Software from 2004 to 2014 as a senior software engineer.
During his study in HUST, he worked with staffs in State Key Laboratory of Material Processing and Die & Mould Technology. He researched the key theory of the strip layout of progressive die and focused on the knowledge engineering application in the pro-cess of progressive die and proposed the hybrid knowledge resentation method which integrates rule-based knowledge rep-resentation and case-based knowledge reprep-resentation. He pub-lished a paper on the journal: Research on the Expression Meth-ods of the Stamping Process Knowledge Based on KBE, Die & Mould Industry, Vol 7, 2004.
Mr. Huang is a GCU scholarship recipient which covers his home tuitions for his PhD studies. And also he is a part of the Marie Skodowska-Curie Actions in Horizon 2020, Research and Innovation Staff Exchange (RISE) team.


![Fig. 14Bond energy of the EAM potential presented in theeffective pair format. courtesy of [13]](https://thumb-us.123doks.com/thumbv2/123dok_us/1459914.98673/8.595.351.514.80.258/fig-bond-energy-potential-presented-theeective-format-courtesy.webp)