University of Southern Queensland Faculty of Engineering & Surveying
Unmanned Aerial Vehicle Static
Object Detection
A dissertation submitted by
James Timings
In fulfilment of the requirements of
ENG4112 Research Project
Towards the degree of
Bachelor of Engineering (Electrical)
Abstract
The Outback Challenge competition held in Kingaroy each year is used to test commercial and private teams to come up with an Unmanned Aerial Vehicle capable of
This dissertation aims to outline the development and implementation of a vision processing system capable of finding a lost bushwalker using the colour of his clothes.
Unmanned Aerial Vehicles have long been in the realm of big business and government organisations. Their cost, limited ability, and fragility have kept their use from becoming mainstream. However, all that is set to change now that UAVs are becoming cheap and robust. A fully autonomous fixed wing aircraft, with a flight time of over an hour, can be had for as little as $300.
As the technology of unmanned aerial vehicles (UAVs) becomes more commonplace, finding functions for them to perform becomes the realm of the engineer. As of now, UAVs are not widely used in civilian life and are therefore an exciting field to use as a base for a research project.
Due to the popularity of smartphones, the cost of digital cameras and small powerful
computers is rapidly decreasing. As a result computer vision is another exciting field which is becoming more available to the public. Features such as facial recognition and gesture control are examples of implementations of computer vision in modern smart phones.
University of Southern Queensland
Faculty of Health, Engineering and Sciences
ENG4111/ENG4112 Research Project
Limitations of Use
The Council of the University of Southern Queensland, its Faculty of Health,
Engineering & Sciences, and the staff of the University of Southern Queensland, do
not accept any responsibility for the truth, accuracy or completeness of material
contained within or associated with this dissertation.
Persons using all or any part of this material do so at their own risk, and not at the risk
of the Council of the University of Southern Queensland, its Faculty of Health,
Engineering & Sciences or the sta
ff
of the University of Southern Queensland.
Certification of Dissertation
I certify that the ideas, designs and experimental work, results, analyses and conclusions set out in this dissertation are entirely my own effort, except where otherwise indicated and acknowledged.
I further certify that the work is original and has not been previously submitted for assessment in any other course or institution, except where specifically stated.
Jim Timings
0050050174
___________________________ Signature
Acknowledgements
I would like to include a brief message of thanks to the following people, without whom this project would not have been possible.
Dr Tobias Low
Mr Matthew Peacock
Mr Philip Timings
Contents
Contents ... 6
Chapter 1 – Background Information... 9
1.1 Introduction ... 9
1.2 Project Aim ... 9
1.3 Project Objective ... 10
1.4 Overview of Dissertation ... 10
Chapter 2 - Literature Review ... 12
2.1 Introduction ... 12
2.2 Outback Challenge Competition Objective ... 12
2.3 Image processing to find static objects ... 12
2.4 Context ... 14
Chapter 3 - Methodology ... 15
3.1 Chapter Overview ... 15
3.2 Task Analysis ... 15
3.2.1 Camera Stabilisation ... 16
3.2.2 Image Processing ... 17
3.2.3 Data Flow Controller... 17
3.2.4 Navigation... 19
3.2.5 Flight Control ... 19
3.2.6 Testing ... 20
3.2.6.1 Effectiveness of the Image Processing System ... 20
3.2.6.2 Camera Range... 20
3.2.6.3 Location Using Image ... 21
3.3 Resources ... 21
3.3.1 Development Hardware ... 21
3.3.2 Development Software... 21
3.3.3 Sustainability ... 22
3.3.4 Safety ... 22
3.3.5 Ethical Considerations ... 22
3.4 Risk Assessment ... 23
Chapter 4 - Results and Discussion ... 24
4.1 Chapter Overview ... 24
4.2 Image Processing Methodology ... 24
4.2.1 Taking a Photo ... 24
4.2.2 Colour Threshold ... 25
4.2.3 Blob Extraction ... 26
4.2.4 Obtaining Coordinates ... 29
4.3 System Configuration ... 34
4.3.1 UAV Software ... 34
4.3.2 UAV Hardware ... 36
4.3.3 Base Station Software ... 38
4.3.4 Base Station Hardware ... 39
4.4 System Performance ... 40
4.4.1 Processing Speed and Code Efficiency ... 40
4.4.1.1 Code Efficiency ... 41
4.4.1.2 Processing Speed ... 41
4.4.2 Bushwalker Identification ... 41
4.4.2.1 Detection Rate ... 42
4.4.2.2 Different Terrain ... 43
4.5 Chapter Summary ... 43
Chapter 5 - Conclusion ... 44
5.1 Chapter Overview ... 44
5.2 Future Work ... 44
5.2.1 Efficiency and Processing Speed ... 44
5.2.2 Discrimination Techniques ... 45
5.3 Other Areas of Research ... 45
5.4 Summary ... 46
Chapter 6 - References ... 47
Appendix A – Project Specification... 49
Appendix B.1 – Project Timeline ... 50
Appendix B.2 – Risk Assessment ... 51
Chapter 1 – Background
Information
1.1 Introduction
As the technology of unmanned aerial vehicles (UAVs) becomes more commonplace, finding functions for them to perform becomes the realm of the engineer. As of now, UAVs are not widely used in civilian life and are therefore an exciting field to use as a base for a research project.
Due to the popularity of smartphones, the cost of digital cameras and small powerful
computers is rapidly decreasing. As a result computer vision is another exciting field which is becoming more available to the public. Features such as facial recognition and gesture control are examples of implementations of computer vision in modern smart phones.
Together, UAVs and computer vision allow us to create systems which are able to do the jobs that previously required manned vehicles to complete, thus increasing efficiency, speed and safety.
1.2 Project Aim
The primary aim of this project is to design, develop and implement a UAV that is capable of scanning a specified area to find a lost bushwalker using a vision system. The system will be given the bushwalker’s approximate area and the details of the bushwalker’s clothes prior to launch. Using these details the system will enter a search pattern over the area. Using a computer vision system, the computer will continuously take photos and scan them to find a match for the bushwalker. When the bushwalker has been located, the system will send data back to the base station indicating that the bushwalker has been found. The system should then command the UAV to descend to a lower height over the calculated location in order to take another photo to confirm the sighting. If the sighting is confirmed, the system will again signal the base station, and confirm the coordinates of the lost bushwalker.
The project aims to research existing image processing techniques that will allow the system to recognise the bushwalker based on the colour of clothing and approximate size. The system must be able to find the bushwalker in a range of different light conditions and environments. It will do this by applying filters to the photograph prior to analysis.
Conceivably, due to the low cost of the vehicle, several UAVs could be deployed to different areas in order to maximise the search area.
1.3 Project Objective
The objective of the project is to develop a system that consists of an RGB camera and computer module that can be added to a UAV. The RGB camera should be attached to a stabilized camera gimbal which is capable of constantly facing the camera at the ground. The system should be able to periodically take photos of the ground and then analyse the photo to recognise a specific object (in this case a lost bushwalker). The system will use a Raspberry Pi ARM based linux computer to complete the image analysis. Furthermore the system must have an interface that does not require significant technical knowledge to operate. The project must also have the following components:
Complete a literature review of current research in the area of UAV static obstacle detection.
Implement an RGB camera of sufficient resolution to adequately detect the bushwalker from an altitude of approximately 120m.
Use remote data link for relaying sensor data and controlling the UAV.
Integrate an existing control system for a hobby grade UAV for the purposes of developing object detection algorithms.
Graph, evaluate and verify the output of algorithms by running simulations.
Run controlled experiments to determine effectiveness of object detection such as:
o Return a found result when the UAV flies over an area with the bushwalker present.
o Return a not found result when the UAV flies over an area with no bushwalker present.
o Have two bushwalkers in proximity of each other and find each one separately.
1.4 Overview of Dissertation
This dissertation aims to look at existing state of the art systems which use vision processing to complete tasks which would otherwise be difficult or impossible for an unmanned machine to complete. It will do this by looking at existing research work which has already been completed and use this data to come up with the most accurate and efficient system possible. Furthermore the competition on which this project is based, the Outback
Challenge competition, will be explored in further detail to make sure the project is meeting the requirements set by the competition.
The next step of the dissertation will be to look into the results of the project by exploring the hardware, software and testing procedures used in the project. From here the results of the project will be examined to see if they satisfy the initial requirements defined early on.
Chapter 2 - Literature Review
2.1 Introduction
The field of object detection is one which has had much work completed on it over the years. Its use is very wide, from counting manufactured parts in a processing plant, to detecting human activity on surveillance cameras.
This chapter will look at the Outback Challenge competition which requires the entrants to launch an aircraft able to autonomously find a lost bushwalker using a vision system.
It will also visit existing methods of static image detection and their goals. Work which has been previously done in this area can be built upon or modified in order to achieve the best possible outcome for the project.
2.2 Outback Challenge Competition Objective
Outback Joe is lost in the Australian outback and desperately needs assistance. Teams must deploy a UAV to find him and deliver an emergency package via an air-drop.
The UAV system must be able to find Outback Joe in a predefined search area located in Kingaroy in Southern Queensland. The mission boundary is 2 x 3 nautical miles. The aircraft must comply with the following rules:
The UAV must not fly below 200 ft.
The UAV must not fly above 400 ft unless prior approval has been granted. The UAV is limited to a maximum altitude of 1500 ft AGL.
In the instance that the UAV flies outside the search area boundary, the UAV must automatically terminate its mission and crash into the ground.
The onboard system must be able to detect a human shaped dummy wearing a high visibility shirt, jeans, and an Akubra hat. Once the UAV system has detected Outback Joe, the team must provide the location to the judges. If 3 incorrect locations are provided to the judges then the aircraft must return to base.
If the correct location is given then the system is given the go-ahead to drop the bottle of water to Outback Joe. The bottle must contain at least 500mL of water and be able to be opened and measured by a scrutineer on the range.
Now that we have defined what the system needs to do: namely analyse an image to look for certain characteristics that the bushwalker has, we can research existing methods which have been used to discover the presence of a certain object within an image.
[image:13.595.135.462.214.488.2]Many object detection systems work by using a database of images which the system must use to identify the shape of the image (Malik, J. ; Puzicha, J.) and (Salve, S.G. ; Jondhale, K.C.). This system works by taking an image and using edge detection to find solid objects. Figure 2.3.1 shows a picture of a rabbit statue which has been processed using edge detection.
Figure 2.3.1 – Edge detection
As shown in the above example, the image has been processed to discover the object’s edge. Once this edge has been identified, the process can then use shape detection to match the shape of the rabbit to a database of images. If the rabbit matches one of the database images then it receives a positive match and the rabbit is identified.
Using this method requires significant system resources as the system must cycle through the database each time it analyses an image. Although this method would work well for the proposed detection system of this project, the limited computer processing power of the computer would limit its speed significantly. Furthermore, the shape of the bushwalker from the UAVs perspective could change significantly depending on the pose the bushwalker is in. For this instance the simpler method of blob size detection would work better and be more efficient on the processing time of the image.
power and is much less complicated than shape detection. However using this technique would only be useful in this scenario because we know accurately how far the object is away from the camera. Furthermore we have more than one blob to detect, so size and the proximity of another suitably sized blob are used to discriminate the results. So whilst this method would normally not be accurate to determine the presence of an object within an image, in this case is actually quite accurate because of other information that has been collected along with the image. Unfortunately no existing published research using this method has could be found so the method is based on shape detection methodology research.
2.4 Context
As evidenced by previous work (Torralba, A), the context of the scene is as important as the object we’re looking for. For example, if we are looking at something far away, we know that the object will appear smaller – we can use other objects in the environment to gauge the size of the object. This is relevant to object detection as the system must be able to not only recognise the object at one particular size, but at a size depending on how close it is to the viewer (in this case a camera).
It seems that little work has been previously completed on using a camera to gauge location in a photograph. This is most likely due to the fact that there is significant difference between cameras depending on lens and focal length of the camera. Therefore the workings of determining the location of the bushwalker using a photo will need to be implemented from scratch. Furthermore the camera will need to be calibrated to allow for accurate readings.
Chapter 3 - Methodology
3.1 Chapter Overview
Now that the project has a clearly defined outcome and research into previous systems has been explored, we can look at how to achieve the project deliverables. This chapter will look at the methodology of the project and what work will need to be undertaken to achieve the outcomes of the project.
3.2 Task Analysis
The methods for finding the bushwalker during flight are separated into two separate functions, namely image processing, and navigation. A flowchart showing the two functions is displayed below in figure 3.1.1:
Image processing is performed by a computer which is used to analyse photographs that are taken during flight. The process is as per figure 3.1.1 above. Two important techniques will be used to analyse each image taken during the flight of the UAV: a Threshold Colour Filter, and Blob Extraction algorithm. Each photo will be scanned using a threshold colour filter to find the colour of the shirt and pants of the bushwalker. If no instances of the colours are found then the image is discarded and a new photo is taken. If an instance of both is found then the image is passed to the blob detection filter to find the size of the blobs contained in the photo.
Knowing the altitude of the craft at the time, the algorithm will be able to estimate an approximate size of the bushwalker’s shirt and pants in the image. If it detects a blob that’s within the tolerance of the size of the shirt, and also a blob that’s within tolerance of the pants, and the two blobs are close together, then a match is identified.
The image is further analysed to determine the location of the blob with respect to the UAV.
3.2.1 Camera Stabilisation
Although camera stabilization is a relatively simple task for the UAV, it is important to be tuned properly in order to maximise accuracy of the bushwalker detection system. The camera must always be facing directly downwards, otherwise detection of the location of the bushwalker could be skewed. Furthermore, if the stabilisation system does not adequately balance out the movement of the UAV whilst it is in flight, then there’s the chance for the photos to become blurry which would cause the vision processing to produce erroneous results.
The existing system plugs directly into the control board of the UAV. The control board has built in functionality for a camera gimbal using PWM outputs to servos.
Figure 3.3.1.1 – Camera Stabilisation Gimbal
3.2.2 Image Processing
The RGB (Red Green Blue) colour model is a method of creating a colour using different values of intensity of red, green and blue light. Using this method of light mixing allows the creation of every light colour in the visible light spectrum. Computers use digital values of RGB in order to store and display colour information for each pixel on a computer monitor. A standard pixel on a PC display is made up of 3 bytes of data, with each byte representing the value of intensity of red, green and blue light. This means that each pixel is capable of displaying 16.7 million unique colours.
[image:17.595.90.491.382.534.2]Using this knowledge the image can be analysed to detect certain colours. For example, to find the bushwalker’s yellow shirt, first of all we must determine what yellow is using RGB. Pure yellow is Red: 255, Green: 255, and Blue: 0. Therefore, using a value of anything greater than 250, 250, 0, we can inspect each pixel to see if it meets these requirements. Any pixel colour value that does meet the requirement is given a 1, and a value that does not meet the requirement is given a 0. This way we end up with a binary image showing yellow sections as high. An example of the process is shown in figure 7.1.1:
Figure 7.1.1 – A before and after picture where the colour threshold filter has been applied
From the colour threshold filter we now have two binary images with yellow and blue sections displayed. Using a method of image processing known as blob extraction, the image can by analysed to find ‘blobs’, i.e. areas in which a cluster of pixels are joined together. Using this method allows the image to be scanned to find regions of interest in the image.
Using a two pass method, the algorithm goes through the image pixel by pixel to discover whether it is connected to other pixels or not. A blob is identified by a unique number. When a group of pixels is identified as a blob, the program is able to count the number of pixels and use this value to check whether the blob is the bushwalker or not.
To minimise weight, energy consumption and RF interference, only one telemetry system will be used for all communication between the base station and the UAV. Specifically this will be a 100mW 915MHz telemetry system based on the Zigbee protocol.
[image:18.595.158.438.195.505.2]In order to allow the Vision Processing Unit (VPU), Flight Control Board (FCB) and Base Station to communicate using a single serial line, a Data Flow Controller (DFC) system was developed to facilitate changing the direction of data flow between devices. Figure 3.3.3.1 shows the configuration of the data flow controller.
Figure 3.3.3.1 – Data Flow Controller connected to Vision Processing Unit, Wireless Telemetry Module and Control Board.
The system is controlled by the VPU using digital IO lines to determine the data flow required. For the majority of the time the system will be set to communicate between the control board and base station. This allows the base station to get information back from the FCB to allow the user to see the status of the aircraft.
In the instance that the VPU has identified and located the bushwalker, the DFC will switch flow from the VPU to the base station to allow a notification of the location to be
transmitted to the base station. Additional filtering of the signal is required on the base station using software.
3.2.4 Navigation
If the program identifies the bushwalker within the image, the next step is to use the image to find the coordinates of the bushwalker. In order to get an accurate coordinate using the image alone, the program must have the following data:
The coordinates of the UAV when the photo was taken The heading of the UAV
The altitude of the UAV; and The lens shape
Using this data, the program can estimate where the bushwalker is in the photograph. Additional experimentation and calibration of the camera must be completed to gain accuracy of this calculated value. This is discussed further below in the chapter 4.
3.2.5 Flight Control
The UAV will be flown autonomously using a 3D Robotics APM Universal Autopilot board. This board allows the autonomous control of virtually any vehicle including multicopters, helicopters, boats, cars and, as in this case, fixed wing aircraft.
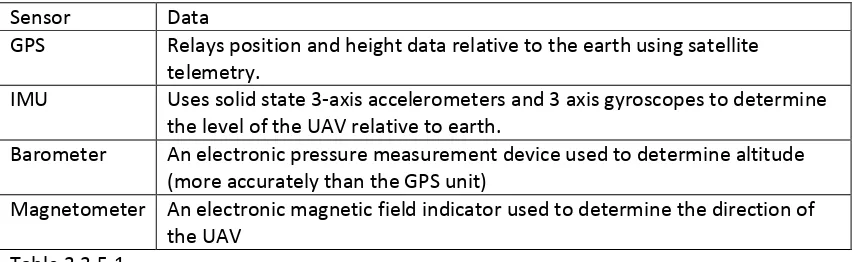
It uses Global Position System (GPS), Inertial Measurement Unit (IMU), barometer, and magnetometer inputs in order to control the flight of the vehicle. All data is processed using an Atmel 8 bit microprocessor (MPU). Table 3.3.5.1 shows the sensor-type and type of data which it provides to the MPU.
Sensor Data
GPS Relays position and height data relative to the earth using satellite telemetry.
IMU Uses solid state 3-axis accelerometers and 3 axis gyroscopes to determine the level of the UAV relative to earth.
Barometer An electronic pressure measurement device used to determine altitude (more accurately than the GPS unit)
[image:19.595.85.512.559.690.2]Magnetometer An electronic magnetic field indicator used to determine the direction of the UAV
Table 3.3.5.1
Due to the open source software on which the board runs, the internal code is publically available and can be edited in order to suit different applications. It’s this flexibility that makes it the best choice for the project. The board software can be edited to enable the output of location, height and heading values to the raspberry pi unit via a hardware serial port on the MPU. It is also able to receive data from the raspberry pi allowing the raspberry pi to give the board new waypoints to navigate to.
3.2.6 Testing
Significant testing was required to gain data for the project such as:
The effectiveness of the image processing system. The camera range.
Ability to determine location using an image.
Communication between the vision processing system and the flight control board.
These are further discussed in chapter 4.
3.2.6.1 Effectiveness of the Image Processing System
In order to determine the effectiveness of the vision system, a large range of experimental photos were taken in different light conditions in order to validate the system’s ability to detect the bushwalker. This tested the camera to find whether the colour detection system remained reliable in different weather conditions, and at different times of the day. Once this data was collected, the system can be calibrated depending on what sort of weather conditions, and what time of day it is.
3.2.6.2 Camera Range
The camera being used in the aircraft must be lightweight, but also have the ability to capture sufficient detail so that the bushwalker can be detected from altitude. However, the camera will have a limit at which the distance is too great to be able to adequately
3.2.6.3 Location Using Image
Once the vision system has determined that an image contains the bushwalker, it must then use the image to determine the location of the bushwalker relative to itself. To gain test data for this, several location markers should be positioned on the field, and then the aircraft should be flown over to take photos, also recording the altitude, heading and location of the aircraft while the photos are being taken. Using the data, an algorithm can be developed which can calculate a location of an object from the image.
3.3 Resources
[image:21.595.91.512.339.529.2]3.3.1 Development Hardware
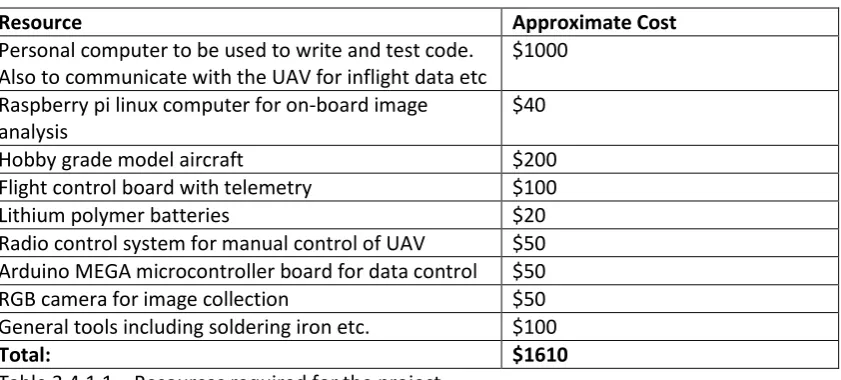
Table 3.4.1.1 shows a list of resources required in order to successfully realise the project goals:
Resource Approximate Cost
Personal computer to be used to write and test code. Also to communicate with the UAV for inflight data etc
$1000
Raspberry pi linux computer for on-board image analysis
$40
Hobby grade model aircraft $200
Flight control board with telemetry $100
Lithium polymer batteries $20
Radio control system for manual control of UAV $50 Arduino MEGA microcontroller board for data control $50
RGB camera for image collection $50
General tools including soldering iron etc. $100
Total: $1610
Table 3.4.1.1 – Resources required for the project
Although the cost may seem quite significant, items such as the PC and general hardware have all been purchased previously and therefore add no cost to the project.
All items that needed to be purchased were readily available and were delivered within 2 weeks or less. More details on the hardware used in the project can be seen in chapter 4.
3.3.2 Development Software
Other software used includes:
Software Use
Debian A Linux based operating system which has been compiled to run on the Raspberry Pi’s ARM processor.
system. All software run on the Raspberry Pi Vision Processing Unit was compiled using GCC.
Mission Planner
Open source software developed to interface with the ardupilot flight control board. Mission Planner has the ability to translate telemetry data from the aircraft, as well as upload waypoints and control values to the board.
AutoCAD Used to draw diagrams and models to aid in design.
Python Programming language used to translate incoming messages from vision detection unit. Also used for colour detection software used to find colour threshold values.
3.3.3 Sustainability
Consideration must be given to the sustainability of the project, especially the parts of the UAV that are built from non-renewable resources. Some examples of non-renewables that were used in the UAV are:
- Lead based solder
- Lithium polymer batteries - Non sustainable energy supplies
Any items used in the project that are not considered to be of a non-renewable nature were used sparingly and handled and disposed of in the correct manner.
3.3.4 Safety
All equipment used in the project complies with relevant Australian safety standards. All potential risks were identified prior to implementation into the UAV. The result of the risk assessment can be seen in section 3.6 below.
During testing of the UAV, all CASA regulations and laws pertaining to the use of UAVs were strictly adhered to.
3.3.5 Ethical Considerations
To comply with ethical considerations of any works completed in the project, it is important that due diligence in the testing and operation of the UAV was maintained.
3.4 Risk Assessment
During the course of the project there is a risk that some activities may pose a potential hazard. In order to minimise the risk of an accident causing harm to people or property the activities must be identified so that control measures can be put in place. A full risk
assessment has been conducted for the project and can be seen in Appendix A.
3.5 Chapter Summary
Chapter 4 - Results and
Discussion
4.1 Chapter Overview
The purpose of this chapter is to explore the techniques used and the results that were discovered as part of the project. Each component of the system is explained separately and then tested to evaluate its performance.
Two clear metrics for performance can be identified to ascertain the success of the vision processing system to meet its aims:
Can the system adequately identify the bushwalker.
Is the processing time of the identification algorithm completed in sufficient time to match the speed of the UAV airframe.
These items will be addressed in this chapter.
4.2 Image Processing Methodology
As discussed in chapter 3, there are two main components to the vision processing system which must be implemented in order to function, these are the colour threshold filter and blob extraction algorithm. All functions are completed by the Raspberry Pi computer, and are coded in c++ language using leafpad text editor and cmake c++ compiler. The software is compiled to an executable file which is accessed after the computer has booted into its operating system. The software is designed to work autonomously; so that apart from turning the UAV on at the field, no further input should be required. The complete vision processing code can be viewed in Appendix C.
4.2.1 Taking a Photo
4.2.2 Colour Threshold
The colour threshold technique used in the vision processing system involves analysing the values of each pixel to discover whether it falls into the desired range required to identify the clothing of the lost bushwalker.
In order to correctly identify the range of colours that the colour threshold filter should search for, images of the bushwalker are entered into software to analyse the image. The image must have all background data removed manually prior to it being analysed by the software. Figure 4.2.1.1 shows the image after all background data has been deleted ready for analysis.
[image:25.595.92.472.265.413.2]
Figure 4.2.1.1 – Background data removed
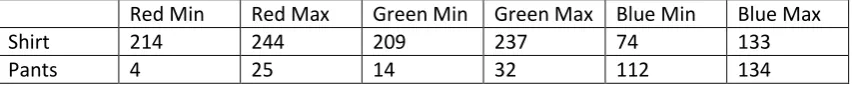
The image analysis software runs in Python, and scans each pixel to find the highest and lowest values of the colours within the image. In order to successfully identify colour ranges for the shirt and pants separately, the image must be broken up into two images, one containing only the shirt and one containing only the pants. Test photos taken in different light conditions are analysed with the software to obtain the full range of colour values to scan during flight.
Once these values have been obtained, they are able to be entered into the vision
processing algorithm. The image shown in figure 4.2.1.1 has been analysed and its values shown in table 4.2.1.1 below.
Red Min Red Max Green Min Green Max Blue Min Blue Max
Shirt 214 244 209 237 74 133
[image:25.595.86.513.605.648.2]Pants 4 25 14 32 112 134
Table 4.2.1.1 – Example colour range found during software analysis.
Figure 4.2.1.2 – Resultant 2d Binary Arrays, pants on the left and shirt on the right.
These arrays will be passed to the Blob Extraction algorithm.
4.2.3 Blob Extraction
Blob extraction (or Connected-component labelling) is a method of labelling pixels that have matching properties and are adjacent to each other. By doing this we can identify the size and location of a blob within a picture.
There are two methods of blob extraction – single and double pass. The method used for the vision processing system is double pass. This may seem like a less efficient system, but in this instance there is actually significant processor saving to be had by using the double pass method.
Integral to this system is that we filter blob results for a certain range of blob sizes. In order to do this, the aircraft was flown over the bushwalker at different altitudes in order to record photographs over a range of altitudes to develop an algorithm that can predict the required blob size based on the aircraft altitude. Table 4.2.2.1 shows size vs altitude of the photographs.
Altitude (meters above ground level)
95 102 122 154
Shirt Pixel Count 224 207 102 70
Table 4.2.2.1 – Altitude vs Shirt Pixel Count
[image:26.595.88.513.567.708.2]Figure 4.2.2.1 – Altitude vs Number of Pixels
Now the system can predict the range of pixel count values it is looking for depending on its altitude. It should be noted that at this stage the vision processing system can only
determine its distance above ground using altitude; therefore it is assumed that the area that is being flown is flat. In order for the system to remain reliable over areas which are not flat, the system must contain height datum data which the system can use to calculate its distance from the ground using altitude data. This is outside the scope of works for this project, but is an area that could be looked into as part of future works on this system.
Now that the blob size has been calculated, we can begin the blob extraction. The system uses a modified version of the 2-pass blob extraction method. The traditional 2-pass method completes a first scan to label all pixels, and then a second scan to relabel all pixels that were not identified as being connected in the first scan. The same method is used in the bushwalker detection system, except that instead of automatically progressing to the second scan after the first, the system looks at an index of connected components from the first scan. Now, by adding the values of each separate component, we can gain the size of each blob only. Using the data that we gained earlier which determined the size of the blob we’re looking for, we can at this stage make a decision on whether the photo contains the bushwalker or not. This is fast way of checking the blob size values, and means that we will not continue to the second pass unless a match for the blob size has been found. Figure 4.2.2.2 shows a block diagram of the process.
y = -1.6073x + 352.46
-50 0 50 100 150 200 250 300
0 50 100 150 200 250
N u m b e r o f p ixel s
Altitude Above Ground
Use 8 - connectivity connected component extraction to identify pixels that are part of a single blob.
Index all blobs which are connected but have different values.
Using altitude, identify blob size values for shirt.
Index all blobs which are connected but have different values.
Obtain 2d shirt array from colour threshold algorith and begin first pass of blob-extraction.
Complete first pass
Obtain blob count totals using index.
Do any of the blob sizes match the size determined by the altitude?
End algorithm - bushwalker not found.
[image:28.595.55.552.61.819.2]Continue to second pass of algorithm. Look for pants blob within vicinity of shirt blob.
To begin with, only the shirt array is scanned. If a suitable blob size is not found during the first pass, the photo and all arrays are discarded and the process goes back to the beginning to process a new photograph. However, if a blob is found that does fit within the calculated range, then a second pass is initiated to find the location of the shirt blob within the photo. The location finds the first instance of the blob identification value, and returns an x,y coordinate of the pixel within the photo.
[image:29.595.90.375.230.469.2]We can now scan the photo for pants. Using the x,y coordinate of the shirt blob, a small area around the shirt is scanned. Figure 4.2.2.3 shows the respective area scanned for the shirt and pants.
Figure 4.2.2.3 – Scanned area for shirt and pants.
The scan area for the pants is determined using the altitude. The scan for the pants uses considerably less processing resources than the shirt scan due to the much smaller scanning area.
4.2.4 Obtaining Coordinates
Now that we have identified that the bushwalker is in the photo, and have his position, we must now identify his location using geographic latitude and longitude – this is the system used by GPS and can effectively determine any location around the world. To do this we use the GPS coordinates, aircraft heading and aircraft altitude that were recorded initially when the photograph was taken.
photograph. If we have a positive value of x, then the coordinate is on the right side, else it is on the left side. If we get a positive value of y, then the coordinate is on the bottom half of the photo, and a negative value indicates the top half.
[image:30.595.92.503.183.519.2]As the camera is facing directly downwards, we can assume that the UAV is at the centre of the photo. We can now find the magnitude and angle in relation to the centre of the photo as per the shown in figure 4.2.3.1.
Figure 4.2.3.1 – The UAV in relation to the found bushwalker.
Using these values, we can identify the magnitude and angle in relation to the UAV in the photo. Eg.
𝑀𝑎𝑔𝑛𝑖𝑡𝑢𝑑𝑒 = √Δ𝑥2+ Δ𝑦2
= √8732+ 3602
= 944
And angle:
(xPos – xCentre) is less than zero AND (yPos – yCentre) is less than zero, so we are in the 4th
quadrant. Therefore, add 270 degrees.
= 270 + tan−1𝑜𝑝𝑝
= 270 + tan−1360 873
= 292 degrees.
[image:31.595.116.483.177.648.2]We can now introduce the heading to the equation. Let’s say our aircraft is actually flying at 90 degrees, i.e due east. Figure 4.2.3.2 shows an example of this scenario.
Figure 4.2.3.2 – the UAV is flying eastward when it takes the photograph of the bushwalker.
In order to gain the true bearing of the bushwalker from the centre of the photo, we simply add the aircraft heading and the bushwalker bearing together, and if the result is over 360
°
, then we subtract 360.Now we can introduce altitude. The reason we take altitude into consideration is similar to the blob detection system, we can estimate size. In this instance we are estimating distance. A similar graph and subsequent algorithm was developed in order to measure distance in the photo. Table 4.2.3.1 shows the photographs with two objects a known distance from each other and their respective altitudes.
Altitude (meters above ground level)
85 98 125 145
Pixel distance between objects
[image:32.595.85.514.151.409.2]292 263 210 172
Table 4.2.3.1 – Altitude vs Shirt Pixel Count
We can chart these values to determine an algorithm to calculate distance, figure 4.2.3.5
Figure 4.2.3.5 – A graph showing Altitude Vs Pixel Distance
For the example, we can assume the UAV is at an altitude of 100 m. Using our formula, we can calculate that each meter is equal to:
y = -0.5022x + 230.89
0 50 100 150 200 250
0 50 100 150 200 250 300 350 400
A ltitu d e ( m ab o ve gr o u n d ) Distance (pixels)
[image:32.595.89.509.448.713.2]Pixel Distance (pixels/meter) = (Altitude - 230.89) / -5.022
Therefore, Pixel Distance = (100 – 230.89) / -5.022
= 26 pixels / meter
If we apply this now to our pixel magnitude, we can calculate the distance in meters:
944 / 26 = 36.3 m.
Finally we can introduce our latitude and longitude. To keep things simple, we will use an approximation of latitude and longitude as if we were on the equator. This will introduce some error (approximately 15 m in the worst case scenario), but will have sufficient accuracy for the purpose of the project.
Our approximation is as follows:
One latitude degree = 110600 m
One Longitude degree = 111300 m
To discover the coordinates of the bushwalker we must convert the polar coordinates back to x and y positions relative to the centre of the photograph.
The software must take into account which quadrant we are in, this will determine whether we are to add or subtract from the latitude and longitude coordinates. As we are now in the first quadrant, all our values will be adding to the latitude and longitude coordinates.
X position = 36.3 sin 22 = 13.6 m
Y position = 36.3 cos 22 = 33.7 m
If we have determined that the UAV GPS coordinate is at Latitude: -16.916128 and Longitude: 145.771599 then:
Bushwalker latitude = UAV latitude + X Position / Latitude degree
= -16.916128 + 13.6 / 110600 = -16.916005
Bushwalker longitude = UAV longitude + Y Position / Longitude degree
= 145.771599 + 33.7 / 111300 = 145.771902
Figure 4.2.3.6 – Bushwalker coordinates found.
4.3 System Configuration
4.3.1 UAV Software
The UAV is running several pieces of software during flight - these are listed below.
Vision Processing Software
running natively on the system processor, it was too slow to be considered for the final version of the software. It was for this reason that c++ programming language was chosen, as it compiles specifically for the Raspberry Pi computer, giving it a significant speed
advantage. For example, for the colour threshold process to complete it took approximately 20 seconds to do a complete pass of a five megapixel photo. The same process in c++ takes approximately 0.22 seconds.
GCC
This is the software used to compile the c++ code and create an executable able to be run from the command line interface on the raspberry pi.
Leafpad
A basic text editor with the ability to auto-indent and number each line.
Raspi-still
4.3.2 UAV Hardware
Figure 4.3.2.1 shows a diagram of the UAV and its associated hardware.
Figure 4.3.2.1 – Cross section of the UAV aircraft showing the internal hardware.
The following list briefly describes each piece of hardware in the UAV. Refer to figure 4.3.2.1 to see each piece of equipment.
1) 3D Robotics Flight Control Unit – An Arduino based dedicated flight controller board with gyro, accelerometer, barometer, and magnetometer to control automated flight of the UAV.
2) UBlox GPS unit – a GPS decoder plus GPS aerial to obtain location data. 3) Lithium Polymer Battery – 2 x 2200mAh 3 cell lithium polymer batteries for
range on one charge. More batteries can be added to increase range, however aircraft balance must be maintained.
4) Electronic Speed Controller – A variable speed drive for the brushless motor which directly controls thrust.
5) Switch Mode Voltage Regulator – Step down voltage regulator supplying 5V from battery to all systems in the UAV, not including the main motor.
6) Arduino MEGA Data Flow Controller – An Atmel MEGA 2560 microcontroller based prototyping board programmed to control data flow between internal systems and the telemetry link back to the base station.
7) Raspberry Pi Vision Processing Unit – A Raspberry Pi ARM computer used to receive images and process them to locate a missing bushwalker.
8) Camera Stabilisation Gimbal – A two servo unit controlled by the flight controller board to counteract roll and pitch of the UAV to keep the camera facing directly downwards.
9) Raspberry Pi 5MP Camera – A small charge-coupled based camera which is able to capture 5MP pictures using the Raspberry Pi’s on-board graphics accelerator. 10)Brushless Motor – 1150kV brushless electric motor, providing drive to the propeller.
[image:37.595.93.520.416.647.2]Also not pictured is the 915MHz telemetry unit which is installed on the wing section to keep it away from interference from other electronic components.
Figure 4.3.2.2 shows a wiring diagram of the hardware systems.
Figure 4.3.2.2 – Wiring diagram of the UAV system
Table 4.3.2.1 – Cable Schedule of UAV system
4.3.3 Base Station Software
The base station must run two main pieces of software simultaneously in order to decipher all data returning from the UAV. The following section details the software required and its purpose.
Mission Planner:
Mission Planner is open source software created by Michael Osborne. It interfaces directly with the ardupilot flight control board via the wireless telemetry system and translates incoming flight data (heading, location etc.). It also allows the user to enter waypoints using a graphical point and click system for the UAV to follow. Figure 4.3.3.1 shows a screenshot of Mission Planner being used in the Flight Planner mode, allowing the user to choose and then upload a flight plan for the UAV.
# Cable ID Cable Type Qty Length Function Colour From Terminal To Terminal
6/7 UART3 0.180 mm²
1C 2 150 mm
TTL Data IO from Flow Controller to Wireless Telemetry Module
Yellow /
Green Data Flow Controller 150 mm
2 0.180 mm²
1C Data Flow Controller
Grey USB0
White Digital IO Pin 2
Blue Digital IO Pin 3
UART1 4/5
8 PWM IN 0.180 mm²
1C 5 80 mm
USB0 Data Flow Controller
VPU to Control Board Selector
1 USB0 4C USB DATA 1 100 mm Data / Power Supply Vision Processing Unit
TTL Data IO from Flow Controller to Control Board
14 GPS DATA 0.180 mm² 1C 4 15 PWM OUT
Tx3 / Rx3 Wireless Telemetry Module Tx3 / Rx3
PWM data from RC Receiver to Control Board
Red / Brown / Orange
100 mm GPS Data Multi Arduplane Control Board GPS Socket GPS Unit Data Cable Socket 0.180 mm²
1C 6
PWM output data from Control Board to Servos / Speed Controller /
Camera Gimbal
Multi Arduplane Control Board Output Pins 1 to 6
Servos / Speed Controller / Camera Gimbal
16 KEYB Wireless Dongle for Keyboard Vision Processing Unit USB1 11
Arduplane Control Board Input Pins 1 to 5
Vision Processing Unit MicroUSB Power Socket 5V DC Supply Red / Black
5V DC 0.25 mm²
1C 2 150 mm 9 5V DC
RC Receiver
0.180 mm²
1C 2 150 mm 5V DC Supply
Pins 1 to 5
Red / Black Arduplane Control Board Common DC Rail 2 DIGI1 0.180 mm²
1C 1 100 mm 3 DIGI2 0.180 mm²
1C 1 100 mm
UBEC Power Supply DC Output Arduplane Control Board Common DC Rail
5V DC Supply Red / Black
VPU to Telemetry Selector Vision Processing Unit Digital IO Pin 1 Data Flow Controller
Vision Processing Unit Digital IO Pin 2 Data Flow Controller
Yellow /
Blue Tx1 / Rx1 Arduplane Control Board Tx1 / Rx1
5V DC 0.180 mm²
1C 2 150 mm Arduplane Control Board Common DC Rail RC Receiver Common DC Rail 13 CAM DATA 0.070 mm²
1C 12 100 mm Camera Data Grey Vision Processing Unit Camera Socket Camera Module
Figure 4.3.3.1 – Mission Planner
Python:
Python is used for two main purposes on the base station computer, for obtaining colour threshold limits for the image processing system, and also to decode messages that are being sent by the Raspberry Pi whilst the UAV is scanning.
4.3.4 Base Station Hardware
Figure 4.3.4.1 – Base station, consisting of tripod, table, laptop and telemetry unit.
4.4 System Performance
The processing time per image is limited by the cruising speed of the airframe, and the amount of area that can be captured in each image. At 120m, each photograph captures approximately 100 m in the direction of heading. The airframe has been tested to approximately 20 m/s maximum airspeed. This means that time taken from taking the image to complete all processing must take less than five seconds. Ideally, even less than 5 seconds, so that there is some overlap between each image being taken. The processing speed is discussed in the next topic.
4.4.1 Processing Speed and Code Efficiency
4.4.1.1 Code Efficiency
Several techniques were implemented to decrease processing time through code. These are
Writing photograph data to a ram drive to decrease disc access time.
Initialising all arrays once only on boot-up of the software and re-using the same memory allocation for each new image.
Determining early on whether an image meets certain requirements (such as total shirt pixel values) and if not, exiting the process early and capturing a new image. Processing the entire image for the shirt, but only processing a small area to look for
pants once a shirt blob has been identified.
4.4.1.2 Processing Speed
The Raspberry Pi computer has a low powered ARM CPU that has a default clock frequency of 700 MHz, core frequency of 250 MHz and 400 MHz RAM frequency. Whilst this frequency is sufficient for the system for the most part, more performance can be gained from the unit if it is overclocked.
Fortunately data exists already on the stability of the pi in its overclocked state. With an ambient temperature of 28 degrees, and overclocked to 1000MHz CPU, 450 MHz core, and 450 Mhz RAM, the CPU will heat up to approximately 55 degrees, well below its 85 degree maximum temperature threshold. The CPU will also underclock itself in the instance that the CPU temperature exceeds 85 degrees. This overclock will increase processing
performance by approximately 50%, which cuts the processing time of vision processing down significantly. For these reasons the system is overclocked with the settings listed above.
In order to aid in cooling, air vents have been placed in the UAV fuselage to channel air directly onto the CPU. No further measures were put in place for active heat dissipation of the UAV.
4.4.2 Bushwalker Identification
Now that a system for identifying the bushwalker has been developed, the system must be tested to gauge the ability of the system to accurately and repeatedly detect the
4.4.2.1 Detection Rate
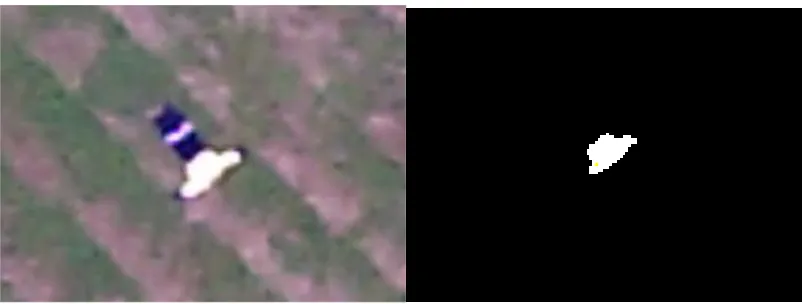
[image:42.595.84.463.194.285.2] [image:42.595.88.464.367.466.2]During the daytime with good lighting conditions, and using a dummy bushwalker with blue pants and yellow high-vis shirt, the system is 100% accurate in detecting the bushwalker, and rejecting photos that are not of the bushwalker. This result is regardless of the different background terrains that were tested. Results of this can be seen in figure 4.4.2.1.1 below.
Figure 4.4.2.1.1 – Photos on a clear day at 1.30pm with red box indicating that the vision processing system has detected the bushwalker.
However, problems arise at dusk when black jeans are used instead of the blue pants. Figure 4.4.2.1.2 show the result of the vision processing system under these conditions.
Figure 4.4.2.1.2 – Photos on a cloudy day at 5.30pm in winter with red box indicating that the vision processing system has detected the bushwalker.
As shown in figure 4.4.2.1.1 the photos are very blurry, and the black pants don’t show up clearly. Even though detection of the bushwalker remains at 100%, we end up with some false detections, including the second photo in figure 4.4.2.1.1 which is a yellow lid wheelie bin, not the bushwalker.
4.4.2.2 Different Terrain
[image:43.595.92.311.231.340.2]As finding different terrain types over which to fly the UAV proved to be quite difficult (areas around Cairns that were suitable to fly the UAV over seemed to be exclusively green), test images were formed using a simple bitmap editing program, and images from google maps. An image from google images of the 2012 Outback Challenge competition was also used. Of these images, the terrain types were tested with the vision processing system, and each posed no problem with detecting the bushwalker as long as the blue pant, yellow shirt dummy was used. Figure 4.4.2.2 shows an example of the bushwalker being detected over two other terrain types.
Figure 4.4.2.1 – Detection over different terrain. Left: an image made using terrain from google maps. Right: an image taken during the 2012 competition.
4.5 Chapter Summary
Chapter 5 - Conclusion
5.1 Chapter Overview
This chapter looks into possible further research work that could be explored in order to improve the project outcomes.
5.2 Future Work
As a useable project for the Outback Challenge competition, the project has met all the requirements and should perform satisfactorily in searching for and finding the lost bushwalker. The project demonstrated that using a mixture of colour threshold and blob size extraction the bushwalker could be successfully identified from the UAV using a standard RGB digital camera. However, the project could still be improved to make the detection system more efficient, and have higher discrimination of the bushwalker.
5.2.1 Efficiency and Processing Speed
Future testing should be completed to look into the resolution of the photographs to see whether reducing the resolution would indeed still net the same results. For example reducing the resolution from 5MP to 2MP would effectively cut the processing time by more than half. However it would need to be proven that no accuracy was lost. Certainly there is likely to be a peak point at which the resolution is still high enough that the bushwalker can be easily identified. This point would represent the most efficient use of the processing ability of the onboard computer.
Multitasking is another area in which no effort was spent to identify potential improvements in processing speed. It could be easily seen by looking at the processor use meter on the raspberry pi, that whilst a photo was being taken (approximately 1 second of time) that the processor was not being used at all. This is likely because the graphics processor was doing most of the work of image compression, and the central processor was doing very little during this time. It is therefore feasible that the process could trigger a new photo to be taken while it is still processing an existing photo, thereby not wasting processing time whilst the photo is being taken. This would make a significant improvement to the processing speed of each image, as 1 second equates to approximately one third of a complete image process.
processing speed, an additional Raspberry Pi could be added to the system in order to effectively double the processing speed without significantly increasing the requirement for power by the system. This would work well in that both computers could share the same camera and take turns processing images. Of all of the proposed speed increase measures this one would be the simplest.
5.2.2 Discrimination Techniques
Whilst the system was proven to work well during good light conditions, there could still be improvements made to help during low light conditions, and to further discriminate the results to reduce false detections. The below techniques will look at future works that could potentially improve the ability of the system to discover the bushwalker and reduce the number of false detections during low light conditions.
The simplest and easiest improvement to implement would be to use a camera with better low light capabilities. This would likely be a camera with a larger CCD sensor which is able to capture more of the available light in each shot and therefore obtain a clearer and more accurate photo to process. This would reduce the blurriness experienced using the raspberry pi camera during low light conditions which caused blob corruption during processing and thus false detections.
Furthermore the use of shape detection to identify the bushwalker would take significant effort to implement but would produce a much more accurate result. Using shape detection would also allow the user to use the system more easily in other applications. In this
instance using Gaussian edge detection instead of colour threshold would likely produce a faster system when using shape detection. However it would still likely be more processor intensive than the existing system and therefore would require greater processing power as discussed in section 5.2.1.
5.3 Other Areas of Research
Due to the system’s relative inexpensiveness and simplicity – its abilities could easily be turned to other applications. Detailed reports of these other applications are outside the scope of this project and would require more research to be completed before the system could be deemed as worthy for the application. Some of these systems are briefly discussed below.
discover potential trouble spots on the line. The research into this would need to include programming the ability of the vision processing system to identify the powerlines.
Obviously the navigation system of the aircraft could be loaded with the GPS coordinates of the powerlines so that it would only need minimal help from the vision processing system in order to aid its progress.
Rescue work is also an area which the system could be used. For example a team of UAVs could be used to search areas to find bushfires to prevent them spreading. This is an area that typically requires manned vehicles, so in using a UAV the risk of an air crash which endangers lives is reduced. In order to tune the system to discover fires, or other objects, a different programming algorithm should be used. Research into the best algorithm, and indeed the best sensor type would need to be conducted in order to find the best system for this purpose. Potentially using an infrared camera instead of a traditional colour camera may produce better results.
Further research should also be completed in the use of Gaussian edge detection and shape detection to investigate its usefulness. Whilst it is dismissed in this report as being too complicated and processor intensive, it may produce better results and for that reason it would be worth researching.
5.4 Summary
Chapter 6 - References
CMake - Cross Platform Make. 2013. CMake - Cross Platform Make. [ONLINE] Available at: http://www.cmake.org/. [Accessed 31st August 2013].
DIY Drones. 2013. DIY Drones. [ONLINE] Available at: http://www.diydrones.com/. [Accessed 10th January 2013].
Evangelio, R and Sikora, T. (2010), ‘Static Object Detection Based on a Dual Background Model and a Finite-State Machine.’
http://jivp.eurasipjournals.com/content/2011/1/858502. [Online; accessed 20th May 2013]. Evangelio, R.H. ; Patzold, M. ; Sikora, T. (2011), ‘A system for automatic and interactive detection of static objects.’
http://ieeexplore.ieee.org.ezproxy.usq.edu.au/stamp/stamp.jsp?tp=&arnumber=5712365. [Online; accessed 20th May 2013].
GCC, the GNU Compiler Collection - GNU Project - Free Software Foundation (FSF). 2013. GCC, the GNU Compiler Collection - GNU Project - Free Software Foundation (FSF). [ONLINE] Available at: http://gcc.gnu.org/. [Accessed 18th March 2013].
GitHub · Build software better, together.. 2013. GitHub · Build software better, together.. [ONLINE] Available at: https://github.com/. [Accessed 18th March 2013].
Malik, J. ; Puzicha, J. (2002), ‘Shape matching and object recognition using shape contexts.’
http://ieeexplore.ieee.org.ezproxy.usq.edu.au/stamp/stamp.jsp?tp=&arnumber=993558. [Online; accessed 20th May 2013].
OpenCV | OpenCV. 2013. OpenCV | OpenCV. [ONLINE] Available at: http://opencv.org/. [Accessed 31st July 2013].
Python Programming Language – Official Website. 2013. Python Programming Language – Official Website. [ONLINE] Available at: http://www.python.org. [Accessed 20th March 2013].
Radio Control Planes - Hobbyking . 2013. Radio Control Planes, Helicopters, Cars, Boats, FPV and Quadcopters - Hobbyking . [ONLINE] Available at:
http://hobbyking.com/hobbyking/store/index.asp. [Accessed 12th January 2013].
Raspberry Pi | An ARM GNU/Linux box for $25. Take a byte!. 2013. Raspberry Pi | An ARM GNU/Linux box for $25. Take a byte!. [ONLINE] Available at: http://www.raspberrypi.org. [Accessed 18th March 2013].
Salve, S.G. ; Jondhale, K.C. (2010), ‘Shape matching and object recognition using shape contexts.’
Wang, J and Ooi, WT. (1999), ‘Detecting Static Objects in Busy Scenes.’
Appendix A – Project Specification
University of Southern Queensland
Faculty of Engineering and Surveying
ENG4111/4112 Research Project
Project Specification
For James Timings
Topic UAV Static Obstacle Detection Supervisor Tobias Low
Enrolment ENG4111 – S1, 2013 ENG4112 – S2, 2013
Project Aim This project seeks to develop a system to allow an unmanned aerial vehicle to detect a lost bushwalker (dummy) below it, and navigate itself to the
bushwalker to confirm the sighting. Programme Issue B, 1st May 2013
Complete a literature review of current research in the area of UAV static obstacle detection.
Implement an RGB camera of sufficient resolution to adequately detect the bushwalker from an altitude of approximately 120m.
Use remote data link for relaying sensor data and controlling the UAV.
Integrate an existing control system for a hobby grade UAV for the purposes of developing object detection algorithms.
Graph, evaluate and verify the output of algorithms by running simulations.
Run controlled experiments to determine effectiveness of object detection such as:
o Return a found result when the UAV flies over an area with the bushwalker present.
o Return a not found result when the UAV flies over an area with no bushwalker present.
Appendix B.1 – Project Timeline
Task Description Completion Date
Topic definition 8th March 2013
Specifications 13th March 2013
Literature review 3rd May 2013
Build and test UAV 10th May 2013
Collect test images 10th May 2013
Develop image processing system 24th May 2013
Preliminary report 29th May 2013
Implement image processing system to UAV 21st June 2013
Develop navigation system 12th July 2013
Implement navigation system to UAV 26th July 2013
Test complete system 23rd August 2013
Project presentation 26th September 2013
Appendix B.2 – Risk Assessment
The activities that are deemed most hazardous are identified below:
Flying the UAV in an area where it could potentially lose control and crash Contacting a spinning propeller
Receiving a shock from low voltage electronics Receiving a burn from a soldering iron
Lithium polymer batteries short circuiting and combusting Tripping or falling whilst working outdoors
Repetitive strain injuries from long term computer use
Now that the hazards have been identified we can use a risk matrix to identify the level of risk. Figure 8.1 shows a risk matrix
Consequence ↓
Likelihood →
Rare Possible Almost Certain
Catastrophic MEDIUM HIGH HIGH
Moderate LOW MEDIUM HIGH
[image:51.595.85.511.313.389.2]Insignificant LOW LOW MEDIUM
Figure 8.1 – Risk matrix
Using the risk matrix we can assess the activities to determine a risk rating for each activity. If an activity is a LOW rating then no control measures are required. Figure 8.2 classifies each activity based on its risk rating. Those above a LOW must have control measures impletemented.
Activity Consequence + Likelihood Risk Flying the UAV in an area
where it could potentially lose control and crash
Moderate + Possible MEDIUM
Contacting a spinning propeller
Catastrophic + Possible HIGH
Receiving a shock from low voltage electronics
Insignificant + Rare LOW
Receiving a burn from a soldering iron
Moderate + Rare LOW
Lithium polymer batteries short circuiting and combusting
Catastrophic + Rare MEDIUM
Tripping or falling whilst working outdoors
Moderate + Rare LOW
Repetitive strain injuries from long term computer use
Moderate + Possible MEDIUM
Figure 8.2 – Activities with risk rating assigned
[image:51.595.86.512.475.728.2] Flying the UAV in an area where it could potentially lose control and crash:
This is of moderate likelihood as the control software will be being tested for the first time whilst in the air. Although every effort will be made to make sure that the software is robust and will not cause problems with the control of the UAV by thoroughly testing it prior to launch, there is still a possible likelihood of the software becoming unstable.
However, the consequence is only Moderate if the UAV crashes into a person or property. Crashing into the ground has no risk except for the UAV, which is expendable. Therefore the control measure required is to fly the UAV well away from people and property to minimise the risk of external damage. If test flying in an open area away from people, the risk consequence can be reduced to a Low.
Contacting a spinning propeller
The propeller on model aircraft is very small, but can spin at speeds of up to 10000 RPM. This is potentially very damaging to fingers and hands which could go near the propeller whilst it is spinning. Figure 8.1 shows the aircraft propeller.
To control this risk, the motor must not have power to it until it is ready to launch. When the motor has power to it, it produces an audible alarm to indicate that it is armed and could spin. In this instance hands must be kept well away from the aircraft at all times. As the aircraft is to be hand launched, however, the person launching the aircraft must be fully briefed on the technique and risks prior to launch.
[image:52.595.91.338.518.703.2]With these controls in place, the risk can be brought down to Moderate + Rare equalling a Low risk.
Lithium polymer batteries short circuiting and combusting
As lithium polymer batteries have a low internal resistance and a high discharge rate, they can potentially cause a significant amount of heat energy if they are allowed to short circuit through high gauge wires. Therefore they could potentially cause catastrophic damage to persons or property.
[image:53.595.90.350.257.444.2]The likelihood of an unintentional short circuit occurring is rare, as modern plugs and recharging systems have safeguards against such an event. However, if the systems in place were to fail then there is a potential risk. Therefore to negate this risk, all batteries should be recharged and stored in a bag designed for this purpose. Using the bag we can reduce the consequence to Moderate. Figure 8.2 shows an image of the safe-bag.
Figure 8.2 – charging bag
Repetitive strain injuries from long term computer use