BIS RESEARCH PAPER NUMBER 176
Progression of Apprentices to Higher
Education – Cohort Update
Prepared for the Department for Business, Innovation and Skills by the Centre for Work-Based Learning, University of Greenwich.
Authors: Hugh Joslin and Sharon Smith Centre for Work-Based Learning
Partnership Division University of Greenwich Medway Campus
Pembroke
Chatham Maritime KENT ME4 4TB
[email protected] ++44(0)20 8331 9487
The views expressed in this report are the authors’ and do not necessarily reflect those of the Department for Business, Innovation and Skills.
Department for Business, Innovation and Skills 1 Victoria Street
London SW1H 0ET www.bis.gov.uk
Contents
Contents ... 1
Acknowledgements ... 4
Executive summary ... 5
Apprenticeship provider types... 5
Higher education funding types... 6
Key results ... 6
Significant findings for colleges and universities... 7
Significant findings for different apprenticeship providers... 8
Regional findings... 8
Sectoral findings... 9
Demographic findings ... 9
Higher apprenticeships ... 10
1. Introduction ... 12
1.1 Structure of the report... 12
1.2 Context of the research ... 13
1.2.1 Policy context ... 13
1.2.2 Research context ... 14
1.3 Research aims and objectives... 17
1.4 Methodology ... 17
1.4.1 Prior entry to higher education ... 18
1.4.2 First time entrants... 18
2. Progression of apprentices to higher education – headline figures... 21
3. Characteristics of advanced level apprentices ... 25
3.1 Key characteristics of the advanced level apprentice cohorts in this study ... 25
3.2 Progression from intermediate apprenticeships to advanced level apprenticeships ... 29
3.3 Progression from intermediate apprenticeships through to advanced level apprenticeships and onto higher education... 31
3.4 Previous experience of higher education and apprenticeships ... 31
4. Trends in the progression of apprentices over five years (2005-06 to 2009-10)... 32
4.1 Initial entrant progression trends ... 32
4.2 Trends in progression by region ... 33
4.3 Gender trends... 35
4.4 Trends by framework... 36
4.5 Demographic comparisons using POLAR3 ... 37
4.6 Trends by type of apprenticeship provider ... 38
4.7 Trends by higher education qualification type ... 39
4.8 Trends by higher education mode of study ... 40
4.9 Higher education provider trends (top 20 providers) ... 40
5. Recent trends in progression to higher apprenticeships 2008 and 2009 starts ... 42
5.1 Overview of apprentice progression to higher apprenticeships... 42
5.2 Detailed analysis of the 2008-09 and 2009-10 advanced level apprentice starts into higher apprenticeships ... 44
5.2.1 Frameworks... 44
5.2.2: Gender ... 45
5.2.3 Regional differences... 45
6.1 Progression for 2005-06 apprentices who are first time entrants to higher education... 47
6.2 Progression by geography... 48
6.2.1 Region and progression by framework... 49
6.4 Progression by framework... 50
6.4.1 Framework – timing of progression... 51
6.4.2 Mode and framework ... 52
6.5 Progression and type of apprenticeship provider ... 53
6.6 Course level and framework ... 55
6.7 Progression and gender ... 56
6.7.1 Timing of higher education entry by gender... 56
6.8 Disadvantaged profile of advanced level apprentices and progression breakdown... 56
6.8.1 Breakdown by POLAR3 and qualification aim ... 58
6.8.2 Breakdown by framework and POLAR3 ... 58
6.8.3 Region by POLAR3 group and higher education progression ... 59
6.8.4: Delivery of higher education provision and POLAR3 comparison ... 60
6.9 Higher education subject areas ... 60
7. Conclusions... 62
8. References... 64
Acknowledgements
The authors would like to thank Vikki McAuley at the Department for Business, Innovation and Skills for managing the research, Debi Hayes, formerly Head of Partnerships at the University of Greenwich and now Assistant Provost at GSM London and Professor Jill Jameson, Head of the Centre for Leadership and Enterprise in the Faculty of Education and Health at the University of Greenwich for their ongoing support and encouragement. We would also like to thank Mark Gittoes (Head of Quantitative Analysis for Policy at HEFCE) and his team at HEFCE for collaborating on the development of the methodology for this research and Dr Suzie Dent, Analytical Services Manager and Jenny Skeet,
Executive summary
This report presents the findings of research undertaken for the Department for Business, Innovation and Skills (BIS) into the progression to higher education of advanced level apprentices over a seven year period. This is part of a longitudinal study whose first results were published in BIS research Paper 107 (Joslin & Smith, 2013) and this report provides an update on those findings for six cohorts of advanced level apprentices who had completed their framework. The research captures the complex nature of
apprenticeship progression and reports on progression to higher education in both colleges and universities.
The research findings are based on the matching of ILR (Individualised Learner Record) datasets with HESA (Higher Education Statistics Agency) datasets between the years 2005-06 and 2011-12. They provide a detailed analysis of the nature of the progression of apprentices, trends in progression rates over time and highlight the contribution made by FE Colleges in delivering the sort of higher education to which many apprentices progress. The matched records contain demographic information about the apprentices such as gender, age and domicile, and also data about where they progressed from and where they progressed to, hence there are a wide set of variables that can be compared and this report provides a selection. Each of the findings raises interesting questions that may require further analysis of the data.
The findings published in this report provide an overall picture of apprenticeship progression at this point in time. The research project is longitudinal and the aim is to continue repeating the matching year on year to provide ever richer sets of data tracking the progression flows of this important group of part-time work-based learners.
The key results refer to different types of apprenticeship providers and also to the different ways in which higher education is funded. For the sake of clarity, explanations are given here:
Apprenticeship provider types
Provider of advanced level apprenticeships
Further description – each of these provider types
contract with the Skills Funding Agency for the provision of Apprenticeships.
Private Training Providers Private training companies who deliver a range of work based training programmes including apprenticeships.
Further Education Colleges
Further education and tertiary colleges funded by the Skills Funding Agency and/or via HEFCE for prescribed higher education provision. Colleges deliver full and part-time programmes including apprenticeships.
Higher education funding types
Type Funding agency Delivered in
Prescribed Higher Education
Higher Education Funding Agency
Universities and Further
Education Colleges (prescribed higher education or higher education in FE)
Non-Prescribed Higher Education
Skills Funding Agency (SFA) and previously the Learning
and Skills Council (LSC) Further Education Colleges
The report analyses the results of tracking five cohorts of apprentices from 2005-06 to 2009-10 who progressed into higher education between 2005-06 and 2011-12. To capture the complex nature of apprentice progression behaviour, the tracked cohorts in this study have been derived in a particular way (see section 1.4 on Methodology page 17) and numbers do not match directly across to the Statistical First Release (SFR) figures published by The Data Service.
Key results
18.8% of the 2005-06 tracked apprentice cohort progressed to higher education when tracked for a total of seven years. 11.7% progressed immediately in the three years following the start of their apprenticeship. (Table 3, page 22) This rate of
progression is an improvement on the rate of 6% found in a study by HEFCE (HEFCE, 2009) and an increase on the seven year rate of 15.4% found for the 2004-05 cohort in the previous study in this series (Joslin & Smith, 2013).
Five cohorts between 2005-06 and 2009-10 were tracked for three years allowing like for like trend analysis. The total numbers of apprentices progressing to higher education over the three years increased by 1,200 entrants from 3,895 for the 2005-06 to 5,095 for the 2009-10 cohort.(Table 2, page 21).
However the research also shows that the three year progression rate has
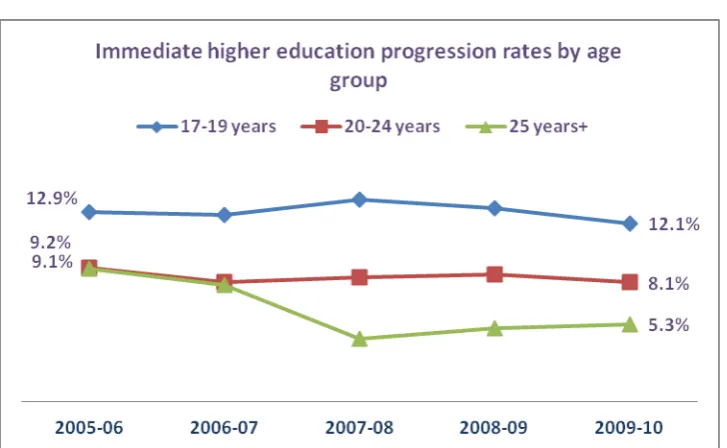
dipped over the five cohort years from 11.7% in 2005-06 to 9.5% in 2009-10. This reduction is influenced by the significant increase in the numbers of apprentices aged 25+ who progress at a much lower rate (5.3%) than 17-19 year olds (12.1%) within the timescale. In fact, progression rates for the 17-19 year group have
remained fairly stable with only a small percentage point drop (-0.8%) but the 25+ age group has seen a higher drop (-3.8% points). (Table 12, page 32).
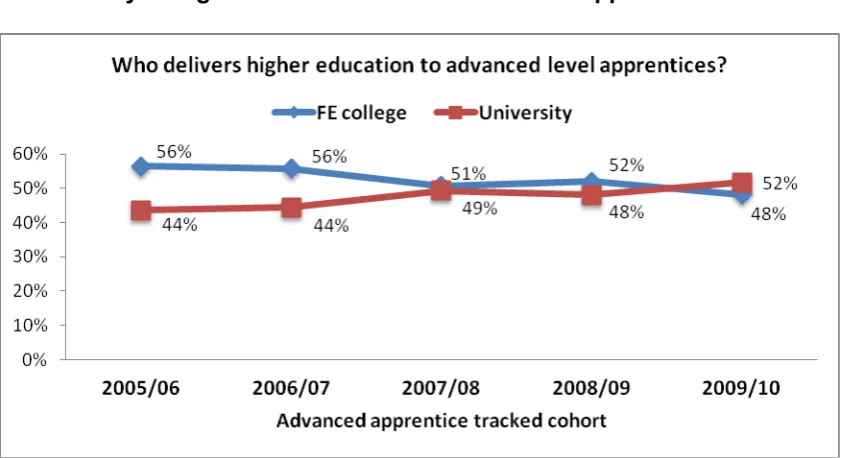
Between 2005-09 and 2008-09 a higher proportion of those who progressed went on to study higher education programmes in collegesthan to university.
However,this changed for the 2009-10 cohort where a higher proportion of those who progressed went to a university than to a college. (Figure 2, page 23).
There are variances in the higher education mode of study at framework level where detailed analysis of the 2005-06 cohort showed for example that 67% of
Sporting Excellence students study higher education full-time but 97% of Accountancy apprentices study higher education part-time. (Table 29, page 52).
52% of the 2009-10 advanced level apprentice cohort had previously been intermediate apprentices (Table 10, page 29) and 7% of these went on to higher education. (Figure 3, page 30).
64% of advanced level apprentices who progressed to higher education had done so within three years of starting their advanced level apprenticeship but timing of entry varies according to the type of higher education and age. (Table 26, page 47).
Timing of entry analysis shows significant differences in patterns of progression where a higher proportion of females enter later than males and students entering prescribed higher education programmes are more likely to enter higher education later than those who go onto non-prescribed higher education programmes. (Figure 10, page 55 and Table 26, page 47).
Significant findings for colleges and universities
Colleges and universities may find of interest what is revealed in this report about the behaviour and characteristics of this increasing volume of part-time learners. They represent an important but comparatively under-researched constituency about whom more needs to be understood before their progression rates can be improved
significantly. In the context of the large reduction of part-time higher education learners in 2011 and 2012, this study identifies some important areas for further analysis
including age, gender and framework studied as well as questions around the supply of part-time higher education programmes.
Historically colleges delivered proportionally more higher education to the advanced level apprentice cohort who progressed than universities, but that changed for the last tracked cohort in 2009-10 when universities delivered proportionally more than colleges. (Figure 2, page 23).
Whereas 79% of the first tracked cohort in 2005-06 went onto part-time study in higher education this had decreased to 66%in 2009-10, an indication that more advanced level apprentices are choosing to make a life change and progress to education on a full-time basis. (Figure 5, page 39).
The progression rate of advanced level apprentices registered with FE providers (2005-06 cohort tracked for seven years) was 19%. Of these 49% went to university, 41% to higher education in FE and 10% to non-prescribed higher education. (Table 30, page 53).
Higher education course types vary at framework level so while 44% of Customer Service advanced level apprentices who progressed went onto study a First Degree, only 12% of Construction advanced level apprentices went onto this level of study (most Construction apprentices go onto OUG study, particularly HNC). Over half of those on a Children’s Care Learning and Development framework went onto a Foundation Degree. (Table 31, page 54).
Significant findings for different apprenticeship providers
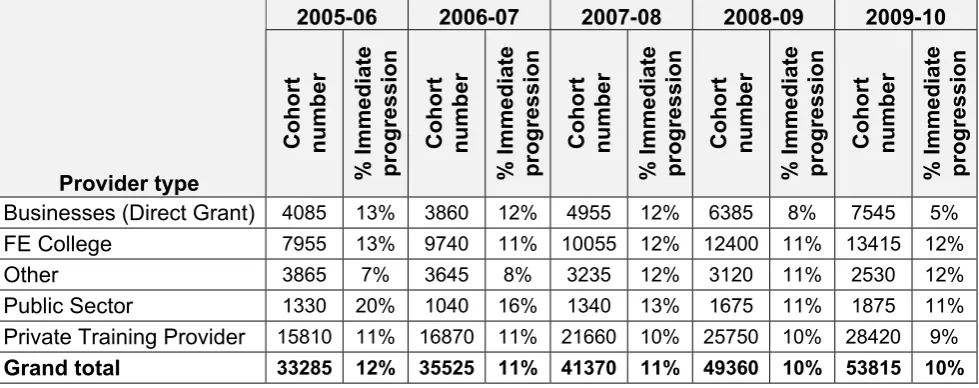
There were significant differences in the progression rates of apprentices based on their provider type. Demographic, framework, age and regional factors might all throw light on the figures as well as more qualitative research that might look at expectations. The numbers of advanced level apprentices from all provider types, except those
from the Other group (e.g. charities) increased. Businesses (Direct Grant), FE Colleges and Private Training Providers all saw a particularly high growth in numbers between the 2005-06 and 2009-10 cohort of advanced level apprentices. (Table 8, page 27).
The 2005-06 cohort in the Public Sector had highest rate of higher education progression by provider at 20% but this had decreased significantly to 11% for the 2009-10 cohort. The 2005-06 FE college cohort had a progression rate of 13%, and this also decreased but only slightly, whereas the 2009-10 cohort had a rate of 12%. (Table 17, page 37).
The majority of apprentices from the Public Sector who progress, go on to higher education at university. In comparison, FE college apprentices are more likely to remain in FE colleges for their higher education to study both non-prescribed higher education and higher education in FE. (Table 30, page 53).
Regional findings
While the advanced level apprentice tracked population has increased in every government office region in England, London had the highest increase where the population nearly doubled although this was from a low start. (Table 5, page 25).
There are significant differences in the progression rates by region. The 2005-06
London was one of the few regions to see an increase in higher education progression between 2005-06 and 2009-10 at 3 percentage points where most regions saw a decrease. (Table 13, page 33).
Sectoral findings
Higher education progression rates at framework level vary significantly and there does not appear to be a positive correlation between the population of the apprentice cohort and higher education progression. Two frameworks:
Engineering and Electrotechnical each make up over 10% of the total advanced level apprentice 2005-06 cohort. Their higher education progression rates are entirely
different though with around 37% of Engineering apprentices entering higher education compared to just 1% of Electrotechnical apprentices. (Table 28, page 50).
Frameworks also differ in terms of higher education delivery. For example, 83% of apprentices who progressed from a Hospitality and Catering framework went onto higher education in a university but this compares to just 44% of Vehicle Maintenance and Repair apprentices. (Table 28, page 50).
At framework level, there have been clear changes in the progression rates across the tracked cohorts. Engineering higher education progression rates have dropped significantly as have Health & Social Care rates. Meanwhile, Sporting Excellence and Accountancy higher education progression rates have increased. (Table 15, page 36).
There is no specific correlation between higher advanced level apprentice
numbers and higher education progression at framework level. Despite the large increase in the number of Health and Social Care apprentices, the higher
education progression rate dropped considerably. In contrast, there was both a drop in the number of Engineering advanced level apprentices and a drop in higher education progression. (Table 6, page 26, Table 15, page 36).
Demographic findings
Age
5 cohorts between 2005-06 and 2009-10 were tracked for three years allowing like for like trend analysis. The 3 year progression rate for the 2005-06 cohort was 12.1% and this decreased to 9.4% for the 2009-10 cohort. The higher education progression rate of 17-19 year olds only dropped slightly but there was a higher percentage point drop with 25+ apprentices. The overall progression rate reduction is clearly influenced by the significant increase in 25+ numbers who progress at a much lower rate than 17-19 year olds. (Figure 2, page 23).
Gender
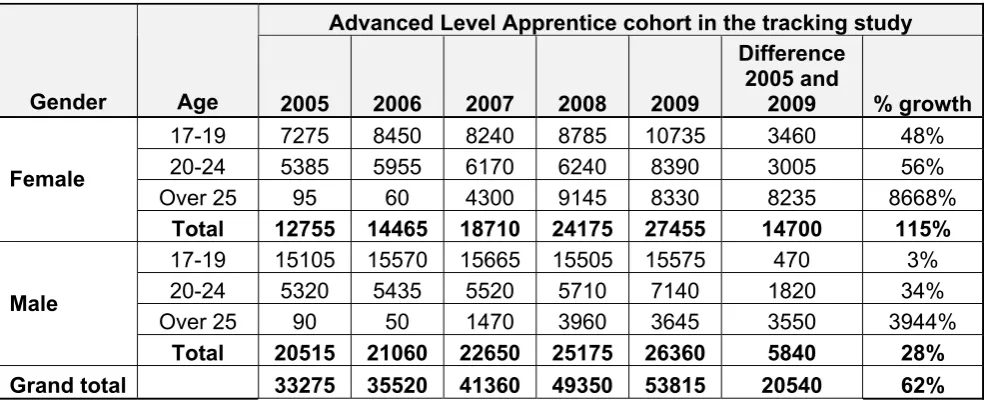
A comparison between the 2005-06 and 2009-10 cohorts revealed that the female advanced level apprentice tracked population doubled but the male tracked population increased by only 62%. Young male apprentice numbers only increased by +3% compared to +48% for young females. (Table 4, page 25).
It is also the case that the progression rate for female advanced level apprentices
has decreased at a slightly higher rate than for males. (Table 14, page 35). Females were more likely to study to progress 4-7 years from the start of their
apprenticeship than males and females were also more likely to go on to full-time higher education study than males. (Figure 10, page 55).
Domicile and deprivation
Higher education progression rates at POLAR3 group level are more or less similar where Q1 apprentices are slightly less likely than Q5 students to progress to higher education. (Table 16, page 37).
22% of advanced level apprentices who entered HE were classified as POLAR2 Q1 and 24% POLAR2 Q2. In comparison, a HEFCE pilot study of characteristics of England local areas, 8% of all entrants were classified as POLAR2 Q1 and 15% POLAR2 Q2. Furthermore, an analysis of young UCAS accepted applicants in 2011 showed that only 11% were classified as POLAR2 Q1 and 16% Q2. This provides evidence that the advanced level apprentice higher education entrant population has a higher proportion of educationally deprived learners (POLAR2 quintile 1 and 2) than the general higher education population. (Table 32, page 56).
There are differences in higher education level of study by POLAR3 group. 21% of 2005-06 apprentices who live in areas with very low higher education participation (POLAR 3 Q1) went onto Level 4 NVQs and this compares to just 16% if Q5
apprentices who progressed. (Table 33, page 57).
There are differences in the delivery type of higher education courses studied by disadvantaged and advantaged apprentices. A higher proportion of advantaged students study courses at university than disadvantaged students (57% vs 52%). (Figure 12 page 59) .
Higher apprenticeships
This study was able to capture in the ILR flagged higher apprentices for 2008-09 and 2009-10. It was therefore able to pick up some of the early numbers and
The number of advanced level apprentices progressing on to Higher
Apprenticeships increased from 960 to 1,200 between 2008-09 and 2009-10 with a progression rate for the 2009-10 cohort at 2.2%, slightly higher than the 2.0% rate for 2008-09 apprentices. (Table 21, page 42).
Between 2008-09 and 2009-10, 98% of higher apprentices were on the
Accountancy framework and this skews the results at present. (Table 23, page 43). The investment in higher apprenticeships from 2012 onwards will change this. In 2009-10 there were only five higher apprenticeship frameworks (Engineering
Technology, ICT, Accountancy, Purchasing and Supply and Contact Centres). In 2014 there are now 28 with a further 14 in development (NAS, 2013).
The North West, the South West and the East Midlands had the highest
1. Introduction
This report presents the findings of research undertaken for the Department for Business, Innovation and Skills (BIS) into the progression to higher education of advanced level apprentices. It updates the findings of an earlier apprenticeship progression tracking study published in BIS Research Paper 107 (Joslin & Smith, 2013) and provides additional information on the complex nature of the progression of apprentices and the institutions apprentices attend to study higher education. Higher education progression is explored in terms of gender, age, apprenticeship framework, student domicile and higher education qualification. A geo-demographic profile is also provided using the home postcode of the apprentice and this helps to explore the mobility of advanced level apprentices classified as disadvantaged. The study also looks at the progression of apprentices at Level 2 to advanced level apprentices at Level 3, providing an insight into apprentice pathways from Level 2, through Level 3 and onto higher education.
The findings of this research are derived from matching Individualised Learner Record (ILR) data about apprentices with Higher Education Statistical Agency (HESA) data which holds data about learners in higher education. It matches cohorts of advanced level apprentices for each year between 2005-06 to 2009-10 entering higher education for the seven years between 2005-06 and 2011-12. Since the ILR holds data about
non-prescribed higher education, it also provides part of the progression data captured in this study. The methodology is examined further in section 1.4.
1.1 Structure of the report
Introduction – this provides the context for the research, situating it within the policy framework and relating it to previous research on apprenticeship progression. It states the aims and objectives of the research and provides a background to the methodology used. Progression of apprentices to higher education – headline figures - Summary tables are presented with the headline figures for apprenticeship progression tracked over the timeframe of this research with breakdowns into colleges and universities.
Characteristics of the advanced level apprentice cohort – in this research a number of aspects of the cohort were analysed including:
cohort population and features across years
the rate and pattern of progression of intermediate apprentices previous experience of higher education
Trends in the progression of apprentices 2005-06 – 2009-10 – this section looks at trends for five cohorts of apprentices which can all have progression rates compared over a three year period. It looks at:
changes in three year progression rates trends by region
trends based on the POLAR 3 classification of higher education participation Analysis of two years progression to higher apprenticeships (2008 and 2009 starts) -this section tracks the advanced level apprentice cohort through to higher apprenticeship datasets. It examines:
progression rates of two cohorts: 2008-09 and 2009-10 timing of progression
framework level progression
Detailed analysis of apprentice progression based on the 2005-06 cohort – which has been tracked over seven years. This section looks in at:
progression information by age timing of progression
regional analysis
framework analysis
analysis of advanced level apprentice providers
type of higher education provision and mode of delivery
gender analysis
disadvantaged profile and progression higher education subject areas
breakdown of advanced level apprentices who progress to full-time higher education
higher education institutions progressed to
Conclusions – summarising the key messages from the research.
1.2 Context of the research
1.2.1 Policy context
In New Challenges, New Chances (BIS, 2011) the government laid out its intention to provide a “ladder of opportunity” through apprenticeships to “clear and flexible progression routes to Higher Vocational Education”. It has demonstrated its intentions practically with the Higher Apprenticeship Fund providing £25 million to boost the development of 10,000 higher apprenticeship places within four years. More recently in the Chancellor’s Autumn Statement in 2013, £40 million has been committed to increase the number of people starting higher apprenticeships by 20,000.
This research shows that this is much needed given that even with a progression rate of 18.8% over seven years, apprentices do not match the rates of other vocational learners at 40% (HEFCE, 2007) or A level learners at 90% (Carter, 2009). Comparing this figure with the aspirational figure given by the National Apprenticeship Service of 50% of advanced level apprentices showing “interest in pursuing a degree-level equivalent course” (NAS, 2011) there is clearly a way to go before there is more equity between the progression rates of apprentices and other full-time vocational and A level learners.
Standards (SASE) that included higher apprenticeships for the first time (BIS, 2011). They were the trailblazers overwhelmingly dominated by Accountancy but also including
Engineering and IT. The rapid development of higher apprenticeships will play an important role in providing flexible, part-time and work-based higher education opportunities. The findings in this research project, by identifying the progression behaviour of existing apprentices, can also shed a light on what other sorts of provision needs to be developed to maximise their opportunities for progression.
The phrase “Higher Vocational Education”, used in New Challenges, New Chances (BIS, 2011) to describe the whole range of higher education found in colleges, has been noted in a recent study of higher education in further education colleges undertaken for BIS (Parry, Callender, Scott, & Temple, 2012) and following consultation with AOC
(Association of Colleges) members, it was agreed to include a breakdown along these lines for the first time in this report. Higher Vocational Education has been found to be the destination for many apprentices. Using it brings together the complex range of higher education offered by colleges and for the first time expresses their contribution on a like for like basis with universities.
Parry et al (Parry, Callender, Scott, & Temple, 2012), discuss the way in which college delivery of higher education has been affected by conflicting policy moves stemming from the two key funding councils (the Skills Funding Agency (previously LSC) and HEFCE). They also show that during the period this research covers, HNCs and HNDs, which had hitherto been the dominant higher education offer in colleges, were being eclipsed by the expansion of foundation degrees. One effect of this is thought to lie behind the reduction in progression by engineering apprentices who traditionally had progressed onto HNCs. They also show that despite the LSC having aspirations in 2006 for a strategic role in higher education, due to the fact that non-prescribed higher education was discretionary and was subject to local variation and cuts, the numbers studying non-prescribed higher education fell. The recent reinvention of a more unified higher education role for colleges embraced within the title of “Higher Vocational Education” brings together both their non-prescribed and non-prescribed higher education offer in a name, but it won’t be until they appear side by side in college prospectuses that there will seem to be parity. Apprentices progress onto higher education covered by both funding streams and because it shows trends over the past six years, the data derived from this research can provide indications of where policy changes have affected progression flows.
This longitudinal research project aims to establish benchmarks on an annual basis and it will illuminate the impact of policies such as those which have provided the opportunity for colleges to develop their provision of higher education including their ability to bid for direct numbers and others like the increase in higher education fees and the provision of fee loans for part-time students. These measures, along with the expanding delivery of higher apprenticeships by colleges will affect the higher education landscape for apprentices and future tracking could reflect the impact of this.
1.2.2 Research context
Previous research
progression from advanced level apprenticeships to higher education was poor. More recently, the Skills Commission’s inquiry into apprenticeships (Skills Commission, 2009) and HEFCE’s report on apprenticeship progression (HEFCE, 2009) indicate that this situation remained largely unchanged. This was confirmed in the UKCES report on vocational progression (UKCES, 2010) where the rate of progression of apprentices
quoted was 6%. As previously mentioned, this compares with the 40% progression rate of level three vocational learners (HEFCE, 2007) and the 90% progression by A level
learners (Carter, 2009).
In the report by the Skills Commission (Skills Commission, 2009), it was acknowledged that there was a need for a new method of progression tracking to fill an information gap. A new method to provide “valuable data on former apprentices progressing into advanced further education, such as HNDs and foundation degrees, about whom little is also known” (P.43). The report recommended that:
“The Government should commission systematic research enabling it to monitor former apprentices who progress to higher education and advanced further education, and those former apprentices who have already progressed. A study should be built up year on year until the Unique Learner Number starts to produce informative data.” (Page14)
This was further underlined by the UK Commission for Employment and Skills (UKCES, 2010) when they said:
“The lack of data and monitoring arrangements to track the progression of those pursuing applied and vocational learning beyond level 3-SCQF level 6 is a major deficiency in current management information systems. Robust and comprehensive data will enable the extent and nature of the issues to be more fully assessed and enable measures taken to address them to be more accurately targeted”. (Page 60) In the latest report of the Independent Reviewer on Social Mobility and Child Poverty
(Social Mobility and Child Poverty Commission, 2013), Alan Milburn discusses the need for clear information about vocational qualifications including apprenticeships. He says:
“The Government should set itself a clear target for increasing the proportion of apprentices who enter higher education and universities should set out how they plan to accept more students who have completed apprenticeships onto their courses” (Page 54)
With the increasing numbers of advanced level apprentices, it is important to assess the level of participation in higher education of this group of learners and how this compares to other groups of learners. Furthermore, as the number of advanced level apprentices
increases, it is necessary to explore whether progression to higher education is
maintained, and indeed increased, in line with trends over the period in the expansion of overall higher education participation.
A new perspective on apprentice progression
This research looks at progression from the point when an advanced level apprentice starts their framework (rather than when they end their apprenticeship). In consequence, the results include those students who enter higher education in the same year as they are finishing their apprenticeship (and not just for the years following completion of their
2002-03 to see whether an entrant had previous higher education experience. It therefore provides a rigorous examination of higher education progression both generally and for first time entrants to higher education.
This tracking study follows advanced level apprentice cohorts starting apprenticeships in the years 2005-06 to 2010-11 and entering higher education between the years 2005-06 and 2011-12. Longitudinal tracking helps to show the trajectory of advanced level
apprentices over time and recognises that the progression patterns of work based learners are different from non-work-based learners entering higher education. It presents data to show that some advanced level apprentices already have prior experience of Higher Education before they start their apprenticeship. By exploring timing of higher education entry, the study examines the extent to which students enter higher education immediately or some time after their apprenticeship.
In the BIS research study “Prior Qualifications of Adult Apprentices 2009-10” (BIS, 2011) it was found that around a half of Level 3 apprentices had already studied at this level
before. The inference is that many advanced level apprentices may already have achieved the necessary qualifications to enter a higher education programme, though perhaps not in the subject of their choice. In this report, therefore, prior entry to higher education, as well as higher education progression of advanced level apprentices is explored, examining to what extent advanced level apprentices may already have entered higher education (but not necessarily completed or achieved) before commencing an apprenticeship.
The report disaggregates advanced level apprentices into two groups: those who had already entered higher education before starting an apprenticeship and those who are first time entrants to higher education. In this sense, the study increases our understanding of the complex nature of advanced level apprentices and higher education entry and its findings show that the progression of advanced level apprentices into higher education is in many ways different to other groups of students; especially those students who are not progressing from work-based learning environments.
As a study of the progression of apprentices, this research can also be seen as a study of the progression to higher education of a very large sample of part-time work-based
learners aged 18+. Not all part-time work-based learners are apprentices, but at level three, advanced level apprentices make up a large and increasing proportion of them and the research show that 78% of them who go on to study higher education do so part-time. This study therefore provides useful intelligence for all institutions offering higher education about the nature of the learning experiences required by these sorts of learners. In a recent BIS research report on part-time higher education (Pollard, Newton, & Hillage, 2012), the authors look at what constitutes part-time higher education and distinguish between part-time integrated with full-time and part-time as separate free-standing provision. The latter model, which characterises the Open University offer and that of institutions like Birkbeck, University of London is also what characterises the part-time offer in FE Colleges. They have a tradition of providing day-release, evening and Saturday provision for people in work and significantly they also have a tradition of
This report provides an overview that will often pose new questions as it attempts to answer others. It has already been said that the data provides the opportunity for much more in-depth and specific analysis than is published in this report and more can be
learned from it about the progression behaviour of these learners from a sectoral, regional, demographic and institutional perspective. An example of a more detailed regional drill down can be found in a report based on the 2013 data sets on apprenticeship progression in London (Joslin & Smith, 2013b). Also recent research by Ipsos MORI evaluating
apprenticeships from both learner and employer perspectives (Ipsos MORI, 2014) and (Ipsos MORI, 2014a) provides very useful contextual information about progression. It shows, for example that apprentices are more likely to view their apprenticeship as a route to a career in what they call the “older” frameworks like Engineering and Construction, and that these frameworks at level 3 are also characterised as having the most amount and longest duration of training. Employers with advanced level apprentices in these
frameworks as well as Health, Public Services and Social Care were also more likely to offer a further qualification including higher apprenticeships, HNCs, foundation degrees and degrees. More needs to be done to investigate the relationships between the data around apprenticeship frameworks, attitudinal evidence and the effect of other factors such as age and gender and this will be explored in a future cohort update in this longitudinal series.
1.3 Research aims and objectives
The aim of the research was to provide robust and on-going longitudinal intelligence about the progression of advanced level apprentices into higher education that will inform
national and local policy.
This aim was to be delivered by meeting the following objectives:
analyse the progression into higher education of five cohorts of advanced level apprentices completing in the years 2005-06 to 2009-10;
provide a top level trend analysis of the matched data by age showing percentages progressing into both non-prescribed higher education and university;
provide further levels of analysis showing trends broken down by frameworks, provider types and regional variations;
undertake analysis of the data by domicile providing evidence of the impact apprenticeships are having on social mobility;
illustrate the potential of the research to provide local analyses at local authority, LEP (Local Enterprise Partnership), university, college, training provider and individual framework levels;
1.4 Methodology
The research findings are based on the matching of ILR (Individualised Learner Record) datasets 2005-06 to 2009-10 with HESA (Higher Education Statistics Agency) datasets between the years 2005-06 and 2011-12. They provide a detailed analysis of the nature of the progression of apprentices, trends in progression rates over time and highlight the contribution made by FE Colleges in delivering the sort of higher education to which many apprentices progress. Since the matched records contain demographic information about the apprentices such as gender, age and domicile and also data about where they
provide an overall picture of apprenticeship progression at this point in time. The research project is longitudinal. The aim is to continue to repeat the matching year on year to provide ever richer sets of data tracking the progression flows of this important group of part-time work-based learners.
The start date, rather than the end date, is used as a census point so that the timing of higher education entry can be better understood. It acknowledges that apprentices are rolled on and rolled off an apprentice framework and therefore the start date is deemed the most appropriate census date to determine the year of the cohort, especially as some apprentices appear to commence study of a higher education qualification in the same year as they are completing their framework.
Just fewer than 60% of advanced level apprentices complete their framework in two years, although achievement and completion is dependent on the framework structure and how long individual learners take to complete their work based learning. For example, around 60% of the 2005-06 cohort will have finished during 2006-07 and a further 24% finish in 2007-08.
Although the start date is used as a cohort census date, this study is based on advanced level apprentices who have completed and achieved their framework.
Tracking back, as well as forward, allows an investigation into the fluid nature of advanced level apprentice participation in higher education and shows the extent to which some apprentices already have experience of higher education when they first start their apprenticeship. Tracking forward to HESA datasets for advanced level apprentices who have been identified as having no previous higher education experience, enables the study to explore real progression from Level 3 to Level 4. Moreover, linking the cohort to higher education datasets longitudinally over a number of years, allows an investigation into the timing of entry to higher education. For example, all those advanced level
apprentices who completed (and were identified as achievers) in 2005-06, were linked to seven years of higher education datasets in 2005-06, 2006-07, 2007-08, 2008-09, 2009-10, 2010-11 and 2011-12. Advanced level apprentices who start their Level 4 qualification in the same year as their advanced level apprenticeship are counted as first time entrants and these records are included in the progression rates, categorised, with the following two years, as immediate progression.
1.4.1 Prior entry to higher education
The HESA datasets with records of prescribed higher education learners were tracked from 2003-04 although students who had entered higher education from 1999 were also flagged within the dataset. The Individualised Learner Records (ILR) were tracked from 2002-03. Tracking back to datasets prior to commencement of the apprentice framework provides a fuller picture of apprentice participation in higher education.
1.4.2 First time entrants
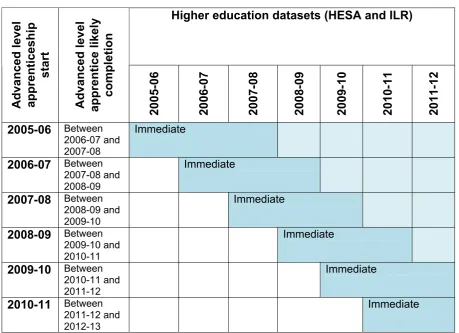
Immediate progression is classified as those apprentices who enter higher education three years from the start of their apprenticeship. Given that the average duration of an
advanced level apprenticeship is 24 months, this three year period includes those who enter in the same year as they are completing their apprenticeship and the year
[image:21.595.69.529.189.522.2]immediately following. The following table illustrates the longitudinal matching: Table 1: Cohort matching to establish progression
Higher education datasets (HESA and ILR)
Advanced level apprenticeship
start
Advanced level apprentice likely completion
2005-06 2006-07 2007-08 2008-09 2009-10 2010-11 2011-12 2005-06 Between
2006-07 and 2007-08
Immediate
2006-07 Between 2007-08 and 2008-09
Immediate
2007-08 Between 2008-09 and 2009-10
Immediate
2008-09 Between 2009-10 and 2010-11
Immediate
2009-10 Between 2010-11 and 2011-12
Immediate
2010-11 Between 2011-12 and 2012-13
Immediate
1.4.3 Dataset matching
Two datasets were used to undertake the tracking exercise: the Individualised Learner Record (ILR) for students recorded as advanced level apprentices in 2005-06, 2006-07, 2007-08, 2008-09, 2009-10 and 2010-11and the Higher Education Statistics Agency (HESA) dataset for entrants to publicly funded higher education institutions in the United Kingdom during 2005-06, 2006-07, 2007-08, 2008-09, 2009-10, 2010-11 and 2011-12. The Data Service provided records on learners on an advanced level apprentice
programme including name, date of birth, postcode, gender, and framework. Two matching exercises were undertaken to obtain the total number of learners who entered higher education study:
ILR Level 3 student data to HESA student data to identify FE Level 3 Students progressing to prescribed higher education study and
The absence of a unique learner number, which follows students from one provider to another, means that individual students were tracked within, and through, each of the datasets using a number of personal characteristics. A fuzzy matching exercise was undertaken by HESA where for each final year Level 3 student in the ILR dataset, the name, date of birth, postcode and gender was used by HESA to match against each year of their dataset. The ILR was matched to HESA datasets between 2003-04 and 2011-12. This enabled identification of students who were already in higher education prior to commencement of their advanced level apprenticeship. The HESA datasets were also checked back to 1999 to identify students who entered higher education for the first time after starting their advanced level apprenticeship thus producing a more accurate picture of progression. For first time entrants, this meant that the 2005-06 cohort was matched against seven years of HESA data: 2005-06, 2006-07, 2007-08, 2008-09, 2009-10, 2010-11 and 202010-11-12. HESA data for matched students on their first year of programme were returned including: higher education study year, higher education level, higher education subject group, higher education mode, higher education institution and higher education campus.
Similarly, for each advanced level apprentice completer a matching exercise was undertaken with the subsequent years FE Level 4 student data using either the ILR student unique reference, or name, date of birth, postcode and gender.
There were a number of issues encountered with both matching exercises: ILR to HESA issues
Fuzzy matching using all four student identifiers such as full name, date of birth, postcode and gender is fairly straightforward but sophisticated matching techniques were employed to match records where there were slight differences, eg. name spelling.
Some individuals were studying for a Level 3 FE programme at the same time and in the same year as studying a higher education programme. Only individuals who progressed from their apprenticeship to a higher education programme in a later year are included in the study.
ILR level 3 to ILR level 4 non-prescribed higher education issues
Not all students progressed to Level 4 study in FE at the same college and so a fuzzy matching exercise was undertaken using the four personal identifiers. The matched HESA dataset was then joined back to the ILR dataset so that for
2. Progression of apprentices to
higher education – headline figures
The overall findings for advanced level apprentices progressing into higher education for each of the cohorts are provided in this section.
Table 2 shows volumes of advanced level apprentices and the number who progressed by age group. It highlights the growth in the number of advanced level apprentices during the period (20,540) and particularly those aged over 25 years. The table also shows that the numbers entering higher education have increased: overall 1,200 more entered higher education from the 2009 cohort than those who entered from the 2005 cohort.
Table 2: Numbers: 2005 and 2009 tracked population and higher education entrants
2005‐06 Advanced level apprentices
2009‐10 Advanced level
apprentice Difference 2005 ‐ 2009 Age Group
Tracked Population
Number entering higher education
Tracked Population
Number entering higher education
Tracked population
Number entering higher education
17-19 years 22380 2895 26310 3195 3930 300
20-24 years 10705 980 15530 1265 4825 285
25+ 185 15 11975 635 11790 620
Grand total 33275 3895 53815 5095 20540 1200
Table 3 shows the cumulative rates of progression into higher education for each of the six cohorts of apprentices. It tracks in-year progression where apprentices progress to higher education in the same year as they completed their apprenticeship and it shows the
numbers progressing for each subsequent year. This pattern of progression of
apprentices must be set in the context of their lives – these are people in work and on completion of their advanced level apprenticeship, there may be pressure on them to operate at the technician level they have been trained for. However the rapid pace of change in some industries and the requirements of regulatory frameworks in others will influence decisions of both employees and employers to undertake higher education. The fact that progression rates are higher two years after completion for each year up to 2008-09 shows that for many decisions about higher education are taken later and the lower, but still fairly substantial numbers progressing after three and four years show this pattern. These numbers may also reflect those students who decide to take another career pathway.
25+ advanced level apprentices over these years and the fact that this group of learners have a lower progression rate than younger apprentices. This is illustrated in Figure 1. Table 3: Longitudinal progression of advanced level apprentices
2005 -06 2006 -07 2007 -08 2008 -09 2009 -10 2010 -11 2011
-12 3 years
tracking All tracked to date
Adva nced le vel appren ti ceship star t Year Population Nu mber Nu mber Nu mber Nu mber Nu mber Nu mber Nu mber Immediate higher educa tion pr ogressio n % High er ed ucation progre ssion Total nu mbe r to higher educ ation % High er ed ucation progre ssion Nu mber o f y ears tr ack ed
2005-06 33285 505 1510 1885 830 650 520 360 3900 11.7% 6255 18.8% 7 yrs
2006-07 35525 475 1525 1995 965 685 445 3995 11.2% 6090 17.1% 6 yrs
2007-08 41370 465 1625 2450 1000 620 4540 11.0% 6160 14.9% 5 yrs
2008-09 49360 555 2180 2165 990 4900 9.9% 5890 11.9% 4 yrs
2009-10 53815 755 2350 1990 5095 9.5% 5095 9.5% 3 yrs
2010-11 26430* 465 2390 na na 2855 10.8% 2 yrs
*NB - It takes most apprentices at least two years to complete their framework and so this population does not include those who started in 2010 but have not yet completed. The cohort populations will change in updates as apprentices who complete their framework are included in the tracking study.
Figure 1 shows immediate higher education progression rates for each of the five cohorts tracked for three years into higher education by age group. The line graph clearly
illustrates the stable progression rate of the younger age group compared to a falling progression rate for the older 25+ age group. This age group has seen a particular growth in the number of advanced level apprentices but higher education progression trends show that with this growth the proportion of students entering higher education has not been maintained. The higher progression rate observed for the earlier cohort of 2005 25+ advanced level apprentices is inflated by the small population of 185 combined with the fact that only 25 frameworks are represented by this group. Furthermore, at least a quarter of the 2005 cohort were on a Health & Social Care framework. This compares to the 2009 cohort of 25+ learners, a much larger number of 11,975 who are represented in 74
It is noted that although the number of younger advanced level apprentices has also grown across the tracked cohort years, albeit to a lesser extent, the higher education progression rate has remained stable.
Figure 1: Immediate higher education progression rates by age group
Figure 2 illustrates the part that both FE Colleges and Universities play in delivering higher education to advanced level apprentices who progress. The chart shows that up until the 2008-09 cohort, a higher proportion of students progressed to higher vocational education in FE colleges than to higher education in universities. However, in 2009-10 that changed and universities delivered to a higher number of advanced level apprentices. This may be influenced by the increase in admissions of learners with BTEC qualifications into
3. Characteristics of advanced
level apprentices
In this part of the report, characteristics of the advanced level apprentice cohorts tracked in this study are presented followed by an investigation into the rate and pattern of prior progression from intermediate apprenticeships and also their previous experience of higher education. The number of apprentice starts has grown considerably since 2005 but the numbers in different frameworks have grown unevenly resulting in a change in the profile of advanced level apprentices across each of the tracked years. By presenting each of the tracked cohorts in terms of their characteristics including age, gender,
framework and domicile, a context for progression is provided where progression patterns can be explained in part by the changing nature of the cohorts across the five years. Also in the section is an exploration of progression in terms of whether some apprentices may previously have studied at an intermediate level and those who may also have studied at a higher level but then come onto an advanced level framework. In the previous report of this series, (Joslin & Smith, 2013) it was apparent that the educational journey of
apprentices can be quite complex with some apprentices undertaking frameworks offering level 3 qualifications for the first time but others already having qualifications at level 3 or higher who have changed pathways through employment and are undertaking a further level 3 qualification as part of their apprenticeship.
3.1 Key characteristics of the advanced level apprentice cohorts in
this study
Tables 4 to 9 show that:
The number of female advanced level apprentices has more than doubled. All age groups saw an increase but the growth was inflated by in the large increase in females aged 25+. Although the number of males also increased, the growth was much lower than females. There was very little change in the number of 17-19 year old males but a large increase in the number of advanced level apprentice males over 25. (Table 4).
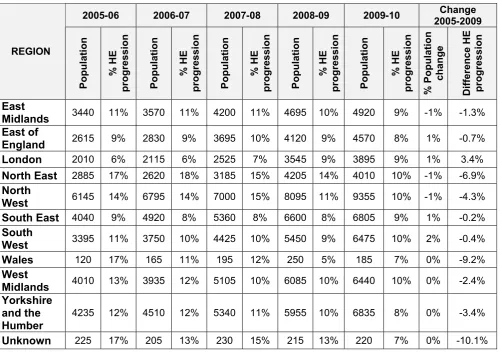
Numbers of advanced level apprentices have increased in every region in England. (Numbers reflect the home region of the apprentice). London and the South West have seen the highest growth in numbers of advanced level apprentices across each of the tracked years. The West Midlands, the North West and the North East have the lowest increase in numbers. (Table 5).
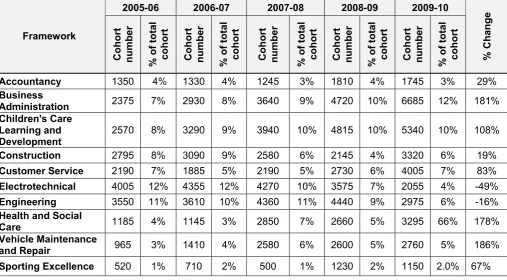
Framework numbers show that the biggest growth has been with Business Administration, Children’s Care, Learning & Development, Health & Social Care, Vehicle Maintenance & Repair and Sporting Excellence. Meanwhile, the numbers in Engineering and Electrotechnical tracked in this study have declined. (Table 6). The disadvantaged profile of advanced level apprentices has not changed, around
22% of apprentices are classified as living in a low higher education participation area and this proportion has remained steady across the cohorts. (Table 7).
Increases in numbers were seen across all provider types apart from the Other
cohort years and Businesses (Direct Grant) and Private Training Providers had the highest growth. (Table 8).
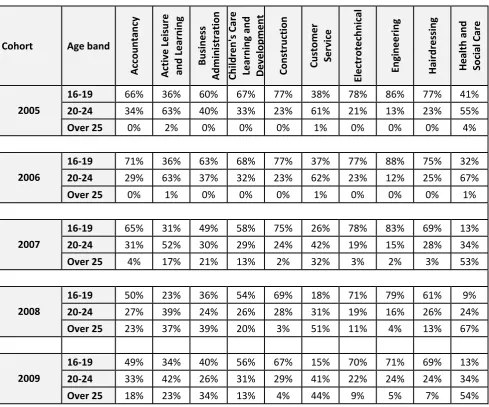
A framework and age breakdown for the top ten frameworks shows a shift in the age composition at framework level. In 2005-06, 41% of those on a Health & Social Care framework were aged 17-19 but this dropped to just 13% for the 2009-10 cohort. Similarly, in Engineering, 86% of the 2005-06 cohort was aged 17-19 years but by 2009-10, 71% were profiled in this age category. Larger numbers of older advanced level apprentices will influence progression patterns and a change in age composition should be considered alongside the HE progression rate trends
[image:28.595.52.549.265.467.2]presented later in the report. (Table 9). Table 4: Age and gender
Advanced Level Apprentice cohort in the tracking study
Gender Age 2005 2006 2007 2008 2009
Difference 2005 and
2009 % growth
17-19 7275 8450 8240 8785 10735 3460 48%
20-24 5385 5955 6170 6240 8390 3005 56%
Over 25 95 60 4300 9145 8330 8235 8668%
Female
Total 12755 14465 18710 24175 27455 14700 115%
17-19 15105 15570 15665 15505 15575 470 3%
20-24 5320 5435 5520 5710 7140 1820 34%
Over 25 90 50 1470 3960 3645 3550 3944%
Male
Total 20515 21060 22650 25175 26360 5840 28% Grand total 33275 35520 41360 49350 53815 20540 62%
Table 5: Regional distribution of advanced level apprentice cohorts
2005-06 2006-07 2007-08 2008-09 2009-10
Framework
Population %
of total
population Population %
of total
population Population %
of total
population Population %
of total
population Population %
of total
population % Population
change
East Midlands 3440 10% 3570 10% 4200 10% 4695 10% 4920 9% 43% East of England 2615 8% 2830 8% 3695 9% 4120 8% 4570 8% 75% London 2010 6% 2115 6% 2525 6% 3545 7% 3895 7% 94% North East 2885 9% 2620 7% 3185 8% 4205 9% 4010 7% 39% North West 6145 18% 6795 19% 7000 17% 8095 16% 9355 17% 52% South East 4040 12% 4920 14% 5360 13% 6600 13% 6805 13% 69% South West 3395 10% 3750 11% 4425 11% 5450 11% 6475 12% 91% West Midlands 4010 12% 3935 11% 5105 12% 6085 12% 6440 12% 61% Yorkshire and
[image:28.595.57.546.522.769.2]Table 6: Advanced level apprentice cohorts in the study by Framework (top frameworks in terms of apprentice numbers)
2005-06 2006-07 2007-08 2008-09 2009-10
Framework Cohor t numb er %
of total cohor
t Cohor t numb er %
of total cohor
t Cohor t numb er %
of total cohor
t Cohor t numb er %
of total cohor
t Cohor t numb er %
of total cohor
t
% Ch
ange
Accountancy 1350 4% 1330 4% 1245 3% 1810 4% 1745 3% 29% Business
Administration 2375 7% 2930 8% 3640 9% 4720 10% 6685 12% 181% Children's Care
Learning and
Development 2570 8% 3290 9% 3940 10% 4815 10% 5340 10% 108% Construction 2795 8% 3090 9% 2580 6% 2145 4% 3320 6% 19% Customer Service 2190 7% 1885 5% 2190 5% 2730 6% 4005 7% 83% Electrotechnical 4005 12% 4355 12% 4270 10% 3575 7% 2055 4% -49% Engineering 3550 11% 3610 10% 4360 11% 4440 9% 2975 6% -16% Health and Social
Care 1185 4% 1145 3% 2850 7% 2660 5% 3295 66% 178% Vehicle Maintenance
and Repair 965 3% 1410 4% 2580 6% 2600 5% 2760 5% 186% Sporting Excellence 520 1% 710 2% 500 1% 1230 2% 1150 2.0% 67%
Table 7: Disadvantaged profile of advanced level apprentices
2005-06 2006-07 2007-08 2008-09 2009-10
POLAR3 quintile
population
% of
population population
% of
population population
% of
population population
% of
population population
% of population Change 2009-2005 Q1 -
Disadvantaged 7225 22% 7690 22% 9275 23% 10840 22% 11995 22% 66%
Q2 7925 24% 8105 23% 9485 23% 11230 23% 12365 23% 56%
Q3 6935 21% 7665 22% 8845 21% 10430 21% 11450 21% 65%
Q4 6270 19% 6885 19% 7740 19% 9435 19% 10095 19% 61%
Q5 -
[image:29.595.57.557.463.667.2]Table 8: Advanced level apprentice cohort numbers by provider type
Advanced level apprentice cohort population Provider type
2005-06 2006-07 2007-08 2008-09 2009-10
% Change
2005 -2009
Businesses (Direct Grant) 4085 3860 4955 6385 7545 85%
FE College 7955 9740 10055 12400 13415 69%
Other e.g. charities 3865 3645 3235 3120 2530 -35%
Public Sector 1330 1040 1340 1675 1875 41%
Private Training Provider 15810 16870 21660 25750 28420 80%
Grand total 33285 35525 41370 49360 53815 62%
Table 9: Top ten frameworks and age band breakdown
Cohort Age band
Accountancy Active Leisure and Lear ning Business Administrati on Children's Car e Lear ning an d Develo p ment Cons tructi on Customer Service Electr otechni cal Engine ering Hair dressi ng Heal th and Social Care
16‐19 66% 36% 60% 67% 77% 38% 78% 86% 77% 41%
20‐24 34% 63% 40% 33% 23% 61% 21% 13% 23% 55%
2005
Over 25 0% 2% 0% 0% 0% 1% 0% 0% 0% 4%
16‐19 71% 36% 63% 68% 77% 37% 77% 88% 75% 32%
20‐24 29% 63% 37% 32% 23% 62% 23% 12% 25% 67%
2006
Over 25 0% 1% 0% 0% 0% 1% 0% 0% 0% 1%
16‐19 65% 31% 49% 58% 75% 26% 78% 83% 69% 13%
20‐24 31% 52% 30% 29% 24% 42% 19% 15% 28% 34%
2007
Over 25 4% 17% 21% 13% 2% 32% 3% 2% 3% 53%
16‐19 50% 23% 36% 54% 69% 18% 71% 79% 61% 9%
20‐24 27% 39% 24% 26% 28% 31% 19% 16% 26% 24%
2008
Over 25 23% 37% 39% 20% 3% 51% 11% 4% 13% 67%
16‐19 49% 34% 40% 56% 67% 15% 70% 71% 69% 13%
20‐24 33% 42% 26% 31% 29% 41% 22% 24% 24% 34%
2009
3.2 Progression from intermediate apprenticeships to advanced level
apprenticeships
The Individualised Learning Record datasets were linked across years from 2004-05 to 2010-11 to track back those advanced level apprentices who were recorded as studying an intermediate apprentice or NVQ at level 2 in the ILR. 2004-05 is the first year that apprentices were classified in the ILR and so the 2005-06 advanced level apprentice cohort is only linked back one year to identify whether they were a level 2 apprentice. For subsequent cohorts, however, the study was able to link back a number of years; for example, the 2009-10 cohort is linked back through five years of intermediate apprentice datasets to 2004-05. Due to this, the progression rate of the 2009-10 cohort gives the highest reported proportion of advanced level apprentices previously on an intermediate framework. However, trend analysis is likely to be skewed for the early advanced level apprentice cohorts.
It is important to note that this linking exercise across ILR datasets to identify intermediate apprentices progressing onto a level 3 advanced level apprenticeship did not identify whether the apprentice may already have had a level 3 qualification before starting their apprenticeship framework. The BIS prior attainment study mentioned on page 16 (BIS, 2011) found that around half of level 3 apprentices already had a level 3 qualification. This suggests that the advanced level apprenticeship does not necessarily provide evidence of up-skilling in terms of qualification achievement for many learners. It does however
provide evidence of up-skilling in terms of apprentice framework achievement, indicating the proportion of students progressing through apprenticeships to a higher level of framework study.
In the next section, this report also examines the extent to which advanced level
apprentices may already have a higher level qualification at level 4, 5 or 6 suggesting that the apprentice framework is offering higher level qualifications for some learners but for a small group of learners frameworks are providing additional qualifications in a specific subject area linked to a career path.
The prior attainment of apprentices is explored in some depth in the BIS study “Prior Qualifications of Adult Apprentices 2011-2012” (BIS, 2011) and this also illustrates the complexity of apprentice progression.
Table 10: Progression to advanced level apprenticeships from intermediate apprenticeships (2009-10 cohort updated)
Age band Number of advanced level apprentices
Number who studied an intermediate
apprenticeship % progression
16-19 26310 16050 61.0%
20-24 15530 9475 61.0%
Over 25 11975 2995 25.0%
Grand total 53815 27985 52.0%
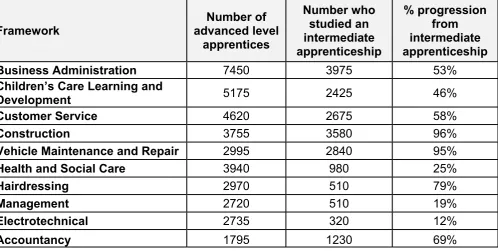
Table 11 presents figures to show that some frameworks have higher progression from intermediate to advanced level apprenticeships showing that students on some
frameworks are more likely to have undertaken an intermediate apprentice than students in other frameworks. The majority of advanced level apprentices on a management framework start on an advanced level framework rather than an intermediate one as do those on an Electrotechnical framework. Conversely, the majority of Construction advanced level apprentices start on an intermediate framework before progressing to advanced level. The differences are stark but reflect framework pathways. For example, there is no intermediate apprentice framework for Management whilst students on
[image:32.595.61.560.516.767.2]technical frameworks such as Construction will typically start on an intermediate apprenticeship framework (and this may be a reason why apprentices in Construction were more likely to see it as a career route (Ipsos MORI, 2014).
Table 11: Progression from intermediate apprenticeships to advanced level apprenticeships for ten frameworks
Framework
Number of advanced level
apprentices
Number who studied an intermediate apprenticeship
% progression from intermediate apprenticeship
Business Administration 7450 3975 53%
Children’s Care Learning and
Development 5175 2425 46%
Customer Service 4620 2675 58%
Construction 3755 3580 96%
Vehicle Maintenance and Repair 2995 2840 95%
Health and Social Care 3940 980 25%
Hairdressing 2970 510 79%
Management 2720 510 19%
Electrotechnical 2735 320 12%
3.3 Progression
from
intermediate apprenticeships through to
advanced level apprenticeships and onto higher education.
Figure 3 looks at higher education progression rates for five advanced level apprentice cohorts who were tracked for three years. It shows the proportion of advanced level apprentices who were identified as intermediate apprentices and who then progressed to higher education. The progression rate for all the cohorts is similar at around 8%.
Figure 3: Immediate progression (tracked for three years)
3.4 Previous experience of higher education and apprenticeships
By linking advanced level apprentice records to previous years’ higher education datasets, a picture of prior higher education experience emerges, showing the extent to which some advanced level apprentices (who already have Level 3 qualifications) had already entered higher education prior to commencing their advanced level apprentice framework. This was explored for a 2004-05 cohort in the previous report published by BIS (Joslin & Smith, 2013) tracking students to higher education up to 2010.
In this cohort update, the tracking continues to reveal the different journeys that advanced level apprentices students undertake where around 3% have already had prior experience of higher education. As in the 2010 study, some have achieved a higher education
qualification then later started an advanced level apprenticeship; more often than not this is due to a complete change in career area and is evidenced where the higher education subject choice does not correspond with the apprentice framework. Another group of students will have started higher education but not completed their programme and then subsequently found employment which included an advanced level apprenticeship. Through some real life cases the vignettes below help to illustrate of the complexity of advanced level apprentice progression.
Student X - at the age of 18 this individual enters higher education to study a Psychology degree but does not complete their qualification. Three years later at the age of 21,
student X starts an advanced level apprentice in Business Administration.
Student Y - studied Biology at University at age 19 and completed their Degree before starting an Electrotechnical advanced level apprenticeship at age 22.
4. Trends in the progression of
apprentices over five years (2005-06
to 2009-10)
This section looks at the progression trends of five cohorts of advanced level apprentices where rates of progression can be compared over three years.
It is important to reiterate here that the number in the tracked population should not be confused with the numbers reported in the Statistical First Release