Colour polymorphism and its role in stress tolerance in the coral Acropora millepora on the Great Barrier Reef
247
0
0
Full text
(2) Colour polymorphism and its role in stress tolerance in the coral Acropora millepora on the Great Barrier Reef . Thesis submitted by Allison Susanna PALEY (BSc, GDipResMeth) in February 2014 . for the degree of Doctor of Philosophy in Marine Biology within the School of Marine and Tropical Biology and the ARC Centre of Excellence for Coral Reef Studies James Cook University . .
(3) STATEMENT OF ACCESS . I, the undersigned, the author of this thesis, understand that James Cook University will make this thesis available for use within the University Library and, via the Australian Digital Thesis network (unless granted an exemption), for use elsewhere.. I understand that, as an unpublished work, a thesis has significant protection under the Copyright Act, and I wish the following restrictions to be placed on this work:. All users consulting this thesis will have to sign the following statement:. In consulting this thesis I agree not to copy or closely paraphrase it in whole or part without the written consent of the author; and to make proper public written acknowledgement for any assistance which I have obtained from it.. Beyond this, I do not wish to place any restrictions on access to this thesis.. 17/2/14 ____________________________ (Allison Susanna Paley). ___________________ (Date). 2.
(4) STATEMENT ON SOURCES DECLARATION . . I declare that this thesis is my own work and has no been submitted in any form for another degree of diploma at any university or other institution of tertiary educations. Information derived from the published or unpublished work of others has been acknowledged in the text and a list of references is given.. 17/2/14 ____________________________ (Allison Susanna Paley). ___________________ (Date). 3.
(5) STATEMENT OF CONTRIBUTION OF OTHERS. This work is the result of collaborations with my supervisors, Prof. Bette Willis, Dr. Line Bay and Dr. Madeleine van Oppen, who provided intellectual and editorial guidance throughout the research project. I also worked in collaboration with Prof. Mikhail Matz and Dr. Dave Francis who provided assistance in data analyses and statistical support of Chapters 2 and 6, respectively. Research funding was provided by the Australian Research Council’s Centre of Excellence for Coral Reef Studies and James Cook University. In addition I received a stipend from James Cook University which was co-funded through a Postgraduate Research Scholarship and a Tutorship scholarship from the School of Marine and Tropical Biology. In Chapter 2 Dr. Mikhail Matz provided empirical data on the individual emissions of fluorescent proteins from Acropora millepora colonies which were used to validate the model of fluorescent protein concentrations.. 4.
(6) ACKNOWLEDGEMENTS . I would like to thank my supervisors, Bette Willis, Line Bay and Madeleine van Oppen, without whom this research would have not been possible. A special thank you to Bette for her invaluable critique of my writing style and for carefully taking the time to teach me how to express my ideas clearly. Her continued support of my research is the sole reason I expanded my work from an MSc into a PhD and I will forever be indebted to her for this encouragement. I would like to thank Line for always finding time to encourage and support me through the many years. Also a big thank you for coming into the field with me, for showing me the wonders of data analysis in R, and for taking great care in ensuring I did my data justice. I would also like to thank Madeleine for her continued guidance as we expanded the project and for her thoughtful comments on drafts of my work.. A big thank you to Dave Francis who spent countless hours explaining the world of lipid extraction and separation. The combination of your patience, good humour and expertise made working with you my most enjoyable collaboration during my PhD. Thanks are especially due to Misha Matz, for knowing more about coral fluorescent proteins than any person should! Your insatiable enthusiasm for the field of coral spectroscopy has always been inspiring and continued to keep me motivated. Thank you for your patience.. I am greatly indebted to the staff, past and present, at Orpheus Island Research Station for their endless support and availability in helping me complete lengthy experiments. 5.
(7) while based both at the station and remotely. Your friendship and support (both physical and emotional) will always be cherished.. Thank you to my fellow Willis lab-mates for continuing to impress and inspire me, and for keeping me on my toes! Your friendship and camaraderie throughout has made this experience truly worthwhile.. Many thanks to friends/colleagues who. accompanied me on field trips and pushed themselves physically to achieve my goals. Thank you also to my friends and family in Townsville and abroad for your support through all the years. And a very heartfelt thank you to my partner (and now fiancé) Aaron, for always reminding me about the world outside of academia. I can’t wait for all the new adventures to come.. I dedicate this thesis to my parents, Kathleen and Steve. Thank you for instilling in me a sense of curiosity for the world around me, and the autonomy to allow me to pursue my dreams, however far away from home it took me.. 6.
(8) General Abstract The roles of colour and fluorescence in animal species are wide-ranging, but their roles in non-bioluminescent corals remain unresolved, particularly the question of whether or not fluorescent proteins (FPs) in coral tissues have a photoprotective function. Knowledge of the mechanisms corals use to combat stress associated with a changing climate is paramount to predictions of the persistence and management of the coral reef ecosystem. Through a combination of field-based monitoring and controlled experiments, I investigate the role of FPs in corals, using the common coral Acropora millepora, which is comprised of four distinct colour morphs, as a model species. Variation in the proportional abundance patterns of intraspecific colour morphs of A. millepora among widely separated populations provides clues about their comparative performance under different environmental conditions. In Chapter 2, I document patterns in the abundance and distribution of the four colour morphs in populations of A. millepora located in northern, central and southern Great Barrier Reef (GBR) regions. The highly fluorescent green morph was rare at all sites, despite the postulated advantage of FPs in stress tolerance. Moreover, patterns in the relative abundance of colour morphs were similar across latitudinal regions, depths, and wave regimes. Highly conserved patterns in colour morph abundance across a range of environmental gradients suggest that, in general, environmental parameters are not responsible for patterns in the distribution and abundance of colour morphs in this species. Results presented in Chapter 2 also quantify, for the first time, relative. 7.
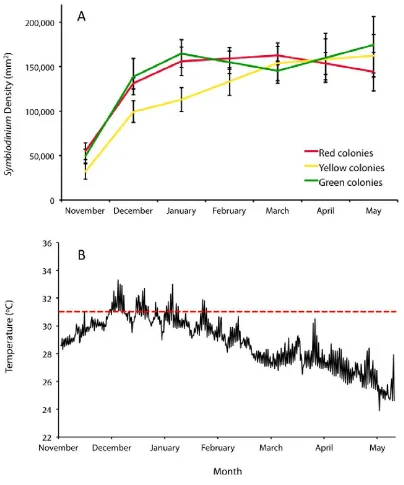
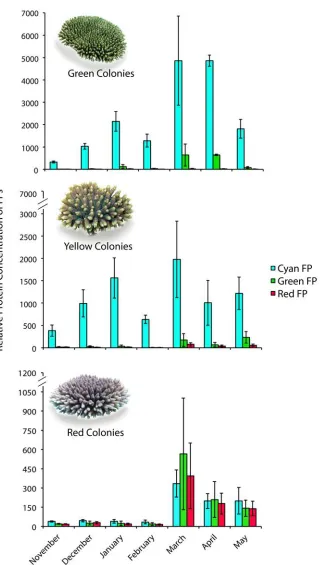
(9) concentrations of the three common fluorescent proteins and one non-fluorescent protein in tissues of A. millepora colour morphs. Total FP concentrations differed among colour morphs, with the highly fluorescent green morph containing up to 7fold greater concentrations of the Cyan FP (CFP) than the weakly fluorescent red morph. In all morphs, the most abundant FP was CFP, which was present in concentrations that were up to 1600-fold higher at less turbid northern sites compared to more turbid southern sites, a pattern consistent with a role in photoprotection. Variation in FP concentrations among colour morphs revealed in this study also indicate that colour is a function of the proportional abundance of the 3 FPs rather than a reflection of the FP in highest concentration. Despite high expression levels of FPs in corals (up to 14% of total protein) and the various important functions ascribed to these proteins, baseline information on temporal variation within coral populations remains undocumented. In Chapter 3, I document FP content in Acropora millepora colour morphs in response to temporal (seasonal) environmental variation. CFP was the only FP to significantly fluctuate in abundance among colour morphs and between sampling times, presumably representing cyclical maintenance of optimal protein levels, given the lengthy halflives of these proteins. Of 150 colonies monitored in-situ, five (~3%) changed colour within a four-month timeframe. Colour change from a highly fluorescent green morph to a weakly fluorescent red morph corresponded with declining health, suggesting that maintenance of high concentrations of FPs in coral tissues is energetically costly. Understanding the mechanisms that underpin variation in bleaching susceptibility in corals is central to the conservation of reefs, particularly in light of predictions of continued ocean warming. In Chapters 4 and 5, I analyse the bleaching condition of three colour morphs of A. millepora, each characterised by different FP. 8.
(10) levels, following both a moderate bleaching event in the northern GBR and experimental heat stress in the central GBR. In both studies, fragments of the highly fluorescent green morph had greater bleaching resilience to thermal stress compared with the weakly and intermediately fluorescent red and yellow morphs. This is the first demonstration of differential susceptibility to temperature stress among fluorescent colour morphs from similar habitats, and highlights the functional importance of subtle intraspecific differences in FP content. Substantial variation in the response of colour morphs to thermal stress confirmed that high abundance of FPs correlates well with high thermal stress tolerance and highlights the contribution of host-mediated mechanisms in governing the bleaching susceptibility of corals. Despite the advantages of greater tissue concentrations of coral FPs, the highly fluorescent green morph is consistently rare across a variety of habitat types and following major thermal disturbances. Although coral FPs are long-lived, this unexpected pattern in abundance suggests that maintenance of high FP concentrations may come at the cost of other physiological processes, resulting in the low abundance of the green morph across the GBR. In Chapter 6, I investigated the capacity of A. millepora colour morphs to produce FPs under a prolonged period of resource deprivation in the months leading up to their annual reproductive event. Comparisons of investment in reproduction among healthy (control) colour morphs and their starving counterparts leads me to propose that a physiological trade-off exists between investment of resources in the production of FPs versus reproduction.. Weakly. fluorescent red colonies invested more heavily in reproduction, as indicated by their significantly higher concentrations of wax esters, than highly fluorescent green colonies. Greater investment in reproduction by red colonies corroborates the highly conserved pattern of consistently greater abundance of the red morph in populations. 9.
(11) of A millepora, and would explain the low abundance of green colonies despite the environmental advantages of containing higher concentrations of coral FPs.. 10.
(12) Table of Contents Acknowledgements………………………………………………………………………………………………5 General Abstract …………………………………………………………………………………………………7 Chapter 1 . General Introduction: An Introduction to fluorescence in corals ....18 . . 1.1 . The phenomenon of fluorescence………….……………………………18 . 1.2 . GFP, GFP-‐homologs and chromoproteins ……………………………21 . 1.3 . Coral colouration and the role of coral FPs………………………….23 . 1.4 . Coral colour polymorphism and stress tolerance ..………………26 . 1.5 . Acropora millepora: a model coral ………………………………………30 . 1.6 . Study aims and objectives ……………………………………………………33 . . Chapter 2 . The causes of colour in the common Indo-‐Pacific coral Acropora millepora from the Great Barrier Reef ….………………………………………36 . . 2.0 . Abstract…………………………………………………………………….…………38 . . 2.1 . Introduction…………………………………………………………………….....39 . . 2.2 . Materials and Methods……………………………………………………….41 . . 2.3 . Results…………………………………………………………………………………50 . . 2.4 . Discussion……………………………………………………………………………59 . Chapter 3 . Seasonal variability in fluorescent and non-‐fluorescent protein levels in Acropora millepora colour morphs…………………………….……….….…69 . . 3.0 . Abstract……………………………………………..……………………………..…71 . . 3.1 . Introduction……………………………………………………………………..….72 . . 3.2 . Materials and Methods………………………………………………………..74 . 11.
(13) . 3.3 . Results………………………………….…………………………………..……..….82 . . 3.4 . Discussion…………………………………………………………………………...96 . Chapter 4 . Bleaching condition varies among Acropora millepora colour morphs in the northern Great Barrier Reef………………………………………………103 . . 4.0 . Abstract………………………………………………………………………….….105 . . 4.1 . Introduction…………………………………………………………………….…106 . . 4.2 . Materials and Methods……………………………………………….……..107 . . 4.3 . Results………………………………………………………………………….……111 . . 4.4 . Discussion……………………………………………………………………….…113 . Chapter 5 . Bleaching susceptibility differs among Acropora millepora colour morphs exposed to experimental heat stress………………………………119 . . 5.0 . Abstract……………………………………………………………………………..121 . . 5.1 . Introduction……………………………………………………………………….122 . . 5.2 . Materials and Methods………………………………………………………125 . . 5.3 . Results……………………………………………………………………………….137 . . 5.4 . Discussion………………………………………………………………………….156 . Chapter 6 . The consequences of coral colour: high FP concentration versus reproductive fitness…………………………………………………………………..164 6.0. . Abstract…………………………………………………………………………….166 . . 6.1 . Introduction………………………………………………………………………167 . . 6.2 . Materials and Methods……………………………………………………..171 . . 6.3 . Results……………………………………………………………………………….179 . . 6.4 . Discussion………………………………………………………………………….194 . 12.
(14) Chapter 7 . General Discussion: Coral colour/FPs as useful bio-‐indicators......201 . . 7.1 . The A. millepora FP complement and its relationship with . colony colouration and the ecology of colour polymorphisms……...201 . 7.2 . The role of FPs in the variable thermal tolerances of coral . colour morphs …………………………………….………………………………….……204 . 7.3 . The consequences of coral colour: fluorescence at the . expense of fitness?...........................................................................207 . 7.4 . Maintenance of colour polymorphism in populations of A. . millepora…………………………………………………………………………..…………..210 7.5 . Recommendations for future directions in the field of coral . fluorescence………………………………………………………………………………….211 7.6 Concluding remarks…………………………………………………………………212 Appendix ………………………………………………………………………………………………………….214 Literature Cited……………………….………………………………………………………………………..216 . . 13.
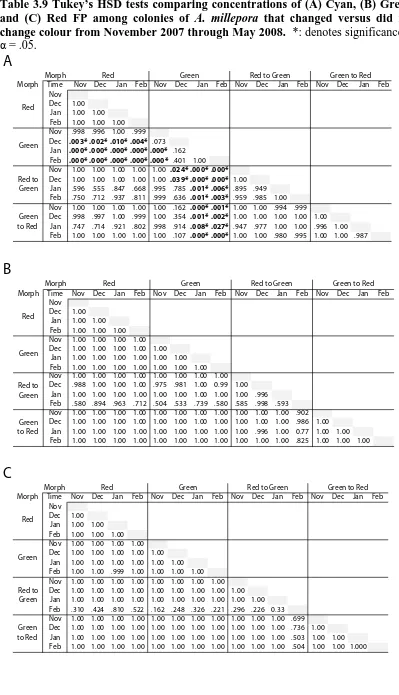
(15) List of Tables Chapter 1 Table 1.1 ………………………………………………………………..…………28 Chapter 2 Table 2.1 ………………………………………………………………..…………51 Table 2.2 ………………………………………………………………..…………52 Table 2.3 ………………………………………………………………..…………55 Table 2.4 ………………………………………………………………..…………55 Table 2.5 ………………………………………………………………..…………56 Table 2.6 ………………………………………………………………..…………56 Table 2.7 ………………………………………………………………..…………58 Table 2.8 ………………………………………………………………..…………58 Table 2.9 ………………………………………………………………..…………60 Table 2.10 ……..………………………………………………………..………..61 Table 2.11………………………………………………………………..………..61 Chapter 3 Table 3.1 ………………………………………………………………..…………84 Table 3.2 ………………………………………………………………..…………84 Table 3.3 ………………………………………………………………..…………85 Table 3.4 ………………………………………………………………..…………88 Table 3.5 ………………………………………………………………..…………90 Table 3.6 ………………………………………………………………..…………90 Table 3.7 ………………………………………………………………..…………91 Table 3.8 ………………………………………………………………..…………94 Table 3.9 ………………………………………………………………..…………95 Chapter 4 Table 4.1 ………………………………………………………………..…………115 Table 4.2 ………………………………………………………………..…………115 Chapter 5 Table 5.1 ………………………………………………………………..…………132 14.
(16) Table 5.2 ………………………………………………………………..…………132 Table 5.3 ………………………………………………………………..…………142 Table 5.4 ………………………………………………………………..…………143 Table 5.5 ………………………………………………………………..…………146 Table 5.6 ………………………………………………………………..…………146 Table 5 .7 ………………………………………………………………..…………151 Table 5.8 ………………………………………………………………..…………151 Table 5.9 ………………………………………………………………..…………153 Table 5.10 ………………………………………………………………..….……153 Table 5.11 ……………………………….……………………………..…………155 Table 5.12 ………………………………………………………………..…….…155 Chapter 6 Table 6.1 ………………………………………………………………..…………182 Table 6.2 ………………………………………………………………..…………184 Table 6.3 ………………………………………………………………..…………184 Table 6.4 ………………………………………………………………..…………184 Table 6.5 ………………………………………………………………..…………187 Table 6.6 ………………………………………………………………..…………187 Table 6.7 ………………………………………………………………..…………190 Table 6.8 ………………………………………………………………..…………191 Table 6.9 ………………………………………………………………..…………193 Table 6.10 .……………………………………………………………..…………193 . 15.
(17) List of Figures Chapter 1 Figure 1.1 ………………………………………………………………..…………20 Figure 1.2 ………………………………………………………………..…………24 Figure 1.3 ………………………………………………………………..…………32 Chapter 2 Figure 2.1 ………………………………………………………………..…………43 Figure 2.2 ………………………………………………………………..…………45 Figure 2.3 ………………………………………………………………..…………48 Figure 2.4 ………………………………………………………………..…………53 Figure 2.5 ………………………………………………………………..…………58 Figure 2.6 ………………………………………………………………..…………60 Chapter 3 Figure 3.1 ………………………………………………………………..…………78 Figure 3.2 ………………………………………………………………..…………79 Figure 3.3 ………………………………………………………………..…………79 Figure 3.4 ………………………………………………………………..…………83 Figure 3.5 ………………………………………………………………..…………83 Figure 3.6 ………………………………………………………………..…………85 Figure 3.7 ………………………………………………………………..…………89 Figure 3.8 ………………………………………………………………..…………90 Figure 3.9 ………………………………………………………………..…………93 Chapter 4 Figure 4.1 ………………………………………………………………..…………109 Figure 4.2 ………………………………………………………………..…………112 Figure 4.3 ………………………………………………………………..…………116 Chapter 5 Figure 5.1 ………………………………………………………………..…………126 Figure 5.2 ………………………………………………………………..…………127 Figure 5.3 ………………………………………………………………..…………128 16.
(18) Figure 5.4 ………………………………………………………………..…………132 Figure 5.5 ………………………………………………………………..…………139 Figure 5.6 ………………………………………………………………..…………140 Figure 5.7 ………………………………………………………………..…………141 Figure 5.8 ………………………………………………………………..…………143 Figure 5.9 ………………………………………………………………..…………144 Figure 5.10 ………………………………………………………………..……….147 Figure 5.11 ………………………………………………………………..….……150 Figure 5.12 ………………………………………………………………..….……152 Figure 5.13 ………………………………………………………………..….……154 Chapter 6 Figure 6.1 ………………………………………………………………..…………172 Figure 6.2 ………………………………………………………………..…………181 Figure 6.3 ………………………………………………………………..…………183 Figure 6.4 ………………………………………………………………..…………185 Figure 6.5 ………………………………………………………………..…………186 Figure 6.6 ………………………………………………………………..…………189 Figure 6.7 ………………………………………………………………..…………192 Appendix . Figure S1 ………………………………………………………………..…………..214 . . Figure S2 .………………………………………………………………..……..…..215 . 17.
(19) Chapter 1 An introduction to fluorescence in corals Corals exhibit prominent colour variation, ranging from fluorescent green and blue to red and non-fluorescent purple (Mazel 1995; Mazel 1997; Veron 2000). Many species display a number of colour types or morphs (Veron 1986; Salih et al. 2000; Field et al. 2006; Leutenegger et al. 2007; Oswald et al. 2007). It is now wellaccepted that fluorescent proteins (FPs) produced by the coral host, in combination with the presence of typically brown endosymbiotic dinoflagellates in the genus Symbiodinium, produce the characteristically striking hues of reef-building corals (Dove et a. 2001; Kelmanson and Matz 2003; Wiedenmann et al. 2004; Matz et al. 2006; Oswald et al. 2007). FPs comprise a surprisingly high fraction of the total protein complement in coral tissue, ranging from 4.5% in the coral Montastraea cavernosa, up to 14% in Acropora nobilis (Oswald et al. 2007), suggesting that they fulfil a biologically important role. Although the roles of colour and fluorescence in animal species are wide-ranging (e.g. Shimomura et al. 1962; Wicksten 1983; 1989; McFall-Ngai 1990; Mathger and Denton 2001; Mazel et al. 2004), their role(s) in nonbioluminescent corals is unclear.. 1.1 The phenomenon of fluorescence . To understand the roles that fluorescence might have in the coral holobiont, it is first necessary to understand the process of fluorescence. Photoluminescence (PL). 18.
(20) describes the phenomenon of light emission following the absorption of light and is one of many forms of luminescence, or cold light, initiated by the absorption of photons or photoexcitation. Following photoexcitation, various relaxation processes occur before photons are re-radiated (or light is emitted). The energy of an exciting photon with respect to its emission is a parameter used to classify PL processes. For example, when a system undergoes internal energy transitions before re-emitting the energy initially absorbed, some of the original energy is dissipated so that the emitted light photons have lower energy and longer wavelength than those absorbed, giving rise to the phenomenon known as fluorescence. Fluorescence occurs when fluorescent molecules, called fluorophores, are excited from the ground state (S0) into a higher energy state (such as S1, S2, etc., depending on the amount of energy absorbed) (Fig. 1.1A). Because fluorophore excitation is unfavourable, dissipation of the excess energy must occur before it can return to ground-state. Most commonly, energy is released by emission of a photon equivalent in energy to the difference between the lowest excited state (S1) and the ground state (S0). Through vibrational relaxation and internal conversion (Ic), the fluorophore returns to the lowest excited state (S1) before emitting a photon (Fig. 1.1A). Hence the emitted photon loses some energy compared with the absorbed energy and is thus of lower energy and a longer wavelength than the absorbed photon (Fig. 1.1B). Eventually, the remaining energy is released in the form of a photon and the fluorophore returns to ground state (Fig. 1.1). In chlorophyll fluorescence, light energy absorbed by a chlorophyll molecule can be used to undergo photosynthesis (photochemistry), dissipated as heat (nonphotochemical quenching), or re-emitted as light (as per description above). These three processes directly compete with one another so that an increase in one results in a decrease in another. Therefore the measurement of the yield of chlorophyll. 19.
(21) fluorescence can reveal information about photochemistry and non-photochemical quenching (Maxwell and Johnson 2000).. Figure 1.1 Schematic representation of a Jabloński (1933) diagram showing: (A) changes in the energy level of fluorophore giving rise to fluorescence, and (B) corresponding spectra. The coloured circles represent the energy state of the fluorophore, where blue depicts the normal energy level and red the maximum energy level. Non-radiative energy transitions are represented by a black wavy arrow and radiative energy transitions by coloured, straight arrows. The vibrational ground states of each excited state are represented with thick lines and the higher vibrational states with thinner lines. Ic = internal conversion. Adapted from Jablonski (1933).. 20.
(22) 1.2 GFP, GFP-‐homologs and chromoproteins . Green fluorescent protein (GFP), first identified from the bioluminescent jellyfish Aequorea victoria, is a spontaneously fluorescent protein that absorbs blue light and re-emits it as green fluorescence (Shimomura et al. 1962, Johnson et al. 1962). What makes GFP unique is its ability to catalyse the synthesis of the pigment (chromophore) on its own, thus acting both as a substrate and an enzyme (Matz et al. 2002). In contrast to all other cases of natural pigmentation, where many different enzymes are involved in pigment production, colour attributable to GFP is essentially determined by the nucleotide sequence of a single gene. The only external agent required to complete the pigment biosynthesis is atmospheric oxygen (Heim et al. 1994; Gross et al. 2000). Therefore, expression of the gene coding for GFP leads directly to the appearance of a fluorescent signal. Insertion of the GFP gene prior to the stop codon for a gene of interest would result in the production of GFP any time that gene is produced. As fluorescence intensity is proportional to concentration (Desha 1920), GFP fluorescence has been used widely as a reporter gene to investigate a number of biological events through gene expression (Chalfie et al. 1994; Harper et al. 1999), gene silencing (Ruiz et al. 1998; Hammond et al. 2000), and the exploration of developmental and quantitative properties of promoter genes (Marton et al. 2005; Tany and Newton 2004). Additionally, colours produced by GFPs are easily detected with the naked eye, GFP spectra and fluorescence are easily measured and compared under different experimental conditions, and GFPs are readily expressed and extraordinarily resistant to proteolysis and denaturing agents, such as high temperature, detergents, and extremes of pH (Ward and Cormier 1979; Baird et al. 2000; Ward et al. 2000). 21.
(23) Bioluminescence, the emitting of light through chemical reactions, differs from fluorescence, the emission of light following absorption of a photon without involving a catalytic or enzymatic chemical reaction. Many of the bioluminescent pathways investigated in organisms like hydroid polyps, comb jellies and copepods (Matz et al. 1999) are not homologous to that of A. victoria (Matz et al. 2002). These systems evolved recently and independently within different lineages, and their enzymes were recruited from biochemical pathways completely unrelated to light production (Hastings 1983; Hastings 1995; Rees et al. 1998). Speculation that the recruitment of GFP might similarly be recent, gave rise to the notion that GFP-like proteins (or GFP homologs) might exist among non-bioluminescent organisms. Indeed, fluorescence has been shown to be due to the presence of a diverse group of GFP homologs within non-bioluminescent, reef-building, corals (class Anthozoa, order Scleractinia) (Matz et al. 1999; Matz et al. 2002; Alieva et al. 2008). There are at least 40 different GFP homologs, of which only 6 are from bioluminescent organisms; the rest are from fluorescent and coloured, non-bioluminescent representatives of Anthozoa (Labas et al. 2002; Matz et al. 2002). To date, scleractinian corals represent the largest known repository of spectroscopic diversity of GFP homologs (Alieva et al. 2008). Many genetically enhanced GFP variants have been developed through directed mutagenesis of the GFP nucleotide sequence, and range in emission spectral profiles from the blue (Yang et al. 1998), to cyan (Heim and Tsien, 1996), green (Heim et al. 1995), yellow (Wachter et al. 1998), and red (Matz et al. 1999) regions of the visible spectrum. GFPs and their homologs each have unique major excitation and emission maxima (Tsein 1998), indicating that each pair of excitation and emission spectra found represent individual GFP proteins, enabling easy identification from. 22.
(24) spectral profiles (Dove et al. 2001). The four most common fluorescent protein (FPs) types are cyan, green, yellow and red, each with unique excitation and emission spectra (Fig 1.2). Additionally, non-fluorescent chromoproteins (CPs), also called pocilloporin, only shows intense absorption capabilities and does not fluoresce (Alieva et al. 2008). Phylogenetic. analyses. of. GFP-like. nucleotide. sequences. suggest. evolutionarily newer cyan and red FPs evolved under positive natural selection (Field et al. 2006), strongly indicating that colour diversity serves a biological function. Multiple examples of parallel evolution, whereby the same colours have evolved in cnidarians as diverse as Actiniaria, Corallimorpharia and Alcyonaria, strongly corroborates this interpretation (Alieva et al. 2008).. However, the adaptive. significance of this colour diversity remains unresolved (Matz et al. 2002; Kelmanson and Matz 2003).. 1.3 Coral colouration and the role of coral FPs . Since early observations of fluorescence in corals (Phillips 1927; Kawaguti 1944; Shibata 1969), patterns in the distribution and abundance of fluorescent morphs have suggested that FPs function in photoprotection, either of the coral host or their photosynthetic algal symbionts (Kawaguti 1944; Salih et al. 1998, 2000, 2006; Dove et al. 2001). However, based on the premise that a FP would only be suitable for photoprotection of algal symbionts if its excitation wavelength was the same as UV light and/or its presence exerted influence on chlorophyll excitation/fluorescence, the finding that GFP absorption did not reduce the chlorophyll excitation spectrum in Caribbean corals (Mazel et al. 2003) raises questions about the role of FPs in algal 23.
(25) photoprotection. Confounding the issue is that many coral species exhibit multiple FPs, in addition to GFP, simultaneously (Mazel et al. 2003). The combined range of excitation and emission spectra that would occur in the presence of multiple FPs. Figure 1.2 Schematic representation of absorption/excitation and emission spectra for four common fluorescent proteins (FPs) found in corals: cyan FP (CFP), green FP (GFP), yellow FP (YFP) and red FP (RFP).. suggests possible energy transfer (Salih et al. 2000). Förster resonant energy transfer (FRET) describes the process of energy transfer between fluorophores, where in an 24.
(26) excited state, a donor fluorophore may radiatively (or non-radiatively) transfer energy to an acceptor fluorophore. The efficiency of this transfer is inversely proportional to the distance between donor and acceptor and can be used to measure interaction distances (in nm) between fluorophores (Herman et al. 2001). Light energy transfer between FPs could lead to the absorption and re-allocation of energy into less photosynthetically active pigments, thereby reducing damage to PSII of a coral’s zooxanthellae (Cox et al. 2007). Although FRET did not occur in isolated pigments of Acropora millepora, imaging of the entire emission spectrum from reef-collected A. millepora samples revealed that up to 93% of the FPs were involved in FRET pairs, implying their use in photoprotection (Cox et al. 2007).. It was postulated that. fluorescence kinetics and FPs could lead to the absorption and re-allocation of energy into less photosynthetically active pigments, thereby reducing damage to PSII of a coral’s zooxanthellae (Cox et al. 2007). However fluorescence kinetics and excitation versus emission mapping indicated that FP emission plays only a minor role, if any, in chlorophyll excitation (Gilmore et al. 2003), therefore our understanding of the photoprotective mechanism of FPs remains ambiguous. A number of lines of evidence further argue against a role for FPs in photoprotection, including observations of different coloured morphs (containing different types/amounts of FPs) co-occurring (side-by-side) in the field (Takabayashi and Hoegh-Guldberg 1995), the possession of green-to-red photoconverting FPs by azooxanthellate corals (Wiedemann et al. 2004; Oswald et al. 2007; Schnitzler et al. 2008), and lack of correlation between FP abundance and water depth (Mazel et al. 2003). Alternative roles that have been proposed include that FPs (1) function as antioxidants ameliorating the coral stress response (Bou-Abdallah et al. 2006), (2) control zooxanthellae population densities (Field et al. 2006; Dove et al. 2008), (3). 25.
(27) comprise part of an innate immune response (Palmer et al. 2009), and (4) that they act to camouflage corals from predatory fishes (Matz et al. 2006) (summarised in Table 1.1). It is likely that coral FPs have multiple functions, as has been suggested recently by several authors (Field et al. 2006; Alieva et al. 2008, D’Angelo et al. 2008, 2012).. 1.4 Coral colour polymorphism and stress tolerance . There are four common GFP-based colours in corals, the fluorescent colours cyan, green, red and a non-fluorescent purple-blue (Alieva et al. 2008), and a less common yellow pigment (C. Palmer pers. comm. in: Alieva et al. 2008). Colour polymorphism refers to the occurrence of multiple colour morphs within a single species. The underlying cause of colour variation can be either genetic or environmental. Genetic polymorphism refers to phenotypic variation in colour appearance that is heritable, largely determined during zygote formation, and corresponds to allelic variations at certain loci. In contrast, colour polyphenism occurs when the colour is not genetically determined, and is instead influenced by environmental cues. Thus colour expression can be either plastic (polyphenism) or stable (genetic polymorphism). Knowledge of factors underlying colour variation allows colour to be interpreted in light of that organism’s life history or condition (Kelmanson and Matz 2003). However, coral colour diversity may reflect a combination of both models, where both allelic polymorphism and environmentally controlled differential gene expression play a role in determining colour appearance. Several approaches can be followed to unravel the underlying basis for colour polymorphism in corals, including the evaluation of temporal patterns in the stability versus flexibility of colour morphs, and the identification of environmental influences 26.
(28) on the relative proportion of colour morphs within populations. Studies of temporal patterns in coral colour are limited (but see Todd et al. 2002 a, b; R. Rowan pers. comm. in: Kelmanson and Matz 2003; Leutenegger et al. 2007), and understanding of the mechanism(s) responsible for colour change is poor. Variation in colour and the associated expression levels of FPs/CPs in corals are generally thought to be genetically determined rather than regulated by the environment, although there is some evidence of non-genetic variation. For example, a green-to-red change in a deep water specimen appears to be due to photoconversion (Leutenegger et al. 2007), and there is evidence of phenotypic plasticity in FP expression induced by light (Takabayashi and Hoegh-Guldberg 1995; Kelmanson and Matz 2003), that resukts in variation in colour. Todd et al. (2002a,b) observed discrete changes in coral colour 7 months after colonies of Favia speciosa and Diploastrea helipora were transplanted to different habitats. Their findings suggested a significant genotype × environment interaction, however, patterns of colour changes were independent of changes in depth/habitat (Todd et al. 2002a, b). Similarly, R. Rowan (pers. comm. in: Kelmanson and Matz 2003) described how a single specimen of Fungia fungites changed from brown to purple, to fluorescent green in response to changing light conditions. Kelmanson and Matz (2003) also demonstrated that colour variation of Montastraea cavernosa was most likely environmentally regulated, indicating coral colour in this species was polyphenic. However, allelic variation in the genes that regulate FP transcription and/or differences in the regulatory regions of coral FP genes may exist and were not investigated. Knowledge of spatial patterns in the distribution and abundance of coral colour morphs and of differences in physiological performance among colour variants is limited. In the Caribbean, green morphs of Porites asteroides were initially found. 27.
(29) Table 1.1 Summary of the literature in support of and against a photoprotective role for coral FPs / CPs and other suggested roles. In Support of a Photoprotective Role Reference. Finding. Kawaguti 1944, 1969. First suggested coral FPs found in epithelial cells may act photoprotectively. Wiedenmann et al. 1999. Proposed that coral FPs fulfill a photoprotective function in some Anthozoans like sea anemones. Salih et al.1998, 2000, 2006. Coral FPs regulate light environment by screening UV light: Position of coral FPs relative to zooxanthellae (e.g. above, in high-light vs. below, in lowlight) indicates a photoprotective role. Dove et al. 2001. The molecular properties of coral CPs indicate functions from converting high-intensity UV light to photosynthetically active radiation to shielding of chlorophyll a, c from high-intensity light. Gilmore et al. 2003. Coral FPs may indirectly act to absorb, screen and scatter excess UV light to protect the photosynthetic mechanism of Photosystem II (via FRET). Dove 2004. Experimentally, coral FPs were photoprotective at normal temperatures. Klueter et al. 2006. Strongly fluorescent colonies of Montipora digitata contain greater densities of algal symbionts. Cox et al. 2007. Up to 93% of coral FPs investigated were involved in FRET pairs indicating their involvement in photoprotection. Leutenegger et al. 2007. Slow deacy rates and high stability of coral FPs indicates their usefullnes in functions requiring high concentrations, like photoprotection. Oswald et al. 2007. Coral FPs contribute between 5 and 14% of soluble protein in ectodermal coral tissues which indicates their usefullnes in functions requiring high concentrations, like photoprotection. D'Angelo et al. 2008. FPs and CPs are upregulated at the transcriptional level in response to increased exposure to light. Dove et al. 2008. Corals increase fluorescence during temperature stress and bleaching. Roth et al. 2010. Experimentally, corals photoacclimate by changing FP concentrations. D'Angelo 2012. High accumulation of coral FPs in growth zones provide photoprotection for incoming zooxanthellae yet to populate areas exposed to high-light intensity. Smith et al. 2013. Screening by coral CPs leads to reduced chlorophyll excitation. Reference. Finding. Dove et al. 1995. Absorption spectra of coral CPs are not likely to protect coral symbionts from photobleaching. Takabayashi and HoeghGuldberg 1995. Different coloured morphs exist side-by-side in the field, no correlation between coral FP concentration and depth, and zooxanthellae densities are lowest in most pigmented regions of coral colonies. Fang et al. 1989 and D'Angelo et al. 2008. Low numbers of zooxanthellae are present in highly pigmented branch tips. Schlichter and Fricke 1990. Coral FPs provide photo-enhancement in low-light conditions rather than photoprotection. Mazel et al. 2003. Coral FPs neither photo-enhance or -protect algal symbionts: FP concentration does not correlate well with the removal of photons from chlorophyll excitation. Bathymetric distribution of coral FPs did not change with depth. Wiedenmann et al. 2004 and Schnitzler et al. 2008. Coral FPs are found in azooxanthellate coral species in low-light habitats. Gleason 1993. Green coral FPs did not provide protection against UV light. Vogt et al. 2008. Corals with FPs found in low-light, deep-sea habitats between 500-600m. Reference. Finding. Ward 2002. Coral FPs act as visual trigger for predatory fish. Bou-Abdallah et al. 2006. Coral FPs provide supplementary antioxidant protection by deactivating reactive oxygen species. Field et al. 2006 and Dove et al. 2008. Coral FPs regulate zooxanthellae populations. Matz et al. 2006. FPs provide camouflage from herbivorous fishes. Palmer et al. 2008 and D'Angelo et al. 2012. Coral FPs function as a part of coral innate immune response. Palmer et al. 2009. Antioxidant properties found in coral FPs. Against a Photoprotective Role. Other Suggested Roles. 28.
(30) to be more abundant in shallow water habitats, whereas their brown counterparts were more abundant at depth, but when the spatial scale of the study was expanded, the pattern became inconsistent (Gleason 1998). In some cases, the pattern was reversed in areas of high sediment load, with brown colonies of P. asteroides better at shedding sediment from colony surfaces and suffering less sediment-induced tissue death than green morphs (Gleason 1998). On the Great Barrier Reef (GBR), fluorescent morphs were found to be more common in shallow water, and FPs were more concentrated in colony areas exposed to greater light-intensity (Salih et al. 2000). Pink colonies of Pocillopora damicornis showed reduced growth rate in comparison to brown colonies, prompting the authors to suggest that CP production, which only occurs in pink colonies, is energetically costly (Takabayashi and Hoegh-Guldberg 1995). These studies indicate great variation in the physiological performance and in the distribution patterns of coral colour morphs, but there has been little advance over the last ~15 years in understanding the biological implications of such variation or how such variation relates to the expression of coral FPs. Although the presence of colour polymorphism is well documented in reefbuilding corals (Veron 1986; 2000), few studies have systematically described colour morphs within a species and the FP complexes that characterize them (but see Kelmanson and Matz 2003 and Oswald et al. 2007). Previously, the FP in greatest concentration was thought to govern visual appearance (Cox et al. 2007). However Mazel and Fuchs (2003) have explained how the visual impact of FPs may not correlate well with abundance and perceived colour as assessed by the human eye. As ocean warming (Hughes et al. 2003) and the frequency of coral bleaching events (Hoegh-Guldberg 1999) escalate, several studies have examined the varying response of colour morphs to changes in environmental temperature (Salih et al. 2000;. 29.
(31) Dove 2004; Smith-Keune and Dove 2008 etc). Following the 1998 mass coral bleaching event on the GBR, bleaching resistance was found to be highly correlated with the concentration of FPs within coral tissues (R2 = .09471; p < 0.0001; Salih et al. 2000). The same authors observed that non-fluorescent morphs were significantly more photoinhibited and recovered to pre-inhibition rates slower than fluorescent morphs (Salih et al. 2000). Conversely, when Dove (2004) experimentally heated branches of three distinctly-coloured morphs of the coral Acropora aspera, bleaching was most severe in the most heavily pigmented blue morph, and even subtle temperature increases had detrimental effects on the photoprotective mechanism. Additionally, Smith-Keune and Dove (2008) observed a down regulation in an FP coding gene following exposure to experimental heat stress, which they suggested would lead to a decline in FP concentration. Consequently there are major gaps in current understanding of how (1) colour variation and coral FP concentration are linked (2) variations in colour morph physiology are linked to environmental stimuli, and (3) FPs influence coral susceptibility to heat stress.. 1.5 Acropora millepora: a model coral . Characterization of spatial and temporal patterns in protein expression and the distribution of colour types within a polymorphic coral species possessing the full complement of coral FPs and CPs is needed to advance current understanding of the biological significance of colour variation in corals (Mazel and Fuchs 2003; Alieva et al. 2008). The common species Acropora millepora is a member of the speciose and ecologically important coral genus Acropora, and has frequently been used as a model coral in a diverse range of studies (e.g., Miller et al. 2000; van Oppen et al. 2006; 30.
(32) Alieva et al. 2008). It is a common coral on Indo-Pacific reefs, with a distribution that ranges from Sri Lanka and Thailand east to the Marshall Islands and Tonga, including Australia (Veron and Wallace 1984; Veron 1995). Its compact-branching, corymbose colonies exhibit a wide range in tissue colours (Veron and Wallace,1984; Wallace and Willis 1994; Veron 1995; Mackenzie et al. 2004). At least four colour morphs have been described in this species (Veron 2000, Cox et al. 2007, Alieva et al. 2008), and they commonly co-occur on shallow reef flats, lagoons, and upper reef slopes less than 4 metres deep (Fig. 1.3). The occurrence of multiple distinct colour varieties within populations of A. millepora, combined with the well-characterised nature of its FP/CP complement (Cox et al. 2007; Alieva et al. 2008; D’Angelo et a. 2008; Smith et al. 2013), make this species ideal for addressing questions about how colour variation and FP concentration are linked. To date, no studies have documented patterns in the distribution, abundance, spectral characteristics, tolerance to changes in environmental conditions including temperature, or colour × symbiont genotype associations for colour morphs within the coral species A. millepora. Anecdotal evidence indicates that a green morph with orange axial corallites is a common colour type in this species (Veron 1995), although no abundance or distribution data have been reported. Colonies of A. millepora exhibit a ‘complementary’ pattern of fluorescence, with green and red FPs found in different anatomical regions of the coral, often with distinct boundaries between them (Gruber et al. 2008). Common FP colours in anthozoa are found in the cyan, green, and red spectral range (Wiedenmann 1997; Matz et al. 1999; Oswald 2007; Alieva et al.. 31.
(33) Fig. 1.3 Common colour morphs of the coral Acropora millepora from the Great Barrier Reef. (A) A. millepora colour morphs living side-by-side in the field, and (B) green, (C) blue, (D) yellow, and (E) red colonies pictured individually. Green colonies exhibit striking green fluorescence under natural daylight conditions and are easily distinguished from the brown to orange appearance of yellow colonies. Blue colonies (which often photograph purple) exhibit deep pigmentation that is visually distinct from red colonies.. 32.
(34) 2008). These major colour types are encountered in A. millepora (D’Angelo et al. 2008; Alieva et al. 2008), although the specific emission wavelengths reported vary between these reports. The Cyan FP emits between 484 and 489 nm, green FP emits near ~512nm, Red FP emits between 593 and 597, and CP is excited at 588 nm (Alieva et al. 2008; D’Angelo et al. 2008).. 1.6 Study aims and objectives . The over-arching goal of research described in this thesis will be to determine the significance of intraspecific colour polymorphism for stress tolerance of reefbuilding corals. Field and experimentally-based comparisons of the responses of colour morphs to changes in environmental conditions were designed to resolve ambiguities in our current understanding of the functional role of coral florescent proteins. Using Acropora millepora, a common scleractinian coral on the Great Barrier Reef, as a model organism, I address the following five specific objectives to achieve this goal:. 1.. To establish if FP/CP types and/or concentrations differ between. intraspecific colour morphs. Although coral colour morphs are visually distinguishable in the field, an understanding of how fluorescent and non-fluorescent protein content compares among intraspecific colour morphs remains lacking. Results presented in Chapter 2 quantify, for the first time, relative concentrations of the three common fluorescent proteins and one non-fluorescent protein in tissues of colour morphs. A novel approach that combines measurements of the relative. 33.
Figure

+7
Related documents
The class time should be used for the students to write independently; but they should be invited to ask the teacher any questions they have related to writing the paragraphs
Another meditation teacher, who has facilitated meditation teachers training, has also worked with vulnerable populations in San Francisco including those with psychiatric
case of Cuatro Elementos Skuela , a Hip-hop school in the neighborhood of Aranjuez, I!. argue that the Hip-hop movement in Medellín is producing changes in the lives of
Radio and TV broadcast music related programmes which provide opportunities not just. to listeners but also to the
21 Department of Neurosurgery, Tangdu Hospital, The Second Affiliated hospital of the Fourth Military Medical University, 1 Xinsi Road, Xian, Shanxi Province 710038, People ’ s
penicillin, skin testing for immediate hyper-.. sensitivity to the agent should
The paper is discussed for various techniques for sensor localization and various interpolation methods for variety of prediction methods used by various applications
So far researchers of this study know that there is no rich study which has been conducted yet covering the understanding of existing image of Sea beach
