International Journal of Innovative Technology and Exploring Engineering (IJITEE) ISSN: 2278-3075, Volume-8 Issue-12, October, 2019
Improved Diabetes Prediction Model for Predicting
Type-II Diabetes
Sai Poojitha Nimmagadda, Sagar Yeruva, Rakesh Siempu
Abstract: The state or disorder where the body cannot effectively use the insulin is called Diabetes. If the insulin levels are not maintained properly, the diabetes is one such disorder where it damages all other body parts. It is estimated that the diabetes is the 7th leading cause of deaths as per World Health Organisation report. Early recognition of diabetes, decreases the risk of serious ailments, which includes, heart diseases, brain stroke, eye related diseases, kidney diseases, nerve related diseases etc. In the present work, pima indians diabetes data set is considered as the best dataset and different models viz., hierarchical clustering with decision tree, hierarchical clustering with support vector machines, hierarchical clustering with logistic regression and k means with logistic regression are developed and implemented for identifying and predicting the diabetes. The accuracies of these prediction models range between 0.90 and 0.946. An Improved Diabetes Prediction Algorithm (IDPA) combining the hierarchical clustering algorithm and Naïve Bayes classification algorithm is developed to identify and predict the Type-II diabetes and has shown an accuracy of 0.96. In this IDPA, firstly, the grouping of data into two groups i.e. diabetes and non-diabetes is done by applying the hierarchical clustering algorithm. Then, the filtering is done by comparing the group value to the class value followed by applying Naïve Bayes classification algorithm for predicting diabetes. The results show that the proposed novel method i.e. IDPA can predict the diabetes with higher accuracy levels (0.96) than the traditional/existing methods and other methods which were implemented. This model can be used to predict diabetes early, thereby reducing the serious complications of diabetes.
Keywords: Clustering, Classification, Diabetes, Hybrid Model, Hierarchical Clustering, Naïve Bayes, Prediction.
I. INTRODUCTION
There are three types of diabetes Type-I diabetes, Type-II diabetes and gestational diabetes. Type-I diabetes is occurred when pancreas, due to some abnormality, does not produce insulin or produces very little insulin. This is called as juvenile diabetes or insulin-dependent diabetes. The treatment does not cure Type-I diabetes but it aims to control blood sugar levels with insulin, diet and lifestyle to prevent complications. Gestational diabetes occurs in pregnant women where it is observed high sugar levels during pregnancy in them. Later there are chances that gestational diabetes can be converted into Type-II diabetes.
Revised Manuscript Received on September 30th , 2019. *Corresponding author
Sai Poojitha Nimmagadda*, Post-graduate student, Department of Computer Science and Engineering, VNR Vignana Jyothi Institute of Engineering and Technology, Hyderabad, India.
Dr. Sagar Yeruva, Associate Professor, Department of Computer Science and Engineering, VNR Vignana Jyothi Institute of Engineering and Technology, Hyderabad, India.
Dr. Rakesh Siempu, Assistant Professor, Department of Civil Engineering, VNR Vignana Jyothi Institute of Engineering and Technology, Hyderabad, India.
Type-II diabetes also called as diabetes mellitus is a metabolic disorder which causes sugar levels in body to raise up. Unlike Type-I diabetes, Type-II diabetes can be reversible. The treatment can be different from one person to other person. Some need only lifestyle changes like reducing weight, leading healthy lifestyle etc. and doesn’t require taking insulin. While others need to take medical treatment which involves medicines, insulin injections and following good lifestyle to maintain sugar levels. During metabolic activity intake of food is converted to energy. This process requires hormone called insulin which helps in converting sugars to energy. Type-II diabetes is caused when body slowly loses its capacity to absorb insulin, which actually controls the sugar level, thereby sugar levels in body will not be controlled and hence higher sugar values in Type-II diabetes patients. This is also referred as “adult-onset” diabetes as this is developed in later stages of life. This has other name “insulin resistance” as body is showing resistance to absorb insulin. This is more common when compared to other types of diabetes. Statistics show that out of 100 diabetes patients, 90 have Type-II diabetes.
An estimated 1.6 million deaths were directly caused by diabetes. Another 2.2 million deaths because of high glucose in blood. World Health Organization (WHO) estimates that diabetes was the 7th leading cause of deaths [1]. India is in second position with highest number of diabetes patients. With the help of data mining, machine learning techniques and technology the risks for Type-II diabetes can be identified early and with proper treatment Type-II diabetes can be controlled there by reducing negative impacts of diabetes.
II. BACKGROUND A. Data Mining
Data mining when used with machine learning can discover patterns in large datasets. Data mining is the combination of two different fields’ computer science and statistics and aims to extract patterns and knowledge not just data from large data sets. Knowledge Discovery in Databases (KDD) contains multiple stages. Data mining is one of the stage in multiple stages [2]. Tasks that data mining is useful to do are identification of data errors in the dataset, grouping of data, Classification using existing data, Identifying relationships in the data and many more.
B. Machine Learning
Important part of machine learning is algorithms with which different models can be established. Machine learning models will predict output for a particular given input. The inputs to generate machine learning model are sample dataset and machine learning algorithms are chosen in such a way that they suit the attributes in the sample data. The steps in the process are
1. Training data set (Pima Indian Diabetes Dataset [3]) is given as input.
2. Selected machine learning algorithm is applied on the data. In this stage algorithm learns the patterns in the data. 3. The model is built after algorithm completes the learning of patterns in given data. After the model is ready, whenever new data is given for prediction to the model, the model predicts the output for that particular input.
C. Coding Tool
Jupyter notebook is used as an Integrated Development Environment (IDE). It is an open-source programming software, open-measures, and allows multiple programming languages. The Jupyter notebook enables to make and share reports that contain live code, conditions, perceptions and content. This can be used for cleaning data, data transformation, modelling the data, visualization of data etc.
III. DATA MINING METHODS A. Agglomerative Hierarchical Clustering Algorithm
There are two types of Hierarchical clustering algorithms, top-down and bottom-up. In bottom-up approach each and every data point is considered as one cluster and sequentially combine (or agglomerate) clusters based on conditions till all clusters are combined or till required number of clusters are formed which contain all the data points thus the name Agglomerative Hierarchical clustering algorithm. Steps in Agglomerative Hierarchical clustering are (Fig.1)
1. Consider each record in the dataset as one cluster then chose a distance metric from available methods. Distance metric is used to measure the distance between two clusters. In the present study Euclidian affinity and linkage as wards method were used.
2. For every step, two clusters which has smallest distance are combined into one.
3. Step 2 is repeated until desired number of clusters are reached. In this way the required number of clusters can be selected.
B. Naïve Bayes Classification Algorithm
Naïve Bayes algorithm is based on conditional probability, a probability can be defined as the ratio of favourable chances to the total number of chances. Conditional probability is some (X) occurring given that other (Y) has already occurred.
𝑃 𝑋 𝑌 =𝑃(𝑋 ∩ 𝑌) 𝑃(𝑌)
Bayes Rule explains that when 𝑃 𝑋 𝑌 is known from the training dataset it is possible to find 𝑃 𝑌 𝑋
𝑃(𝑋|𝑌)(𝐾𝑛𝑜𝑤𝑛 )= 𝑃(𝑋∩𝑌)
𝑃(𝑌) (1)
𝑃(𝑌|𝑋)(𝑈𝑛𝑘𝑛𝑜𝑤𝑛 )= 𝑃(𝑋∩𝑌)
𝑃(𝑋) (2)
Bayes Rule: 𝑃 𝑌 𝑋 =𝑃 𝑋 𝑌 ∗𝑃(𝑌)
𝑃(𝑋) (3)
Bayes rule provides formula for finding probability of Y given X. But real time there could be multiple X variables. Naive assumption is that X’s are independent of each other.
𝑃 𝑌 = 𝑘 𝑋 =𝑃 𝑋 𝑌=𝐾 ∗𝑃(𝑌=𝑘)𝑃(𝑋)
𝑘 𝑖𝑠 𝑐𝑙𝑎𝑠𝑠 𝑜𝑓 𝑌
(4) It becomes Naïve
𝑃 𝑌 = 𝑘 𝑥1. 𝑥2. . . 𝑥𝑛 =
𝑃(𝑥1│𝑌=𝑘).𝑃(𝑥2│𝑌=𝑘)…𝑃(𝑥𝑛)│𝑌=𝑘)∗𝑃(𝑌=𝑘)
𝑃 𝑥1 .𝑃 𝑥2 …𝑃(𝑥𝑛) (5)
The above Equation 5 can be understood as 𝑃𝑜𝑠𝑡𝑒𝑟𝑖𝑜𝑟 𝑃𝑟𝑜𝑏𝑎𝑏𝑖𝑙𝑖𝑡𝑦
=𝑃𝑟𝑜𝑏𝑎𝑏𝑖𝑙𝑖𝑡𝑦 𝑜𝑓 𝐿𝑖𝑘𝑒𝑙𝑖𝑜𝑜𝑑 𝑜𝑓 𝐸𝑣𝑖𝑑𝑒𝑛𝑐𝑒 ∗ 𝑃𝑟𝑖𝑜𝑟 𝑃𝑟𝑜𝑏𝑎𝑏𝑖𝑙𝑖𝑡𝑦 𝑜𝑓 𝐸𝑣𝑖𝑑𝑒𝑛𝑐𝑒 There are multiple Naïve Bayes classifiers based on bayes rule where every classifier shares same rule that “every pair of features being classified is independent of each other”.
Fig. 1. Agglomerative Hierarchical Clustering Algorithm
IV. LITERATURE REVIEW
In this section other researcher’s work which is relevant to the present study are presented.
K.Rajesh et al [4], used Pima Indian Diabetes Dataset (PIDD). The researchers focussed on filtering techniques for feature selection and compared different classification algorithms. It was found that C4.5 is efficient classification algorithm when compared with C-RT, CS-RT, ID3, K-NN, LDA, NAÏVE BAYES, PLS-DA, SVM and RND TREE and fishers filtering technique is efficient than runs filtering, relief filtering, step disc filtering techniques.
Abdullah et al [5] study focuses on diabetes in old and young people. Saudi Arabia data set obtained from WHO is used and ODM (oracle data miner) is used for prediction. Regression and SVM were used for prediction of effective treatment and for training respectively. Entire dataset is divided as per age groups.
No
Yes Start
Input (required number of clusters)
Set every point as single cluster
Compute distance matrix
Is number of clusters = input
Merge clusters with minimum distance Compute distance matrix
International Journal of Innovative Technology and Exploring Engineering (IJITEE) ISSN: 2278-3075, Volume-8 Issue-12, October, 2019
The results show that best order of treatments are different for both young and old groups. It is observed that drug treatment is more effective in old group when compared to younger group. Srideivanai Nagarajan et al [6] did a comparison study on algorithms which predicts gestational diabetes. The dataset was obtained from St.Isabella hospital which contains around 600 records. ID3, NaiveBayes, C4.5 and random tree are compared and analysed. Cross validation technique was used and it is observed that random tree is giving better accuracy (0.93) when compared with other algorithms. Aiswarya Iyer et al [7], in the study tried to find solution for predicting disease. PIDD is used and WEKA is used to pre-process data. J48 decision tree and Naïve Bayes were used in the model and results are compared with each other. It is observed that Naïve bayes is performing better with good accuracy and less error rate. Han Wu et al [8] proposed a model for predicting Type-II diabetes. In this study, Waikato environment and PIDD were used. Improved K-means algorithm along with logistic regression algorithm is used. Performance is measured by K fold cross validation and it is showed that this model has accuracy greater than existing models. Humar Kahramanli et al [9] proposed a hybrid model, consisting of artificial Neural network, fuzzy neural network and back propagation algorithm for training and for prediction of diabetes and heart diseases. At first data is standardised then the data is fuzzyfied. The fussyfied data is given as input to fuzzy neural network and output is given to artificial neural network to obtain the result. They used cleveland heart diseases and pima diabetes datasets. The model has achieved 84.2% accuracy for diabetes and 86.8% for heart disease prediction. B.M Patil et al [10] proposed a hybrid model using data mining methodologies. The proposed model is developed using K means clustering and C4.5 decision tree algorithm. After applying unsupervised clustering algorithm data is filtered and then decision tree algorithm is applied then accuracy is calculated and it was 92.38%.
V. REQUIREMENT ANALYSIS A. Data Set Description
For the purpose of this study, Pima Indian Diabetes Dataset (PIDD) is considered as it is the best dataset for the present study. It contains 768 records. Every record has 9 attributes out of those one attribute is class variable. All 9 attributes contains only numeric data. Each record contains information about single patient.
Table-I: Sample records in dataset
S.no Preg Plas Pres Skin insulin BMI pedi age class
1 5 109 75 26 0 36.0 0.546 60 0
2 3 158 76 36 245 31.6 0.851 28 1
3 6 92 92 0 0 19.9 0.188 28 0
4 1 89 66 23 94 28.1 0.167 21 0
5 0 137 40 35 168 43.1 2.288 33 1
6 5 116 74 0 0 25.6 0.201 30 0
PREG: This column indicates how many times a person is pregnant.
PLAS: This indicates plasma glucose concentration at 2 h in an oral glucose tolerance test.
PRES: This shows diastolic blood pressure.
SKIN: This indicates thickness of skin at triceps.
INSULIN: This demonstrates insulin level.
BMI: It demonstrates body mass index which is ratio of weight and height.
PEDI: It demonstrates how much probability a person can inherit diabetes from ancestors.
Age: It provides or shows age of the person.
Class: It is a variable which contains only 0 or 1. 1 indicates person having diabetes and 0 indicates person not having diabetes.
VI. PREDICTIVE DATA MINING PROCESS FOR PROPOSED MODEL
A. Problem Definition
Many people does not know that they are suffering from diabetes. When diabetes is not treated it could become life threatening disease. When diabetes is detected early, major complications like heart diseases, brain stroke, eye diseses, limb amputations, kidney failure etc. can be reduced. Technology can help in early identification of people who are prone to diabetes. In the present work a new model called IDPA (Improved Diabetes Prediction Algorithm) is presented that includes a novel approach that can identify the diabetes patients using PIMA data set. This proposed method can predict the diabetes with higher accuracy levels than the traditional methods.
B. Proposed Model Methodology – Improved Diabetes Prediction Algorithm(IDPA)
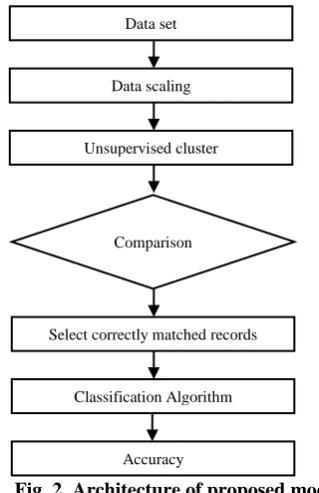
The proposed model uses double level of algorithms. The algorithms that are used in this model are Hierarchical clustering and Naïve bayes algorithm (Fig.2).
In the proposed model IDPA, the input is Pima Indians Diabeties Dataset (PIDD).
Step-1: Pima Indian Diabetes Dataset (PIDD) is collected. Step-2: All values are normalised except the class variable which contains either “0”or “1”.
Step-3: After the data set is normalised, the class variable is excluded and Agglomerative hierarchical clustering with Euclidean distance is taken and is applied for remaining data and then the data is divided into two groups. New column (group) is added which contains “0” or “1”.
Step-4: The value in the group and class value are compared for each record and records which have same value are only considered.
Step-5: Data from step-4 is split for training and testing (90% for training and 10% for testing).
1) Applying Agglomerative Hierarchical Clustering
[image:4.595.306.551.148.273.2]The data set is collected and is scaled and then Agglomerative Hierarchical Clustering which is Unsupervised Clustering algorithm is applied. The data set excluding the class variable are grouped into two groups. Then the records are compared with class value and only those records in data set that are matched are only considered for next process. In the proposed model after clustering, it is compared with class variable and only matched records are taken into consideration. The results of the same are show in Table-II.
Fig. 2. Architecture of proposed model
Table II-Result after Clustering and Comparing
Groups Count
1 Group 0 333
2 Group 1 175
2) Applying Naïve Bayes Classification Algorithm
From the Table-II, it can be understood that out of 768 records, correctly clustered records were 508 and incorrectly clustered records are 260. Only correctly clustered records were considered and Bernouli Naïve Bayes algorithm is applied on those records. It is equally important to validate the result. It won’t be accurate if testing is done on same training data. So the data is split into training data and testing data in 90:10 ratio, where 51 records where used for testing and remaining 457 records were used for training.
3) Performance Evaluation
The proposed model IDPA is compared with other models. The other models include K-means clustering with Logistic regression, Hierarchical Agglomerative clustering with SVM, Hierarchical Agglomerative clustering with Logistic regression, Hierarchical Agglomerative clustering with Decision Tree.
After prediction process there were four outcomes.
1. True Positive: How many people are correctly classified as diabetes patients.
2. True Negative: How many people are correctly classified as non-diabetes patients.
3. False Positive: How many people are incorrectly classified as diabetes patients.
4. False Negative: How many people are incorrectly classified as non-diabetes patients.
The confusion matrix is given in Table-III and results of the same are given in Fig.3.
Table III –Confusion Matrix
Predicted Negative Predicted Positive Actual Negative TN – True Negative FP – False Positive
Actual Positive FN – False Negative TP – True Positive
Fig.3. Confusion Matrix for IDPA.
In this study, Performance is evaluated based on accuracy, recall or sensitivity, specificity.
Accuracy:
Classification accuracy is the ratio of correct predictions to the total number of predictions (Fig.4).
𝐴𝑐𝑐𝑢𝑟𝑎𝑐𝑦 = 𝑁𝑢𝑚𝑏𝑒𝑟 𝑜𝑓 𝑐𝑜𝑟𝑟𝑒𝑐𝑡 𝑝𝑟𝑒𝑑𝑖𝑐𝑡𝑖𝑜𝑛𝑠 𝑇𝑜𝑡𝑎𝑙 𝑛𝑢𝑚𝑏𝑒𝑟 𝑜𝑓 𝑝𝑟𝑒𝑑𝑖𝑐𝑡𝑖𝑜𝑛𝑠 𝑚𝑎𝑑𝑒
𝐴𝑐𝑐𝑢𝑟𝑎𝑐𝑦 = 𝑇𝑃 + 𝑇𝑁
[image:4.595.79.239.186.433.2]𝑇𝑃 + 𝑇𝑁 + 𝐹𝑃 + 𝐹𝑁∗ 100
Fig.4. Accuracy for IDPA. Sensitivity or Recall:
Sensitivity or recall is the ratio of correct positive predictions to the total number of positive predictions. Or more simply, how sensitive the classifier is for detecting positive instances (Fig.5). This is also called the True Positive Rate.
𝑅𝑒𝑐𝑎𝑙𝑙 =𝑁𝑢𝑚𝑏𝑒𝑟 𝑜𝑓 𝑐𝑜𝑟𝑟𝑒𝑐𝑡 𝑝𝑜𝑠𝑖𝑡𝑖𝑣𝑒 𝑝𝑟𝑒𝑑𝑖𝑐𝑡𝑖𝑜𝑛𝑠 𝑇𝑜𝑡𝑎𝑙 𝑛𝑢𝑚𝑏𝑒𝑟 𝑜𝑓 𝑝𝑜𝑠𝑖𝑡𝑖𝑣𝑒 𝑝𝑟𝑒𝑑𝑖𝑐𝑡𝑖𝑜𝑛𝑠
𝑅𝑒𝑐𝑎𝑙𝑙 = 𝑇𝑃
[image:4.595.321.537.330.452.2]𝑇𝑃 + 𝐹𝑁∗ 100
Fig.5. Recall for IDPA. Specificity:
Specificity is the ratio of correct negative predictions to the total number of negative predictions. This determines how specific the classifier is in predicting positive instances.(Fig.6)
𝑆𝑝𝑒𝑐𝑖𝑓𝑖𝑐𝑖𝑡𝑦 =𝑁𝑢𝑚𝑏𝑒𝑟 𝑜𝑓 𝑐𝑜𝑟𝑟𝑒𝑐𝑡 𝑛𝑒𝑔𝑎𝑡𝑖𝑣𝑒 𝑝𝑟𝑒𝑑𝑖𝑐𝑡𝑖𝑜𝑛𝑠 𝑇𝑜𝑡𝑎𝑙 𝑛𝑢𝑚𝑏𝑒𝑟 𝑜𝑓 𝑛𝑒𝑔𝑎𝑡𝑖𝑣𝑒 𝑝𝑟𝑒𝑑𝑖𝑐𝑡𝑖𝑜𝑛𝑠
𝑆𝑝𝑒𝑐𝑖𝑓𝑖𝑐𝑖𝑡𝑦 = 𝑇𝑁
𝑇𝑁 + 𝐹𝑃∗ 100 Data set
Data scaling
Unsupervised cluster
Comparison
Classification Algorithm Select correctly matched records
[image:4.595.327.552.529.633.2]International Journal of Innovative Technology and Exploring Engineering (IJITEE) ISSN: 2278-3075, Volume-8 Issue-12, October, 2019
[image:5.595.48.260.274.396.2]In the IDPA, the proposed model, the data set is loaded in Jupyter notebook. There are 768 records in the dataset. All values in data set except class variable values are normalised using standard scaler function. Hierarchical clustering algorithm is applied to data for all attributes except class value. After applying hierarchical clustering the records are grouped into two clusters or groups “0” or “1”. Comparison is done and for those records where group value and class value are same only those records were taken for consideration. Out of 768 records, correctly matched records were 508 records. Filtered data is split in 90:10 ratio, where 90% of data is used for training and 10% is used for testing. It means 457 records are used for training and 51 are used for testing. Naïve bayes algorithm is applied for the data. Naive bayes algorithm is trained by using training data. Confusion matrix accuracy recall and specificity are calculated by using testing data. Result for specificity is given in Fig. 6.
Fig.6. Specificity for IDPA.
𝐶𝑜𝑛𝑓𝑢𝑠𝑖𝑜𝑛 𝑀𝑎𝑡𝑟𝑖𝑥 = 33 1 1 16 𝐴𝑐𝑐𝑢𝑟𝑎𝑐𝑦 = 96.1%
𝑅𝑒𝑐𝑎𝑙𝑙 = 94.1% 𝑆𝑝𝑒𝑐𝑖𝑓𝑖𝑐𝑖𝑡𝑦 = 97.05%
C. Comparing with other Models
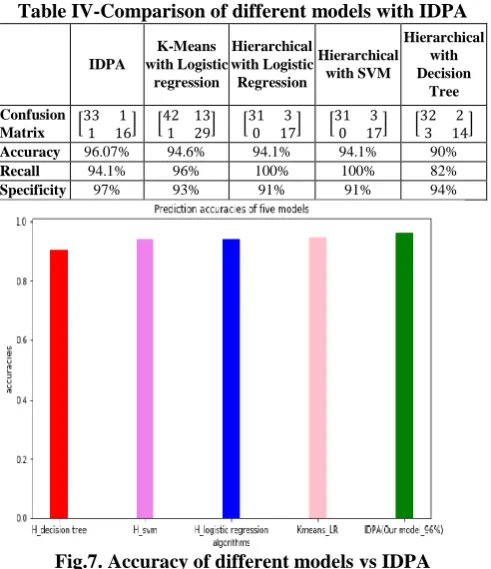
In this study other models were implemented and a comparison of accuracy, recall and specificity is done among other models and IDPA. The Table-IV shows confusion matrix, accuracy, recall and specificity values for each model. It is observed that out of other models IDPA has shown greater accuracy.
Other models include
1) K-Means with Logistic Regression Model
This was the other model which was implemented and compared with IDPA. In this k-means clustering was applied on the same PIMA Indians Diabeties Dataset (PIDD) and data (excluding class variable) was divided into two groups. The group value and class value are compared and only matched records were considered. Out of 768 records correctly matched records were 250. Data was split for training and testing in ratio of 70:30 .Logistic regression algorithm is applied on training data and accuracy and confusion matrix are calculated on testing data.
𝐶𝑜𝑛𝑓𝑢𝑠𝑖𝑜𝑛 𝑀𝑎𝑡𝑟𝑖𝑥 = 42 13 1 29 𝐴𝑐𝑐𝑢𝑟𝑎𝑐𝑦 = 94.6%
𝑅𝑒𝑐𝑎𝑙𝑙 = 96% 𝑆𝑝𝑒𝑐𝑖𝑓𝑖𝑐𝑖𝑡𝑦 = 93%
2) Hierarchical with Logistic Regression Model
This is another model which was implemented and compared with IDPA. In this Agglomerative hierarchical clustering with euclidien and ward linkage was applied on the same PIDD and data (excluding class variable) was
divided into two groups. The group value and class value are compared and only matched records were considered. Out of 768 records correctly matched records were 508. Data was split for training and testing in ratio of 90:10. Logistic regression is applied on training data and accuracy and confusion matrix are calculated on testing data.
𝐶𝑜𝑛𝑓𝑢𝑠𝑖𝑜𝑛 𝑀𝑎𝑡𝑟𝑖𝑥 = 31 3 0 17 𝐴𝑐𝑐𝑢𝑟𝑎𝑐𝑦 = 94.1%
𝑅𝑒𝑐𝑎𝑙𝑙 = 100% 𝑆𝑝𝑒𝑐𝑖𝑓𝑖𝑐𝑖𝑡𝑦 = 91%
3) Hierarchical with Decision Tree Model
This is another model which was implemented and compared with IDPA. In this model clustering and comparison is same as that in second and third models. Decision Tree classifier is applied on training data and performance metrics are calculated on testing data.
𝐶𝑜𝑛𝑓𝑢𝑠𝑖𝑜𝑛 𝑀𝑎𝑡𝑟𝑖𝑥 = 32 2 3 14 𝐴𝑐𝑐𝑢𝑟𝑎𝑐𝑦 = 90%
𝑅𝑒𝑐𝑎𝑙𝑙 = 82% 𝑆𝑝𝑒𝑐𝑖𝑓𝑖𝑐𝑖𝑡𝑦 = 94%
A typical comparison of various model with IDPA is given in Table-IV. Also, graphical representation of the accuracy of different models and IDPA is given in Fig.7.
Table IV-Comparison of different models with IDPA
IDPA
K-Means with Logistic
regression
Hierarchical with Logistic Regression
Hierarchical with SVM
Hierarchical with Decision
Tree
Confusion Matrix
33 1
1 16
42 13
1 29
31 3
0 17
31 3
0 17
32 2
3 14
Accuracy 96.07% 94.6% 94.1% 94.1% 90%
Recall 94.1% 96% 100% 100% 82%
[image:5.595.305.551.353.638.2]Specificity 97% 93% 91% 91% 94%
Fig.7. Accuracy of different models vs IDPA D. Comparing with other Researcher’s Experiments
Table-V: Comparison with literature models
Method Accuracy Reference
IDPA 96.07% Our Model
HPM 92.38% B.M Patil [10]
AMMLP 89.93% Alexis Marcano-Cedeno [12]
J48 (PRUNED ) 89.30% Aliza Ahmad [11]
J48 (UNPRUNED ) 86.60% Aliza Ahmad [11] Hybrid Model 84.50% Humar kahramanli [9]
VI. CONCLUSIONS
In the present study, the main objective is to find a model that predicts Diabetes Mellitus in people when given inputs and it provides higher accuracy rate than the existing models. In order to compare different models, multiple classification algorithms and clustering algorithms were used and implemented. The models include K-means with logistic regression which has got accuracy 94.6%, Hierarchical clustering with Logistic Regression has got accuracy 94.1%, Hierarchical clustering with SVM has accuracy 94.1, Hierarchical clustering with Decision Tree has accuracy 90% and our proposed model IDPA has got accuracy 96.07%. We can say that IDPA has highest accuracy when compared with other models and other researches models. This model when included in real time applications in healthcare sector can be used to predict diabetes with greater accuracy.
The model can be enhanced by using real time dataset or hospital patient’s data. It would be beneficial if user gets a mobile application which not only predicts diabetes or non-diabetes but also stores the patient information.
REFERENCES
1. https://www.who.int/news-room/fact-sheets/detail/diabetes
2. Fayyad, Usama; Piatetsky-Shapiro, Gregory; Smyth, Padhraic (1996). "From Data Mining to Knowledge Discovery in Databases" (PDF). Retrieved 17 December 2008.
3. http://archive.ics.uci.edu/ml/datasets/PimaþIndiansþDiabetes. 4. K.Rajesh,V.Sangeetha.Application of Data Mining Methods and
Techniques for Diabetes Diagnosis.IJEIT 2012 , Volume 2 Issue 3. 5. Abdullah A.Alijumah,Mohd Gulam Ahmad,Application of data
mining:Diabetes health care in young and old patients,Journal of King Saud University-Computer and Information Sciences 2013 25,127-136 6. Srideivanai Nagarajan,R.M ChandraSekaran,Data Mining Techniques
for Performance Evaluation of Diagnosis in gestational Diabetes,IJCRAR 2014 pp91-98
7. Aiswarya Iyer,S.Jeyalatha Diagnosis of Diabetes Using Classification Mining Techniques,IJDKP 2015
8. Han Wu,Shengqi Yang,Type 2 Diabetes Mellitus Prediction Model Based on Data Mining,Informatics in medicine unlocked 2018 9. Humar K, Novruz A. Design of a hybrid system for the diabetes and
heart diseases.Expert Syst Appl 2008;35:82–9.
10. Patil BM. Hybrid prediction model for Type-2 diabetic patients. Expert Syst Appl 2010;37:8102–8108.
11. Ahmad Aliza, MustaphaH Aida. Comparison between neural networks against decision tree in improving prediction accuracy for diabetes mellitus. ICDIPC 2011,Part I. CCIS 188; 2011. p. 537–45.
12. Marcano-Cede~no Alexis, Torres Joaquín, Andina Diego. A prediction model to diabetes using artificial metaplasticity. IWINAC 2011, Part II. LNCS 6687; 2011.p. 418–25.
AUTHORS PROFILE
Sai Poojitha Nimmagadda, currently pursuing Master of Technology in Software Engineering at VNR Vignana Jyothi Institute of Engineering and Technology (VNRVJIET) affiliated to JNTU Hyderabad. She worked as quality analyst in an MNC at Hyderabad. Her interests include data analytics, data mining and machine learning.
Dr. Sagar Yeruva, is currently working as Associate Professor in Department of Computer Science and Engineering at VNRVJIET, Hyderabad, India. He is also the Coordinator for M.Tech. (Software Engineering) Programme. He has obtained Ph.D (CSE) on the topic “Design of Distributed Data Warehouses-Fragmentation Approach” from JNTU Hyderabad in June 2017. Dr. Y.Sagar has published 12 research papers in national and international journals and presented 6 research papers in national and international conferences. He is a review member for International Journal called ASTESJ and also for various international conferences. His area of research includes data mining, data analytics and machine learning.