International Journal of Innovative Technology and Exploring Engineering (IJITEE) ISSN: 2278-3075, Volume-8 Issue-7, May, 2019
Abstract: Liver is the largest internal organ and is vital for the human body’s survival. It is prone to many diseases such as Liver tumor, Fibrosis, etc. In order to know the condition of the liver, the most commonly preferred method is biopsy. But since it is a very complex and complicated procedure it is being replaced by computer-aided diagnosis (CAD) where the liver is classified into various types like normal, abnormal etc. In this study, we have compared the performance of the CAD systems namely six classifiers for CT image classification. The data of 26 patients was taken into consideration and their status was confirmed by a radiologist. The images were separated into normal and abnormal based on textural features and based on these features the performance of each classifier has been evaluated for the parameters such as accuracy, specificity and sensitivity. Amongst all the classifiers we found out that the best results were obtained for k-NN with accuracy of 88.5%.
Index Terms: CAD, k-NN, SVM, Textural features
I. INTRODUCTION
The liver is one of the most essential organs in the human body, it has many functions such as making proteins, breaking down and detoxifying substances in the body etc. As these are very important bodily functions so any hinderances in the normal working of the liver can be fatal. These hinderances can be in the form of tumor, fibrosis, cancer etc. The main reason for such diseases is inadequate lifestyle choices such as alcohol consumption, unhealthy eating etc. Liver diseases can also occur as a side effect of medications, due to industrial toxins or as a result of genetic disorder. As per reports, liver diseases are one of the most common causes of deaths globally. The rate of reported cases has been rapidly increasing year after year. Thus, we can say that liver diseases are a major public health problem worldwide. As liver disease is such a huge health problem diagnosis at an early stage is an important task. Currently liver biopsy is the standard procedure for diagnosis of liver diseases, but it has its own set of drawbacks. Biopsy is an invasive method and if gone wrong can lead to serious discomfort to the
Revised Manuscript Received on May 10, 2019.
P.Malin Bruntha, Department of Electronics and Communication Engineering, Karunya Institute of Technology and Sciences, Coimbatore, India. S. Dhanasekar, Department of Electronics and Communication Engineering, Karunya Institute of Technology and Sciences, Coimbatore, India. J. Grace Jency, Department of Electronics and Communication Engineering, Karunya Institute of Technology and Sciences, Coimbatore, India. S. Immanuel Alex Pandian, Department of Electronics and Communication Engineering, Karunya Institute of Technology and Sciences, Coimbatore, India.
Prashant S Pillai, Department of Electronics and Communication Engineering, Karunya Institute of Technology and Sciences, Coimbatore, India Steven Pramod T, Department of Electronics and Communication Engineering, Karunya Institute of Technology and Sciences, Coimbatore, India. Vaibhav Malani, Department of Electronics and Communication Engineering, Karunya Institute of Technology and Sciences, Coimbatore, India.
patient. There have been many cases of pain, infection and other complications reported. Thus, there is need for non-invasive techniques for diagnosis of liver diseases. Technological developments have enabled us to diagnose the fatal diseases by Smart and Advanced techniques. The advancement in medical field has provided sensitive and specific instruments for diagnosis which benefits in medical diagnosis. Due to the developments in Image and Signal Processing technologies, patients are no longer needed to be monitored by doctors using physical (or) classic methods, but automatically by computer aided diagnosis. Medical technology has been advancing rapidly, as a result of which the conventional techniques are being replaced by the newly introduced automatic techniques.
Computer-aided diagnosis (CAD) is a system that assists doctors in the analysis of medical images. Imaging techniques such as X-ray, MRI, and ultrasound diagnostics conveys a lot of information that the radiologist or other medical professional has to analyze examine and evaluate convincingly in a short time. CAD systems captures and processes the images taken into digital formal and highlights suspicious areas which could be the potential effected area in the human body offering much need information to the medical professional.
CAD is seen a potential for futuristic medical advancement which could propel the automated surgery to new heights using algorithms and data interpretation. CAD is an interdisciplinary technology that is developed to aid the medical experts by combing the fields of Artificial intelligence and computer vision. The most commonly found disease using CAD is tumor. CAD systems are usually relied on for evaluating situations which the professional feels can be life threatening or will have a major impact on the medication factor.
II. STATEMENTOFPROBLEM
In the current scenario, the fatal diseases like liver tumor and cancer are diagnosed by classical techniques such as biopsy. So, in order to get accurate results, we have been using biopsy. But it can at times be fatal and time taking. In order to reduce the diagnosis time and reduce the fatality, we have studied different types of systems for computer-aided diagnosis methods.
III. MATERIALSANDMETHODS
The procedure for the current study is represented in the following flowchart Fig.1.
Performance Analysis of Certain Classifiers for
Liver CT Images
Fig. 1 Flow diagram
A. Data acquisition
CT imaging is currently one of the best imaging techniques that are used for diagnostic purposes. CT scan is the most common method used to detect liver masses. Thus, in this comparative study we have made use of CT scan slices. The Images used in this study are taken form RK diagnostics centre Govt. General Hospital in Vijayawada. We have considered 26 patient CT images for our study of which 21 are male and 5 are female ranging from the age group of 12-70 years. The best slices from the set of images have been selected and verified for abnormality and then were sorted out into normal and abnormal images by Dr V. Ramana (Radiologist). The images are taken are in the following settings: 5/5mm plain, L=50, W=400 and resolution is 468x83.
B. Pre-processing
In the pre-processing step, in order to eliminate unnecessary patient details as well as machine settings from the CT scan, we cropped the image from 468x833 to 401x401.Since the input images are in RGB format the images were converted from RGB to Gary scale in order to convert the image from 3 plane to single plane, so that the GLCM features can be calculated. This is illustrated in Fig 2(a), Fig 2(b).
Fig. 2(a) Original CT image
Fig. 2(b) Preprocessed image
C. Feature extraction
In this study, we have used GLCM feature extraction technique. Since the textural feature [10] [11] are to be obtained, we have selected the Haralick features [2] such as contrast, correlation and entropy etc. The features are then calculated and stored in a feature vector. Out of the 14 extracted features, we have selected 2 features namely contrast and difference entropy and these are fed as input to the classifiers.
D. Classification
In this study, the contrast and difference entropy features are given to seven classifiers namely: Decision Tree, Discriminant Analysis (linear, quadratic), SVM, k-NN, Logistic regression, Ensemble.
1. Decision tree
Decision tree [5] is simple to understand, quick fitting and prediction classification model, and its usage of memory is low. The only drawback is that they can have low predictive
accuracy. In the current model the preset used is fine tree with maximum number of splits as 100 and split criterion as
Gini’s
Fig. 3 Confusion matrix for decision tree
[image:2.595.365.487.68.196.2] [image:2.595.324.530.494.620.2] [image:2.595.41.283.528.670.2]International Journal of Innovative Technology and Exploring Engineering (IJITEE) ISSN: 2278-3075, Volume-8 Issue-7, May, 2019
2. Discriminant Analysis
[image:3.595.56.271.71.193.2]
Fig. 4 ROC curve for decision tree
Discriminant analysis is a classification method. This method considers different classes which generate data on the basis of Gaussian distribution.
2. 1 Linear
[image:3.595.303.550.74.216.2]Linear Discriminant Analysis (LDA) [8] also known as the Fisher discriminant is a type of discriminant analysis. For this classification model we used the preset “linear discriminant” with covariance structure “full”. The confusion matrix and ROC curve are shown in Fig 5 and Fig 6.
[image:3.595.304.550.241.337.2]Fig. 5 Confusion matrix for LDA
Fig. 6 ROC curve for LDA
2. 2 Quadratic
Quadratic discriminant analysis (QDA) is like LDA the only difference is that it assumes that each class has its own co-variance matrix. For this classification model, we used the pre-set quadratic discriminant with covariance structure as
full. The confusion matrix and ROC curve are shown in Fig 7 and Fig.8.
[image:3.595.46.292.361.506.2]Fig. 7 Confusion matrix for QDA
Fig.8 ROC curve for QDA
3. Logistic regression
[image:3.595.305.549.474.578.2]Logistic regression [7] is a well-known classification algorithm, it is simple to try and can be easily understood. This is mostly used when there are 2 classes. The classifier sketches the class probabilities into a function of linear combination of predictors. For this classification model, we used the pre-set as logistic regression. The confusion matrix and ROC curve are shown in Fig 9 and Fig 10.
[image:3.595.46.293.529.678.2]Fig. 9 Confusion matrix for logistic regression
[image:3.595.304.516.611.726.2]4. SVM
[image:4.595.304.550.62.173.2]The SVM [3][1]classifier classifies data by finding out the best hyperplane which separates all data points of one class from that of the other class. The plane from which the distance, also known as margin, of the support vectors of the two classes is maximum is said to be the best hyperplane for the current SVM model. In this classification model we used the pre-set Fine Gaussian SVM with kernel function as Gaussian. The kernel scale is 0.94 and box constraint level is 1. The confusion matrix and ROC curve are shown in Fig 11 and Fig 12.
Fig. 11 Confusion matrix for SVM
Fig. 12 ROC curve for SVM
5. k-NN
[image:4.595.45.292.191.468.2]k-nearest neighbour (k-NN) [4][1] allows one to find the k closest points to the query point. The classifier then classifies the point in accordance with its neighbours. In this classification model we used the pre-set weighted k-NN with number of kernels as 10. The distance metric used is Euclidian, and the distance weight is squared inverse. The kernel scale is 0.94 and box constraint level is 1. The confusion matrix and ROC curve are shown in Fig 13 and Fig 14.
Fig. 13 Confusion matrix for k-NN
Fig. 14 ROC curve for k-NN
6. Ensemble
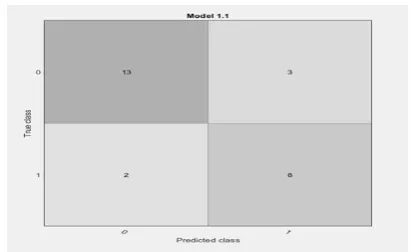
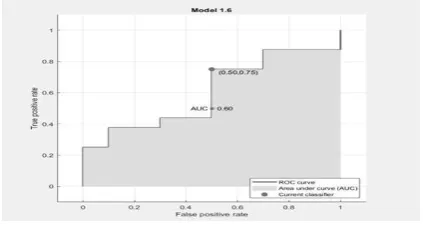
[image:4.595.305.549.288.424.2]Ensemble [6] classifier combines the results from several weak learners into a single high-quality ensemble model. In this classification model we used the pre-set bagged trees with ensemble method bag. The learner type is decision tree and number of learners is 30. The confusion matrix and ROC curve are shown in Fig 15 and Fig 16.
[image:4.595.308.546.448.564.2]Fig. 15 Confusion matrix for Ensemble
Fig 16. ROC curve for Ensemble
IV. RESULTSANDDISCUSSIONS
[image:4.595.47.290.621.761.2]International Journal of Innovative Technology and Exploring Engineering (IJITEE) ISSN: 2278-3075, Volume-8 Issue-7, May, 2019
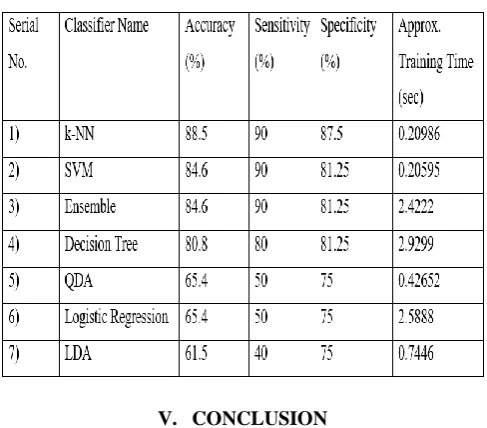
Table. 1 Performance metrics for various classifiers
V. CONCLUSION
Liver diseases are one of the most common causes of deaths around the globe. Thus, identification and classification of abnormal liver is an important task. In this study, the performance analysis of different classifiers for classification of liver CT images using contrast and difference entropy as the extracted features is done using the parameters such as accuracy, sensitivity, and specificity. These parameters are used as benchmarks to find the best one out of all the classifiers. Amongst the classifiers that we have used, the one with the best outcome was found out to be k-NN. It has a training time of 0.20986 sec, with accuracy 88.5%, specificity 87.5%, and sensitivity 90%. k-NN is followed by SVM with a training time of 0.20595 sec, with accuracy 84.6%, specificity 81.25%, and sensitivity 90%. The worst performing classifier was LDA with a training time of 0.7446 sec, with accuracy 61.5%, specificity 75%, and sensitivity 40%.
REFERENCES
1. Ömer Kayaaltı, Bekir Hakan Aksebzeci, Ibrahim Ökkes¸ Karahanc, Kemal
Deniz, Mehmet Öztürkc, Bülent Yılmaz, Sadık Karaf, Musa Hakan Asyalı “Liver fibrosis staging using CT image texture analysis and soft computing,” Applied Soft Computing, vol. 25, 2014, pp. 399–413.
2. R.M. Haralick, K. Shanmugam, and I. Dinstein “Texture features for
image classification,” IEEE Trans.Syst.Man.Cybern., vol SMC-3, 1973, pp. 610-621.
3. Daljit Singh, Kamaljeet Kaur “Classification of Abnormalities in Brain MRI Images Using GLCM, PCA and SVM,” International Journal of Engineering and Advanced Technology (IJEAT), Vol 1 Issue-6, Aug. 2012, ISSN: 2249 – 8958
4. Patidar, D., Shah, B. C., & Mishra, M. R. “Performance analysis of K Nearest Neighbours image classifier with different wavelet features,” International Conference on Green Computing Communication and Electrical Engineering (ICGCCEE), 2014.
5. . M. E. Moret. “Decision Tree and Diagrams,” Computer Surveys, vol 14(4), 1982, pp. 593-623.
6. Hansen L, Salamon P “Neural Network Ensembles,” IEEE Trans Pattern
Analysis and Machnie Intell, vol. 12, 1990, pp. 993-1001.
7. Breiman, L., Friedman, J.H., Olshen, R.A., & Stone, C.J. “Classification and Regression Trees,” Wadsworth Int. Group, Belmont, California, USA, 1984.
8. S. Balakrishnama and A. Ganapathiraju “Linear discriminant analysis-a
brief tutorial,” Institute for Signal and Information Processing, 1998. 9. P. A. Lachenbruch and M. Goldstein, “Discriminant Analysis,”
Perspectives in Biometry, Vol. 35, Mar. 1979, pp. 69-85.
10. K.Mala, V.Sadasivam, and S.Alagappan“Neural Network based Texture
Analysis of Liver Tumour from Computed Tomography Images,” World
Academy of Science, Engineering and Technology International Journal of Medical and Health Sciences,vol. 2, 2008.
11. D. Selvathi, C. Malini, P. Shanmugavalli, “Automatic Segmentation and