P.Tamije Selvy, M.Anitha
Abstract: Brain tumor is an unusual intensification of cells inside the skull. The brain MRI scanned images is segmented to extract brain tumor to analyze type and depth of tumor. In order to reduce the time consumption of brain tumor extraction, an automatic method for detection of brain tumor is highly recommended. Deep machine learning methods are used for automatic detection of the brain tumor in soft tissues at an early stage which involves the following stages namely: image pre-processing, clustering and optimization. This paper addresses previously adduced pre-processing (Skull stripping, Contrast stretching, clustering (k-Means, Fuzzy c-means) and optimization (Cuckoo search optimization, Artificial Bee Colony optimization) strategies for abnormal brain tumor detection from MRI brain images. Performance evaluation is done based on computational time of clustering output and optimization algorithms are analyzed in terms of sensitivity, specificity, and accuracy.
Keywords : Cerebro spinal fluid (CSF), computer aided diagnosis (CAD), magnetic resonance imaging (MRI), skull stripping.
I.INTRODUCTION
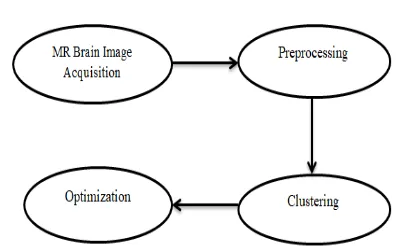
Image process is one in all the foremost vital roles within the field of Medical Imaging. Within the image process system, associate input is a picture that is typically thought-about as a two- dimensional signal whereas process and therefore the output could also be a picture or the characteristics of the input image. Detection of brain tumors in imaging is conventionally performed via talent and data of consultants [2]. This manual assessment on growth leads to totally different ratings [1], [3] that create it tough for a general agreement. Computer-aided designation (CAD) system is tested to be the most effective technique for automatic growth detection at associate early stage. A Computer-Aided designation (CAD) system is developed for automatic detection of brain tumour through imaging. The CAD system will give a far better mechanism to spot brain tumors than typical strategies. designation and police work tumors in imaging brain pictures involves the steps of pre-processing, bunch and optimisation [4].
A.Magnetic Resonance Imaging (MRI)
Author Magnetic-Resonance-Imaging (MRI) which follows the principle of Nuclear Magnetic Resonance is the best and non-invasive visualization method which allows images of the internal anatomical structure of the human body. MRI scan is a radiology method that uses magnetism, radio waves, and a computer to produce images of human body structures.
Revised Manuscript Received on September 03, 2019
P.Tamije Selvy, Department of Computer Science and Engineering, Sri Krishna College of Technology / Coimbatore, India.
M.Anitha, Department of Computer Science and Engineering, Sri Krishna College of Technology / Coimbatore, India.
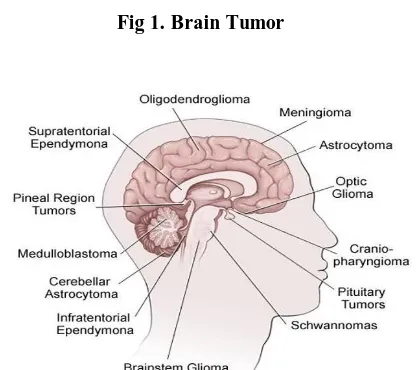
MR image illustrates anatomy in greater detail and is more sensitive and specific to abnormalities within the brain itself. The brain consists of various tissues like gray substance (GM), substantia alba (WM) and cerebro-spinal fluid (CSF). One major malady that severely affects the brain is that the neoplasm that is the most important causes for the rise in mortality. Neoplasm as shown in Fig 1 is additionally called intracranial tumor. It Is the most reason behind abnormal growth of the cells within the brain or the central canal. A neoplasm is classed as either benign or malignant. A neoplasm is nott cancerous and does not unfold to different components of the body. In distinction, a tumor is cancerous; it can penetrate and destroy healthy body tissues, similarly as travel different components of the body. a number of the brain tumors square measure astrocytomas, glioblastoma, oligodendroglioma and ependymoma as illustrated Fig 2.
[image:1.595.326.534.474.659.2]Fig 1. Brain Tumor
Fig 2. Location of various brain tumors
II. RELATEDWORKS
Ahmed and Iftekharuddin planned that resonance Imaging (MRI) may be an
extremely acceptable means than CT (CT) to a mass higher resolution pictures of the brain. Because of accuracy and soft tissues of brain distinction permits the discrimination of the nerve affiliation from the congregations of neurons and humor (CSF). To support the diagnosis of assorted brain diseases analysis of the spatial distribution of these tissues are done [5].
Ayed, Kharrat associated Halima [6] and planned an approach that consists of 5 phases: 1) feature extraction is completed via 2D distinct Wave1et rework & spatial grey Level Dependence Matrix (DWT-SGLDM), 2) features are chosen SA, 3) over-fitting is avoided using Stratified K-fo1d Cross Va1idatio, 4) GA-SVM model is employed to optimize SVM parameters and 5) SVM is employed for making the classifier.
Stratified K-fo1d Cross Va1idatio, 4) GA-SVM model is used to optimize SVM parameters and 5) SVM is used for creating the classifier.
Ivana Despotovi [7] Ivana Despotovi [7] planned FCM primarily for clustering techniques that are mainly for spatially coherent image segmentation types. The membership function is evaluated to repay for the results of noisy images. The neighborhood was established to permit further reliable image smoothing without segmentation.
El-Khamy, El-Khoreby and Sadek [8] introduced a hybrid technique of FCM and confirmed threshold. The proposed technique consists of five stages: 1) pre-processing for enhancing the intensity of input brain MR, 2) use of a rectangular window for image histogram to calculate the number of clusters for FCM input, 3) use FCM to find the center of clusters, 4) use the conformed threshold value in order to segment the tumor and 5) tumor detection from the segmented image. This method has proved to better compared to other techniques in terms of processing time. Its future work includes tumor diameter calculation in three dimensional brain MRI images for accurately planning the treatment.
Anitha et al. [9] proposed the adaptive pillar K-mean algorithm for effective division. In the proposed framework, initially neural system prepared the highlights extricated from the discrete wavelet change mix wavelets furthermore, the resultant channel factors were thus prepared by the K-closest neighbor and the testing procedure was moreover fulfilled in two phases. The proposed system has been approved with the help of genuine informational sets and the experimental outcomes indicated improved execution.
Jobin Christ MC1 and Raman Subramanian [10] proposed a swarm intelligence based tumor segmentation. The swarm intelligence is developed based on ecological behavior of clown fish. Automatic MRI brain tumor segmentation is presented in this paper. The results of swarm intelligence based approach are compared with existing Fuzzy C-Means clustering, self-organizing map and particle swarm optimization. The outcomes prove that the proposed algorithm is a highly promising method for segmenting dangerous brain tumors effectively.
Pearson. K [11] illustrated that Histogram based methods provide efficient segmentation results in comparison with other image segmentation methods, because they require only one entry through the pixels. By this technique, a
histogram is calculated from all the pixels present in the image. The peaks and valleys present in the histogram are used to allocate the clusters in the image. This procedure is repeated with the formation of smaller and smaller clusters until no more clusters are formed.
III. DATAANALYTICSMETHODS
Fig 3. Flow diagram of Computer-Aided Diagnosis (CAD) system
A.Pre-processing
Define Pre-processing increases and enhances the quality of the image to get better and accurate results. This process is related to the improvement of an input image so that the final result obtained after improvement is more suitable for a specific application. Some applications of Image enhancement techniques are 1. sharpening or de-blurring an out focused image, 2. highlighting edges, 3. improving the contrast levels or brightening an image, 4. noise removal.
Skull Stripping: Skull stripping is one among the foremost necessary pre-processing steps for the analysis of tomography pictures [12]. This methodology is outlined because of the method of removal of non-cerebral tissue regions like bone, scalp and membrane from the brain soft tissues. Removal of the bone region reduces the probabilities of misclassifying unhealthy tissues. Original Red, Green, and Blue (RGB) or grey scale image ought to be regenerated to a binary image. The result is a skull stripped version of the initial MRI image as represented in Fig. 4.
Fig 4. (a) and (b) - CT of the brain before and after skull stripping respectively. (c) and (d) - MRI of the brain before
[image:2.595.328.526.162.285.2] [image:2.595.330.523.589.711.2] Contrast Stretching: Image enhancement could be a method to enhance the visual look of a picture or to convert the image to a type higher fitted to analysis by a personality or a machine. Contrast enhancement is a method to improve the visual elements of an image for appropriate applications. It helps to reinforce the clarity of the image, that makes any analysis becomes easier and quicker. Enhancement conjointly explores the hidden options within the image. [13].
Fig 5. (a) and (d) - Examples of original MRI Brain image. (b) and (e) - Skull stripped image of (a) and (d).
(c) and (f) - Contrast enhanced image of (b) and (e) respectively.
B.Clustering
Unsupervised K-means and fuzzy C-means (FCM) clustering are the methods to segment brain image into brain tumor and other brain parts [14]. The principle behind cluster is maximizing the similar pixel block similarity and minimizing the dissimilar pixel block similarity. K-means cluster segment the image pixel block based on distance between centroid block with other blocks. In FCM, pixel blocks are clustered based on the membership values assigned.
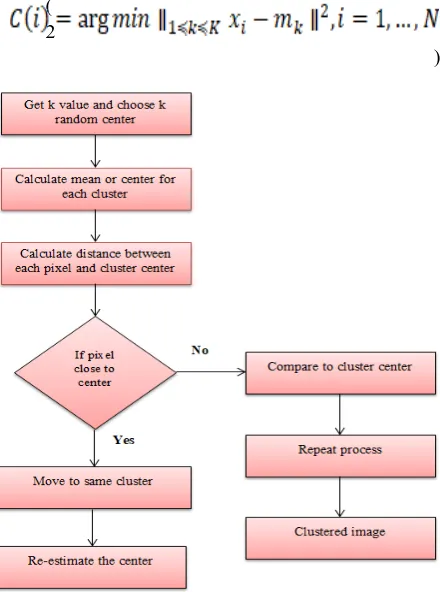
K-Means Clustering: K-means clustering is the best-squared error based clustering which works well for hyper spherical clusters. K-means algorithmic rule is the simplest and the most typically used algorithmic rule, using a square error criterion. K-Means cluster is an iterative technique that provides partitioning an image into K clusters. Then k-cluster centers are chosen in a random manner. The gap between every pixel block to every centroid pixel block is calculated. Each single pixel block is segmented in to a cluster which is minimum in distance. Then the centroid is re-estimated. Again every pixel block is compared to all centroid pixel blocks. The method continues till the cluster center converges. Flowchart of this algorithmic rule is shown in Fig 6. K-means clustering is employed since it is straightforward and has comparatively low procedure quality. The process continues until the center converges which is calculated using (1).
(1)For a current set of cluster means, assign each observation as denoted in (2):
( 2
)
Fig 6. Flowchart of k-means Clustering Algorithm
1. Give the no of cluster value as k
2. Randomly choose the k pixel block as centers 3. Compute the distance between each pixel block to each
center pixel block.
4. Allocate the pixel block to the cluster where the distance between pixel block and centroid pixel block is minimum
5. Re-estimate the centroid pixel block by calculating mean of all pixel block in the cluster.
6. Repeat step 3 until centroid pixel block is converged.
Fuzzy c-Means Clustering: A fuzzy set theory is utilized for clustering methods to improve the purity of cluster. Fuzzy c-means (FCM) segments by assignment of membership to pixel block based on the idea of distance between the pixel block and centroid pixel block. Formula for calculation of objective function is shown in equation (3).
(3) where, n is the number of pixel block, : stand for the centroid pixel block , m is the fuzzy membership range m ∈ [1, ∞], c represents the number of cluster used for segmentation, i represents the fuzzy membership matrix and represents the Euclidean distance between th and th pixel
[image:3.595.328.548.92.388.2] [image:3.595.68.286.119.324.2]block.
Algorithm
1. c cluster centers are randomly selected. 2. Euclidean distance, ||xi-vj|| is computed.
3. Membership grade in each cluster is calculated for each data point
4. Cluster centers are updated for each generation. 5. Steps 3 and 4 will be repeated until no more variations in the cluster centers.
FCM clustering is terminated.
[image:4.595.324.552.153.472.2] Performance Analysis: The computational time for different number of clusters using three different clustering techniques namely FCM and k-Means are depicted in Table I and Table II.
Table-I: Efficiency of k-Means, FCM where number of Clusters=3
Clustering Algorithm Computational Time (s)
k-Means 1.2636
FCM 6.9732
Table-II: Efficiency of k-Means, FCM where number of Clusters=4
Clustering Algorithm Computational Time (s)
k-Means 5.232
FCM 11.8561
D. Optimization
Optimization algorithms are used for much purpose like optimizing classifier, cluster and other computer intelligence processes. In this paper, the FCM clustering is optimized by Cuckoo Search (CS) and Artificial Bee Colony (ABC) optimization technique.
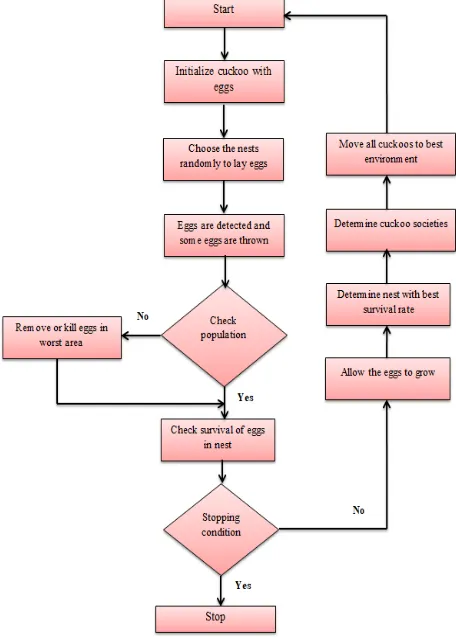
Cuckoo Search Optimization: The Cuckoo Search (CS) [15] is a meta-heuristic optimization algorithmic rule impressed by the bird cuckoo. CS is employed in solving several optimization issues. Cuckoo no way builds its own nest and leaves their eggs in the other host bird nest. The other host bird throws those eggs from its nets if it identifies the unknown egg in its nest or just disembarrasses its nest and builds a new nest. Every cuckoo egg symbolizes a new solution. The target is to search out better solutions to replace a solution. This algorithmic rule may be within the simplest type with every nest has one egg. The algorithmic rule is extended to additional difficult cases during which every nest has multiple eggs representing a group of solutions. Cuckoo Search (CS) rules as follows:
i. Each Cuckoo bird leaves one egg in a randomly chosen nest.
ii. The nests which have the high-quality features of
eggs might be carried over to the next generation. iii. The number of cuckoo and host next are initialized and the probability in which the host bird discovers the egg leaves by the cuckoo is Pa (0, 1).If a host bird recognizes the cuckoo egg with the probability of pa = 0, 1 then the host bird can either throw them away or abandon them and build a new nest.
Fig 7. Framework of Cuckoo Search Optimization Artificial Bee Colony Optimization: The artificial bee
colony (ABC) [16] algorithm is a swarm intelligence algorithms developed based on foraging behaviors of honey bees. The honey is categorized as employed bees, onlooker bees and scout bees. A bee leaving to find source (solutions) in a previously visited path is known as employed bee. A bee search a random solution to find best solution to replace worst solution of employed bee is named as scout bee. The onlooker bee is dancing around the solution of employed bee to find better solution. The main steps of the algorithm are given below:
i. Initialize.
ii. a) Search solutions by the employed bees
(b) Place the onlooker bees around the solution of employed bee to find new solutions
(c) If onlooker bee solution is better than employed bee solution then replaces employee bee solution by onlooker bee solution
[image:4.595.45.291.255.489.2]employed bee solutions . iv. Repeat (ii) until
convergence of solutions.
[image:5.595.51.291.113.243.2] Performance Analysis:
Table-III: Efficiency Formula to Calculate Performance Metrics
Performance Metrics Equation
Sensitivity (Se) TP/(TP+FN)*100
Specificity (Sp) TN/(TN+FP)*100
Accuracy (Acc) (TP+TN)/(TP+TN+FN+FP)*100
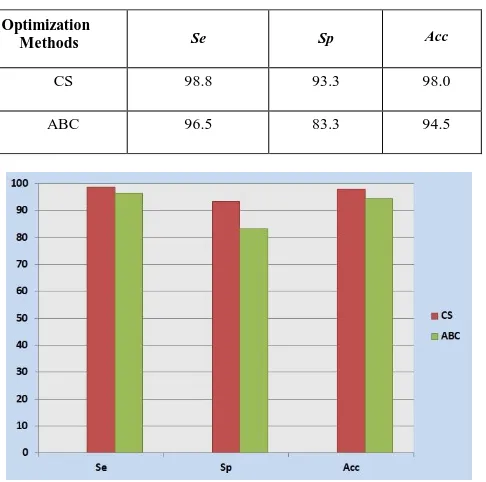
[image:5.595.47.290.389.630.2]Taking table III into account, it represents the formula of defining sensitivity, specificity and accuracy of CS and ABC optimization algorithms.TP represents True Positive (correctly analysed), TN denotes True Negative (correctly discarded), FP denotes False Positive (incorrectly analysed), and FN is False Negative (incorrectly discarded). Table-IV provides the performance analysis in terms of sensitivity, specificity and accuracy of CS and ABC optimization algorithms.
Table-IV: Performance Analysis of CS and ABC optimization techniques
Fig 8. Performance analysis of CS and ABC Optimization techniques
Performance analysis of Cuckoo Search and Artificial Bee Colony is graphically shown in fig 8 which compares the Se, Sp and Acc. CS provides 98.8, 93.3 and 98 of sensitivity, specificity and accuracy respectively while ABC provides 96.5 of sensitivity, 83.3 of specificity and 94.5 of accuracy. It has been proved that performance analysis of CS is far better than ABC in terms of all performance metrics.
IV. CONCLUSION
MRI is the best image diagnostic model used for image examination of brain tumor. Clustering plays a crucial role in correct detection of brain tumor in tomography medical pictures. Preprocessing techniques discussed here are skull stripping and contrast stretching. Clustering techniques like k-means and FCM are compared. Computational time of clustering algorithms is taken under consideration for comparison. Outcomes of two clustering algorithms when compared prove that Fuzzy c Means is better than k-Means in terms of computational time. Two optimization techniques mentioned are Cuckoo Search Optimization and Artificial Bee Colony Optimization. Performance criteria of optimized images are based on sensitivity, specificity and accuracy. Comparison results prove that Cuckoo Search optimization algorithm provides sensitivity of 98.8%, specificity of 93.3% and accuracy of 98%.
REFERENCES
1. L. O. Wahlund, F. Barkhof, F. Fazekas, L. Bronge, M. Augustin,M. Sj ogren, A. Wallin, H. Ader, D. Leys, L. Pantoni, F. Pasquier, T. Erkinjuntti, and P. Scheltens, “A new rating scale for age-related white matter changes applicable to MRI and CT,” Stroke, vol. 32, pp. 1318–1322, 2001.
2. E. Matsusue, S. Sugihara, S. Fujii, E. Ohama, T. Kinoshita, and T. Ogawa, “White matter changes in elderly people: MR-pathologic correlations,” Magn. Reson. Med. Sci., vol. 5, pp. 99–104, 2006. 3. F. Fazekas, “Pathological correlates of incidental MRI white matter
signal hyper intensities,” Neurology, vol. 43, pp. 1683– 1689, 1993. 4. J. Udupa, L. Wei, S. Samarasekera, Y. Miki, M. A. van Buchem, and R. I.
Grossman, “Multiple sclerosis lesion quantification using fuzzy connectedness principles,” IEEE Trans. Med. Imaging, vol. 16, no. 5, pp. 598–609, Oct. 1997.
5. Ahmed, S. and K.M. Iftekharuddin, 2011. Efficacy of texture, shape and intensity feature fusion for posteriorfossa tumor segmentation in MRI. IEEE Trans. Inform. Technol. Biomed., 15: 206-213. DOI: 10.1109/TITB.2011.2104376.
6. A. Kharrat, M. B. Ayed, and M. B. Halima, “MRI Brain Tumor Classification using Support Vector Machines and Meta-Heuristic Method,” 2015 Int. Conf. Intell. Syst. Des. Appl., pp. 446–451, 2016. 7. Despotovi I. Segers, L. Platisa, E. Vansteenkiste, A. Pizurica, K. Deblaere
and W. Philips, “Brain MRI Segmentation for Focal Cortical Dysplasia Lesion Detection”, Proc. Intl. Soc. Mag. Reson. Med. 19 2011. 8. M. A. El-Khoreby, R. A. Sadek, and S. E. El-Khamy, “An Efficient Brain
Mass Detection with Adaptive Clustered based Fuzzy C-Mean and Thresholding,” in 2015 IEEE International Conference on Signal and Image Processing Applications (ICSIPA), 2015, pp. 429–433. 9. V. Anitha and S. Murugavalli, "Brain tumor classification using two- tier
classifier with adaptive segmentation technique", Research Article, vol.9, pp. 1–9, 2016.
10. Clown fish queuing and switching optimization algorithm for brain tumor segmentation. Jobin Christ MC1*, Raman Subramanian.
11. Pearson. K, Contributions to the Mathematical Theory of Evolution. II. Skew Variation in Homogeneous Material, Philosophical Transactions of the Royal Society A: Mathematical, Physical and Engineering Sciences, 186, 343–414. Bibcode: 1895RSPTA.186.343P. doi:10.1098/rsta.1895.0010, 2014.
12. S. Bauer, L.-P. Nolte, and M. Reyes, Skull-stripping for tumor- bearing brain images, arXiv preprint arXiv: 1204.0357, 2012.
13. Mokhtar, Nurhayati and Harun, Nor Hazlyna and Mashor, Mohd Yusoff and H., Roseline and Mustafa, Nazahah and Adollah, Robiyanti and H., Adilah and Mohd Nasir, Nashrul Fazli (2009) Image Enhancement Techniques Using Local, Global, Bright, Dark and Partial Contrast Stretching For Acute Leukemia Images. In: World Congress on Engineering 2009 Vol I, July 1 - 3, 2009, London, U.K.
Optimization
Methods Se Sp Acc
CS 98.8 93.3 98.0
Author-2 Photo
Author-1 Photo
14. Alan Jose, S.Ravi, M.Sambath, “Brain Tumor Segmentation Using K-Means Clustering And Fuzzy C-Means Algorithms And Its Area Calculation,” International Journal of Innovative Research in Computer and Communication Engineering, vol. 2, no. 3, pp. 3496-3501, 2014. 15. Xin-She Yang, Suash Deb, “Cuckoo search: recent advances and
applications”, Springer-verlog, London, 2013.
16. Dervis Karaboga, Bahriye Basturk, “A powerful and efficient algorithm for numerical function optimization: artificial bee colony (ABC) algorithm”, © Springer Science Business Media B.V. 2007.
AUTHORSPROFILE
Dr.P.Tamijiselvy obtained her B.Tech (CSE) degree from Pondicherry Engineering College, India in the year 1996 and M.Tech (CSE) degree from Pondicherry University, India in the year 1998. She obtained her Doctorate from Anna University. At present she is working as professor in the Department of Computer Science and Engineering, Sri Krishna College of Technology, Coimbatore with work experience of 21 years. She has participated in various National and International conferences. Her areas of interests are image processing, data mining and artificial intelligence. Her research works include medical imaging.