International Journal of Innovative Technology and Exploring Engineering (IJITEE) ISSN: 2278-3075, Volume-8 Issue-11, September 2019
Abstract: The world of digital media is thriving by the day and hence, there is an urge of businesses to magnify it more gaining them maximum financial benefits. This particular urge calls for more and more expansions concerning creating and developing new content whether it's in the form of websites that aims at branding businesses or could be in the form of online newspapers and magazines. Since from last few decades’ medium of communication had changed. Now a day people are using social networks very extensively for news updates. These networks aim to make social lives better. Today, everyone knows and uses social media which contains unverified article, post, message and news. Nowadays' fake news is making various issues from mocking articles to a created news and plan government publicity in certain outlets. Fake news and the absence of trust in the media are developing issues with immense consequences in our general public. It is needed to look into how the techniques in the fields of computer science using machine learning, natural language processing helps us to detect fake news. Fake news is now observed as one of the major threats to freedom of expression, journalism, and democracy of a country. In this research, a comprehensive way of detecting fake news using machine learning model has been presented that is trained by Fake News data based on US election and trained on recent Indian political Fake news.
Keywords : Fake News Detection, Machine Learning, Natural Language Toolkit, Text processing, Receiver Operating Characteristic ( ROC) curve.
I. INTRODUCTION
The world of advanced digital media is expanding continuously thus does the inclination of organizations to grow it all the more picking up them greatest financial advantages. This particular urge calls for an ever-increasing number of progressions concerning making and growing crisp substance, whether as websites that goes for marking organizations or as online papers and magazines [1]. Since from last few decades’ medium of communication had changed. Now a day people are using social networks very extensively for news updates. In terms of data our research is completely based on the data and information that possibly can be gathered from the internet, open-source database repositories [2]. The word Fake news came into the public
Revised Manuscript Received on September 2, 2019.
Anant Kumar, Pursuing Masters of Technology (cyber security) from Central University of Punjab, Bathinda, Punjab, India.
Dr. Satwinder Singh, Assistant Professor at Department of Computer Science and Technology, Central University of Punjab, Bathinda, Punjab,India.
Mrs. Gurpreet, Department of Law, Bathinda College of Law, Bathinda, Punjab,India.
domain during the 2016 US election and many research has been conducted regarding it. So data scientist has been working on data collection, which consists of every information regarding news like title, text, news source, a time when it was published. So many aspects have been studied and are still left to study to what level fake news can spread propaganda and can election result could be influenced in any country. Many rumors, short stories in media and study to some extent have shown that the fake news can penetrate deep into the mas and social media which can reach both urban and rural social media consumer. There is very less amount of Indian political fake news based data that can be used for machine learning. Since after the presidential election and upcoming Indian Lok Sabha Election, the increase of fake news can be seen throughout the world. Different corporate and political parties have started rooting up their IT cell which tries to touch as many as people possible using fake pages and fake accounts on facebook, twitter, Instagram WhatsApp and other apps. Now even the commercial media have started coming up with biased news and started a trend of adopting the news that benefits them the most or the people running the media house for some political or financial gain. Due to the nonavailability of structured data of Fake news related to Indian context and there has been very less analysis conducted. So one of the objectives was to add up some collection of fake and real news manually after going through articles, blogs, researches of some fake news busting websites. So the research will be covering the training of US data and testing it with Indian data. One of the understanding can be made that how efficiently fake news can be deducted using the machine that has been trained on US fake news based dataset.
II. LITERATURE REVIEW
Some important findings given by authors in the direction of Machine Learning, Fake News concepts and Natural Language processing. There have been several attempts to define fake news and to classify them as per their origin and motives theoretically and technically as per the research. For Fake news, Features that are effective for identifying satire related news, and recommend a model to find satirical news were defined by Yang et al. [3] in 2017. He proposed models is a 4-level hierarchical neural network model in which linguistic features are built-in. All four different levels of this hierarchy are based on the structure of the document. Character level, word level, paragraph level, in which the document contains entirety.
Fake News Detection of Indian and United States
Election Data using Machine Learning
Algorithm
Yang et al. took an another dig within their model. They came up with the observation that satire might be well-defined by different degrees of sarcasm, irony, and humor, by using similar techniques to determine what kind of role these three categories play in discovering satirical news, they propose the next step for their project.
A framework is proposed by Rashkin et al. [4] in 2017 in which he efforts to provide a more nuanced model for predicting news type by presenting more categories of news. They argue that not only all those types of fake news articles have the same intent but also some are meant to be humorous and are not meant to be taken as truth or as correct fact, while others are intended to persuade readers of the truthfulness of their contents. They use the unique truths of the article to define four categories of news by author or writer: satire, cheating, publicity and reliable news. They define reliable news in that form, in which the author intends to tell the truth, and uses reliable information in his articles.
Shao et al. [5] in 2017 used a public tweet dataset to investigate the temporary relationship between the wrong information and the spread of investigation of facts. Datasets were created by gathering tweets containing the fact-checking domain as well as the URL of the fake news domain. Rubin et al. [6] in 2015 Prepared the basis for the categories used by Rushkin et al. They propose three categories of misleading news serious construction, Promotional category, Deception category and humorous fake. All the categories roughly correspond to Rushkin et al. Although they investigate three types of misleading news, they eventually include these types in one category and run main analysis in only two categories: reliable and fake.
Jin et al. [7] in 2015 studied a pattern to detect rumors spread through tweets. The research used a corpus of near about 8 million tweets collected from the followers of the two Presidential Contenders and matched text in tweets against a collection of debunked rumors. The researchers assessed five matching algorithms used to match and recognize tweets against a truth base. Their study found that users that tweeted more tweets that fall into the category of ‘rumor tweets’ had a greater tweet ratio, or put another way a handful of users were responsible for the spread of the majority rumors. Additionally, their research found that rumor tweet activity was more or less constant in the earlier months of their 6-month study (Apr. 2016 - Oct. 2016) but increased gradually as election day drew near.
III. DATA SET DISCRIPTION
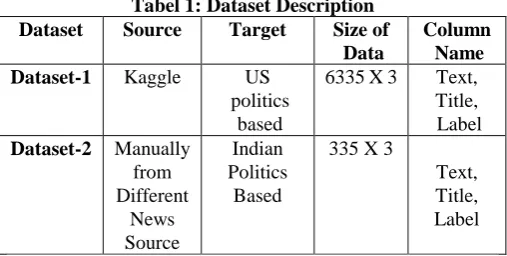
[image:2.595.300.554.54.182.2]Collecting distinct data with labels on fake news is quite a complex step in Machine Learning. Since there were no definite measure or parameter that test on what particular ground news is fake or real [8]. Two datasets were collected. The first data has been collected from kaggle repository which focuses on US-based presidential election. The second dataset has been collected manually from news and articles sources which focus on Indian politics related to fake and real news. For convenience, we shall use Dataset-1 for Kaggle website dataset and Dataset-2 for our manually collected data respectfully. Dataset-1 in this research include (6335 X 3), which means 6335 rows and three columns.
Tabel 1: Dataset Description Dataset Source Target Size of
Data
Column Name
Dataset-1 Kaggle US
politics based
6335 X 3 Text, Title, Label Dataset-2 Manually
from Different
News Source
Indian Politics
Based
335 X 3
Text, Title, Label
Each Fake news has labels in the 3rd column. So, in this research we used a data set of news that were collected from US election 2016. Other information includes no. of view count, no. of the like count, no. of comments made the count. Dataset-2 includes (335 X 3), which means 335 rows and three columns, the same format that was used in Dataset-1. So the data is collected in xlsx format as per the convenience or looking at the rate of data importing errors.
[image:2.595.306.557.334.489.2]Figure 1 shows the first five rows of dataset-1 where as first five rows of dataset-2 have been shown in fig 2 respectively. The Columns states the characteristics of the data with the target label as Fake and Real stating to what category the data belongs.
Fig 1: First five rows of Dataset-1
Fig 2: First five rows of Dataset-2
Logistic Regression (Predictive Learning Model) has been applied on the dataset. It is an arithmetical technique for examining a data set in which there are one or more independent variables that determine an outcome [9]. The outcome is determined with a dichotomous variable (in which there are only two possible outcomes i.e. either fake or real) [10]. The goal of logistic regression is to discover the finest fitting model to define the association between the dichotomous characteristic of importance (dependent variable is equal to result variable) and a set of independent (predictor or explanatory) variables [11]. The model is trained with Dataset-1 and testing has been performed using dataset-2.
IV. CONFUSION MATRIX
International Journal of Innovative Technology and Exploring Engineering (IJITEE) ISSN: 2278-3075, Volume-8 Issue-11, September 2019
Table 2: Classification Report
Precision Recall F1-score
Real News 0.61 0.38 0.47
Fake News 0.58 0.78 0.67
Figure 3: Confusion Matrix
(1)
Precision can be defined as when a positive value is predicted, how often is the prediction correct can be termed as precision [12][23]. The formula for precision has been shown in equation (1). While Recall can be defined as When the actual value is positive, how often is the prediction correct can be termed as precision. The formula for Precision has been shown in Equation (2).
(2)
F1-Score is the weighted average of Recall and Precision [13]. Thus, this score accompanies both false positives and false negatives into account. F1-Score is typically more useful than accuracy, especially if we have an uneven class distribution in our dataset [14]. The Formula for F1 has been shown in equation (3).
(3)
As the availability of applying text processing on different regional Indian languages are available freely for text analysis the to perform natural language processing, various other Indian languages can be included which will make the model much reliable to existing. Since the data size of dataset-1 is comparatively less, as the structured dataset size increases, the accuracy will certainly increase to a certain level [15]. The Precision, Recall and F1-score for the classifier in the above figure 11.4 are shown as well.
V. ROC
ROC (Receiver Operating Characteristic Curve) states how efficient the model can distinguish between two (e.g. If the news is Fake or not) [16]. Better models can differentiate among the two spaces accurately. Whereas, difficulties may arise for a poor model to differentiate between the two ROC. The curves are frequently used to illustrate the connection/trade-off between specificity and clinical sensitivity for any promising test cut-off or a combination of tests in a graphical manner. In clinical biochemistry, to select the most suitable cut-off for the test ROC curves are used. Along with the lowest false positive rate, the best cut-off has the highest true positive rate. Since, the area under a ROC curve is a degree of the usefulness of a test in general, greater the area more useful the test, To compare the usefulness of
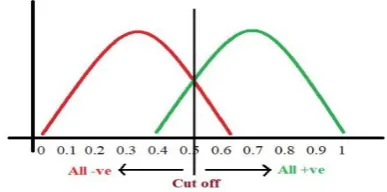
[image:3.595.336.509.114.213.2]tests the areas under ROC curves are used [17][23]. Since we have a model which predicts whether the given news is fake or not, the model predicts probabilities for each news. Here, the red curve signifies all the news which are not fake and the green curve signifies all the news which are fake.
[image:3.595.330.524.300.396.2]Fig 4: Predict_proba graph Fig (sarang, https://towardsdatascience.com, 2018) Now we have to select a value for cut off i.e. a threshold value and predict everyone as positive above that cut off (they are fake) and below which will predict as negative (they are not fake). If we set the threshold at “0.5” as shown in the figure above.
Fig 5: Predict_proba graph with cut-off
[image:3.595.299.554.488.834.2]All the positive values beyond or above the threshold will be "True Positives" and "False Positives" will be the negative values above the threshold as they are wrongly predicted as positive. All negative values below the threshold will be "True Negatives" and the positive values below the threshold will be "False Negative" because they are wrongly predicted as negative values [18][24].
Fig 6: Predict_proba graph (https://www.medcalc.org,2018)
Table 3: Labelled Confusion matrix with parameter
Fake n Real n Total
Fake True
Positive (TP)
a False
Negative (FN)
c a+c
Real False
Negative (FN)
b True
Negative (TN)
d b+d
(4)
(5)
Sensitivity: The probability of a test result being positive when the Fake News is present (true positive rate, expressed as a percentage) = a / (a+b). Specificity: probability of a test result being negative if the Fake News isn't there (true negative rate, stated as a percentage) = d / (c+d) [19].
So basically, same as (4)
(6)
The specificity provides us a true negative rate and the false positive rate is provided by (1-specificity). The sensitivity can therefore be called the ' true positive rate ' and (1 — specificity) as ' False positive rate, ' as per the Equation (6) [20]. If we select a greater criterion value, the false positive fraction will reduce with a higher specificity, on the other hand, if we select a lower threshold value, the true positive fraction and sensitivity will decrease. On the other hand, it will also increase the false positive fraction, thereby reducing the true negative fraction and specificity. So now we are looking at the positives. The TPR and FPR hits lower values as threshold is increased and TPR and FPR shifts to higher vaue as we reduce the threshold [21][22][24]. Thus, how efficiently the probabilities from the positive classes are separated from the negative classes are shown by ROC.
(7)
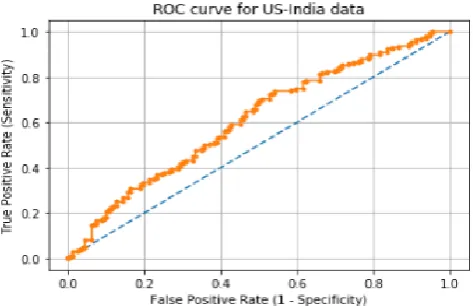
[image:4.595.311.548.55.208.2]When we lower the threshold, we get more positive values so The sensitivity increases when the threshold is lowered as we hit more positive values. In the meantime, the specificity will decrease. The specificity increases when the threshold is increased and we obtain more negative values which in result decreases the sensitivity. The ROC curve that has been obtained as per the research is shown in the figure below.
Fig 7: ROC curve for English-Hindi data
VI. CONCLUSION AND FUTURE SCOPE
A conclusion can be drawn from Fig 7. The Machine Learning Model created a linear graph basically with some area under the curve, which means it has a decent performance when it comes to identifying the difference between positive classes and negative classes. The Area under the curve will increase as the amount of meaningful and structured data in the testing and training data increases. As the amount of recent structured data increases the accuracy, recall and F1-score will increase. Since manually, data collection from a reliable source is one of the crucial and time-consuming task, a web crawler can be used for data collection in future work. Precision and other parameter are discussed in section 4. A detailed analysis can be made further using the graph and confusion matrix.
REFERENCES
1. Bloomberg, "Indiatimes.com," Times Internet, march 2019. [Online].
Available: https://economictimes.
indiatimes.com/articleshow/68457277.cms. [Accessed march 2019]. 2. B. Riedel,I. Augenstein,G.P. Spithourakis,S. Riedel, "A simple but
tough-to-beat baseline for the Fake News Challenge stance detection task," arXiv preprint , vol. 1707.03264., pp. 10-13, 2017.
3. Y. Yang, L. Zheng, J. Zhang, Q. Cui,Z. Li,P.S. Yu, "TI-CNN:
Convolutional neural networks for fake news detection," arXiv preprint arXiv:1806.00749, 2018.
4. H. Rashkin, E. Choi, J.Y. Jang, S. Volkova,Y. Choi, "Truth of varying
shades: Analyzing language in fake news and political fact-checking," Proceedings of the 2017 Conference on Empirical Methods in Natural Language Processing, pp. 2931-2937, 2017.
5. P.M. Hui, C. Shao, A. Flammini, F. Menczer,G.L. Ciampaglia, "The Hoaxy misinformation and fact-checking diffusion network," in Twelfth International AAAI Conference on Web and Social Media, 2018. 6. N.J. Conroy, V.L. Rubin, Y. Chen, "Automatic deception detection:
Methods for finding fake news," Proceedings of the Association for Information Science and Technology, vol. 52, pp. 1-4, 2015. 7. Z. Jin,J. Cao,H. Guo,Y. Zhang, J. Luo, "Multimodal fusion with recurrent
neural networks for rumor detection on microblogs," Proceedings of the 25th ACM international conference on Multimedia, pp. 795-816, 2017.
8. S. Narkhede, "Understanding AUC - ROC Curve," Towards Data
Science, 26 Jun 2018. [Online]. Available:
https://towardsdatascience.com/understanding-auc-roc-curve-68b2303 cc9c5. [Accessed 20 12 2018].
9. A. J. D'Souza, "Let’s learn about AUC ROC Curve," medium.com, 15
March 2018. [Online]. Available:
https://medium.com/greyatom/lets-learn-about-auc-roc-curve. [Accessed 21 December 2018].
10. P. Flach, "The geometry of ROC space: understanding machine learning
metrics through ROC isometrics," Proceedings of the 20th
International Journal of Innovative Technology and Exploring Engineering (IJITEE) ISSN: 2278-3075, Volume-8 Issue-11, September 2019
11. H. Mannila, "Data mining: machine learning, statistics, and databases," in Proceedings of 8th International Conference on Scientific and Statistical Data Base Management, IEEE, 1996, pp. 2-9.
12. H. Bhavsar,A. Ganatra, "A comparative study of training algorithms for
supervised machine learning," International Journal of Soft Computing and Engineering (IJSCE), vol. 2, no. 4, pp. 2231-2307, 2012.
13. G. B. Huang, Q. Y. Zhu, C. K. Siew, "Extreme learning machine: theory
and applications," Neurocomputing, vol. 70, pp. 489-501, 2006. 14. S. B. Kotsiantis,I. Zaharakis,P. Pintelas, "Supervised machine learning:
A review of classification techniques," Emerging artificial intelligence applications in computer engineering, vol. 160, pp. 3-24, 2007.
15. F. Pedregosa,G. Varoquaux,A. Gramfort,V. Michel,B. Thirion,O.
Grisel,M. Blondel,P. Prettenhofer,R. Weiss, V. Dubourg,J.
Vanderplas,"Scikit-learn: Machine learning in Python," Journal of machine learning research, vol. 12, no. Oct, pp. 2825-2830, 20011.
16. C. C. Aggarwal,C. Zhai, Mining Text Data, Springer Science &
Business Media, 2012.
17. L. P. Blum AL, "Selection of relevant features and examples in machine
learning," vol. 97, no. 1, pp. 245-271, 2000.
18. P. Harrington, Machine learning in action, Manning Publications Co.,
2012.
19. N. Ruchansky,S. Seo,Y. Liu, "Csi: A hybrid deep model for fake news
detection," in Information and Knowledge Management. ACM, 2017.
20. K. Shu,A. Sliva,S. Wang,J. Tang,H. Liu, "Fake news detection on social
media: A data mining perspective," ACM SIGKDD Explorations
Newslette, vol. 19, no. 1, pp. 22-36, 2017.
21. J. Davis,M. Goadrich,"The relationship between Precision-Recall and ROC curves," in the Proceedings of the 23rd international conference on Machine learning : ACM, 2006.
22. Satwinder Singh, R.Singla, Comparative performance of fault-prone prediction classes with k-means clustering and MLP, In proceeding of 2nd International Conference on Information and Communication Technology for Competitive Strategies, ICTCS 2016, Udaipur, India, 4-5, March 2016.
23. Satwinder Singh, S. Kaur, “A systematic literature review: Refactoring for disclosing code smells in object oriented software”, Ain Shams Engineering Journal, Vol.9, No. 4, pp 2129-2151,2018.
24. Satwinder Singh, R.Singla, “Classification of defective modules using object-oriented metrics, International Journal of Intelligent Systems Technologies and Application” Vol.16, No. 1, pp 1-13,2017.
AUTHORSPROFILE
Anant Kumar pursed Bachelor of Engineering from Birla Institute of Technology, Mesra, India in the year 2016. He is currently pursuing Masters of Technology (cyber security) from Central University of Punjab, Bathinda, Punjab, India. He is currently working on Data Science, Cyber Security and has worked on a few projects including some research papers based on machine learning.
Dr. Satwinder Singh had completed his Ph.D in 2014 from Guru Nanak Dev University, Amritsar. He is currently working as an Assistant Professor at Department of Computer Science and Technology, Central University of Punjab, Bathinda, Punjab, India, He has 15 years teaching experience. He has published research papers in reputed journals and conferences. His research interests include Re-engineering of Software System , Maintenance