Technological and economic estimation of
efficiency of a route choice for transportation of
dangerous goods
Oleksandr Lavrukhin1,*, Anton Kovalov1 , and Daria Kulova1
1 Ukrainian State University of Railway Transport, Department of Management of Freight and
Commercial Work, Feuerbach sq., 7, Kharkiv, 61001, Ukraine
Abstract. One of the main conditions for the transportation of goods, especially dangerous, is minimizing all types of eventual cost in the event of an emergency. The cost value depends on multiples factors, which are significantly influenced by the location of the train in different places (such as running line, technical stations, residential places, etc.). The proposed approaches on the basis of the queuing theory will allow choosing traveling routes of cars with dangerous goods providing the minimum average cost reduced to one emergency situation.
1 Introduction
The transport industry needs accelerated development in the current competitive conditions during the transition to market relations. Improving the service quality is one of the key conditions that affect the level of demand for transport services. Railway transport has a leading position in the transport system and is the main carrier of goods. Transportation of dangerous goods (DG) takes an important place in railway transportation; thus, it should be not only prompt, but also safe, while complying with high international standards, since emergency situations with trains which include cars with DG always have more severe consequences, which in turn leads to heavier material damage.
2. Literature review
Leading scientists of the world have been engaged in raising the safety level and reducing costs caused by the onset of transport emergencies during transportation of DG. In [1], emergencies during transportation of dangerous goods were assessed. The analysis of the causes of emergencies demonstrated that they mostly include commercial failures, critical wear-out of fixed assets and violation of safety requirements, which leads to significant material damage; however, the specific place of an emergency is not taken into account.
In [2], a comprehensive approach was proposed to determine the safety level during the transportation by railway transport. Various impact factors are taken into account, such as: state of technical facilities, current operation technology, specific features of work with
personnel, and cost of ensuring an adequate level of traffic safety. Total of twelve factors with different distinctnesses are identified. An additive indicator was proposed as an evaluation criterion that determines the level of railway traffic safety, however, increased danger during transportation of DG is insufficiently accounted for in this indicator.
In [3], calculations of the main losses from the onset of emergencies during the transportation of DG are given. These include: direct loss of a transport company; accident localization and investigation costs, socio-economic losses; environmental damage; damaged caused by loss of labor resources due to the death or disability of people. However, the influence of the probability of cars with DG to be in different states on the cost value in the event of emergency is not taken into account.
In [4], a mathematical method for assessing the complex safety level in the railway transport is proposed. The traffic safety index was calculated, which is used as the basis of the simulation model “Railway Traffic Safety”, which will allow railway staff to provide a high level of safety during the transportation and will reduce the cost of eliminating the consequences of transport accidents, but the transportation of DG needs special consideration in determining the safety level during the transportation of mass cargoes.
3. Main part of the study
In study [5], the amount of risk depends on the value of determined complex criterion U and the consequences of the onset of an adverse event
1
(w )
a
l
a
R
U
E
, (1)where U – conditional confidence of occurrence of more significant consequences as a result of an emergency (complex criterion);
E(wa) – average cost reduced to one emergency situation;
l – number of components of average cost. Average cost consists of:
– E(w1) – average reduced cost that relates to the damage of fixed assets (buildings, structures), cars,
tracks, locomotives and third party’s property;
– E(w2) – average reduced cost incurred as a result of environmental harm;
– E(w3) – average reduced cost for monetary compensation for causing adverse consequences to a
person (death, injury, disability).
E
(w )
1
A
1
A
2
A
3, (2)where A1 – cost caused by the damage or total or partial destruction of the main productive and
non-productive assets;
A2 – cost caused by the damage or total or partial destruction of tracks, locomotives, cars, signals and
interlocking devices, etc;
A3 – cost caused by the damage or total or partial destruction of the third party’s property.
In turn, A1 can occur when a train is in all types of interstations, as well as during crossings and overtakes. A2can also occur when a train is in a running line and moves within residential places. A3 can arise when a train moves within residential places.
E(w2) can occur when a train is in all types of interstations, as well as during crossings and overtakes, is in a running line and moves within residential places.
where B1 – cost caused by air pollution;
B2 – cost caused by water pollution;
B3 – cost caused by contamination of the upper track structure;
B4– cost caused by the destruction of biological resources;
B5 – other cost caused by adverse consequences of an emergency.
E(w3) will get maximum values when a train runs within residential places and when it is at technical stations, i.e.
E
(w )
3
C
1
C
2, (4)where C1 – socio-economic cost for monetary compensation in case of death, disability or injury with
permanent disability, injury without permanent disability;
C2– cost caused by the loss of labor resources [3].
It is known that the process of delivery of goods from the sender to the consignee can be considered as a queuing system (QS) [6-10]. Functioning of any QS can be represented through its possible states and intensities of transitions from one state to another. Determining the probability of the train with DG to be in different states during the transportation is expedient for a more accurate and precise definition of all components of different costs:
S1 –the train with cars loaded with DG is between the interstations points of all types (outside the residential places);
S2 – the train with cars loaded with DG moves within residential places without stopping; S3 - the train with cars loaded with DG is under technical operations at the technical stations (change of a locomotive, locomotive crew, type of current, direction of movement, etc.); S4– the train with cars loaded with DG is under crossing;
S5 –the train with cars loaded with DG is under overtaking.
Then, the graph of states of the composition of the train loaded with DG will have the form (Fig. 1)
Fig. 1. Graph of states of the train.
[image:3.482.59.426.390.516.2]1
12 13 14 15 1 21 2 31 3 41 4 51 5
2
21 2 12
3
31 3 13
4
41 4 14 1
5
51 5 15
( )
dp
P P P P P
dt dp P P dt dp P P dt dp P P dt dp P P dt (5) Normalizing condition:
P
1
P
2
P
3
P
4
P
5
1
(6) After calculating the probabilities of states of the train with cars loaded with DG, the value of average cost reduced to one emergency situation E(wa) will be calculated as follows:1 2 3 1 2 3 4 5 1 2 2 2 3
2 2 3 3
( ) ( ) ( ) ( ) ( ) ( ) ( )
( ) ( ) ( )
a
E w E w E w E w P A P P P A A P A A
E w P P E w
(7)
Thus, the results obtained in (7) can help more accurately predict the possible costs value in the event of an emergency situation with DG when choosing a route of the train.
The calculation of a conditional DG transportation site (Fig. 2) is shown as an example, when train passes, consequently:
1. two large residential places, one technical station (replacement locomotive) and one crossing;
[image:4.482.56.430.415.531.2]2. three residential places and two technical stations with corresponding intensities of transfer of the train from one state to another.
Fig. 2. Conditional DG transportation site.
Conventions:
DS – departure station; RP – residential place; TS – technical station; Cr – crossing; DS – destination station.
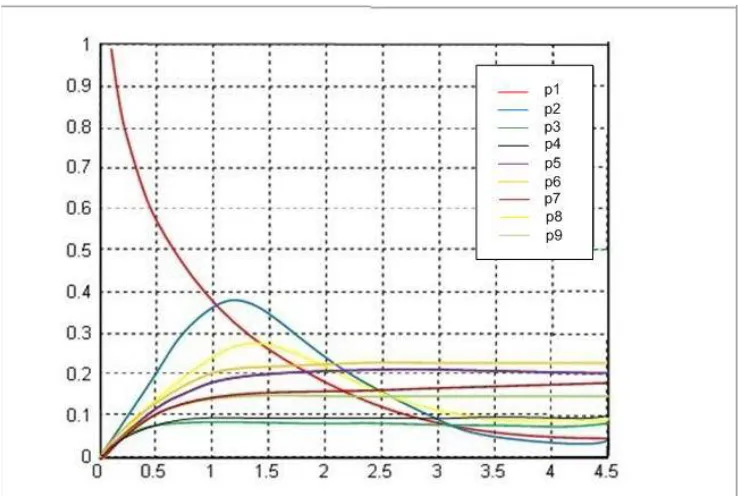
Fig. 3. Results of calculations of the probabilities of the train to be in different states.
Probability of the train with cars loaded with DG being between the intersections of all types (outside of settlements) consists of P1, P3, P5, P7 and P9 (0.556); probability of the train with the cars loaded with DG moving within residential places without stopping consists of P2 and P6 (0.262); probability of the train with cars loaded with DG being under technical operations at technical stations (change of locomotive) corresponds to P4 (0.093); probability for the train with cars loaded with DG to be under crossing is P8 (0.089); and probability of the train with cars loaded with DG to be under overtaking is 0.
Thus, calculation (7) will have the form
1 2 3 2 1 2 2 3
2 3
( ) ( ) ( ) ( ) 0,556 0,182 ( ) 0, 262( ) ( ) 0, 355 ( )
a
E w E w E w E w A A A A A
E w E w
The second (parallel) route of DG delivery from the point of departure to the point of destination is calculated similarly.
Results of calculations of the second route
1 2 3 2 1 2 2 3
2 3
( ) ( ) ( ) ( ) 0, 483 0, 231 ( ) 0, 286( ) ( ) 0, 392 ( )
a
E w E w E w E w A A A A A
E w E w
Thus, the first transportation route of DG is more expedient from the economic point of view.
3. Conclusions
allow correct predicting of consequences of emergencies during the transportation of DG in different routes. The given approaches give an opportunity to choose a transportation route for DG with the lowest possible cost. The promising directions of transportation of DG are shipment of such cars to ports and from ports by rail. Accordingly, using large ports (such as Odessa, Mariupol, etc.) as experimental sites is advisable for further study.
One of the conditions for using this approach is fully automated accounting system and the use of the decision support system (DSS) by the operational personnel.
This system will allow the station personnel to choose a route of the train during the operation depending on the following parameters: number of cars with DG of different classes, time of day, seasonal factor, irregularity in different days of the week, etc.
References
1. Y. Buts, E.. Kraynyuk, D. Kozodoy, V. Barbashin, Visnik Dnipropetrovskogo nacionalnogo universitetu zaliznichnogo transportu, 3 (75), 27-35 (2018)
2. O. Ohar, O. Rozsokha, M. Kutsenko, Yu. Smachilo, Eastern-European Journal of Enterprise Technologies, 6/3 (90), 48-57 (2017)
3. A.M. Kotenko, D.S. Kozodoy, A.V. Svetlichnaya, P.S. Shilaev, Zbirnik naukovih prac UkrDAZT, 141, 272-280 (2013)
4. P. Sukhov, V. Popov, V Filippov, MATEC Web of Conferences, TransSiberia, 239, 1-7 (2018)
5. O. Lavrukhin, A. Kovalov, V. Schevcenko, A. Kyman, D. Kulova, Eastern-European Journal of Enterprise Technologies, 2, 3(98), 25-31 (2019)
6. O. Rodkevych, Organizaciya perevezen i bezpeka transportu, 171-182 (2014)
7. N. Berezhnaya
,
Technical service of agriculture, forestry and transport systems, 7, 64-76 (2017)8. T. Bondaryeva, N. Grebenyuk, Ekonomika ta upravlinnya pidpriyemstvami mashinobudivnoyi galuzi, 3, 91-102 (2014)
9. D. Dmytriv, O. Rogatynska, Y. Kapatsila, Matematichni metodi, modeli ta informacijni tehnologiyi v ekonomici, 123-130 (2016)