Int. J. Electrochem. Sci., 14 (2019) 2175 – 2186, doi: 10.20964/2019.03.12
International Journal of
ELECTROCHEMICAL
SCIENCE
www.electrochemsci.orgStudy on the Uncoupling Characteristics of PEM Fuel Cell by
Segmented Cell Technology
Bowen Feng, Rui Lin*, Dengcheng Liu, Di Zhong
School of Automotive Studies, Tongji University, Shanghai 201804, Shanghai, China
*E-mail: [email protected] (Rui Lin).
Received: 3 November 2018 / Accepted: 1 January 2019 / Published: 7 February 2019
The segmented cell technology can provide real-time spatial current density distribution of PEM fuel cell. This technology was originally applied only to the anode of the cell. Normally, the anode and cathode reactions of the cell were coupled and the overall performance was the same. However, for PEM fuel cell, the local performance of cathode and anode would be uncoupled due to the influence of reaction gas distribution and water distribution. In this paper, for the first time, the technology was used on anode and cathode simultaneously. It used multi-layered printed circuit board(PCB) flow field plates to substitute both anode plate and cathode plate. The mapping of current density distribution of the anode and the cathode could be tested at the same time. The local difference of cathode and anode performance was investigated at different relative humidity. It showed that anode had better performance at hydrogen inlet while cathode had better performance at the inlet part of air. The cell was operated at 5A, 25A and 45A constant current conditions(respectively represented low, medium and high load states). With the increase of operating current density, the percentage difference was also increased.
Keywords: PEM fuel cell; uncoupling characteristics; relative humidity
1. INTRODUCTION
Proton exchange membrane fuel cell (PEMFC) has wide development prospects due to its environmentally friendly and high energy efficiency characteristics[1]. However, complex electrochemical reactions take place inside the cell and are not easily observed. This has led to a number of characterization tools being introduced to study the mechanism of the reaction inside the cell.
performance and durability with a more uniform pressure and gas distribution in the flow field. F. Nandjou et al. investigated the local performance degradation in fuel cell[3]. They suggested that the loss of local performance is mainly related to the water concentration in the cell. Ibrahim et al. used the segmented bipolar plate and printed circuit board technique to measure the local current distributions with different flow arrangements and operating conditions[4, 5]. Q. Meyer et al. used a combined current density and temperature distributed measurement system to generate an electro-thermal performance map[6, 7] and Gerteisen et al. used a segmented cell with 49 segments to measure the local current density distribution and high frequency resistance[8]. Iranzo et al. investigated the effects of anode and cathode relative humidity on the resulting water distributions in the cell[9]. The results showed that the relative humidity of cathode had greater influence on the water content and performance of the cell than that of anode. NurOzen et al. used a cell with active area of 25cm2 to study the effect of humidity on the cell performance[10]. They found that increasing the humidity of the cell can reduce the impedance of the membrane, thereby improving the performance of the cell. Ruilin et al. optimized the relative humidity to improve the fuel cell performance and stability[11]. They found that the performance of the fuel cell increased with increasing anode or cathode humidity while the stability of the cell decreased with increasing anode humidity. Sanchez et al. studied the local impact of humidification on degradation of PEMFC[12]. The cathode inlet region exhibited increased degradation with non-humidified gases, whereas with fully humidified gases the bottom of the cell had higher performance losses.
For PEM fuel cell, the overall performance of the cathode and anode was the same. The hydrogen in the anode lost electrons and became protons. Protons went through MEA and reacted with oxygen at the cathode. The place of cathode reaction and anode reaction was different and it would lead to uncoupling characteristics of anode and cathode local performance. In this paper, for the first time, the segmented cell technology was used on anode and cathode simultaneously to study the uncoupling characteristics of PEM fuel cell. The current density distribution maps of anode and cathode were tested at the same time and the local difference of cathode and anode performance was investigated with different relative humidity.
2. EXPERIMENTAL
2.1 Cell preparation
The cell used in this experiment has an active area of 50 cm2. It used printed circuit board to substitute both anode plate and cathode plate. The printed circuit board with triple serpentine flow fields has 49 segments. The hydrogen flows into the segment A01 and flows out of G07 while the air flows into the segment A07 and flows out of G01(Fig.1). The membrane electrode assembly (MEA) used in this experiment was bought from Wuhan Xinyuan Corporation which was similar with the published paper[13-15]. Anodic and catholic catalyst with 0.4 mg/cm2 Pt were coated on the membrane and the
Figure 1. flow field configuration and gas flow mode
2.2 Experimental conditions and procedures
The cell was tested on G20 platform produced by Greenlight Innovation. The cell was operated at 80℃. λHydrogen and λAir were kept constant at 1.5 and 2.8, respectively. In order to study the effect of
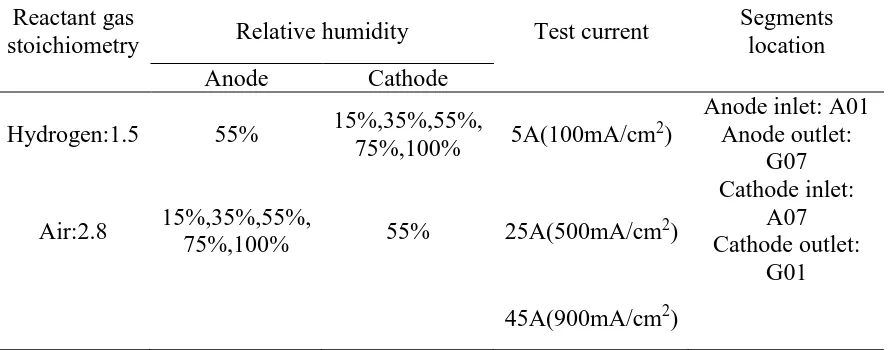
[image:3.596.124.475.73.221.2]relative humidity on the difference of cathode and anode performance, changing the cathode relative humidity(15%,35%,55%,75% and 100%) while the anode humidity remained 55% unchanged. Then the cathode humidity kept 55% constant and changing the anode humidity. After activated, the cell was adjusted to the specified humidity and steadily running 2 hours to test polarization curves. Then the cell current was adjusted galvanostatically at 5A, 25A and 45A respectively. At each current condition, the real-time spatial current density distribution was tested simultaneously on the anode plate and cathode plate. The operating conditions and gas flow mode are summarized in Table 1.
Table 1. Operating conditions and gas flow mode
Reactant gas
stoichiometry Relative humidity Test current
Segments location
Anode Cathode
Hydrogen:1.5 55% 15%,35%,55%,
75%,100% 5A(100mA/cm
2)
Anode inlet: A01 Anode outlet:
G07 Air:2.8 15%,35%,55%,
75%,100% 55% 25A(500mA/cm
2)
Cathode inlet: A07 Cathode outlet:
[image:3.596.78.523.511.686.2]
3. RESULTS AND DISCUSSION
3.1 The polarization curve
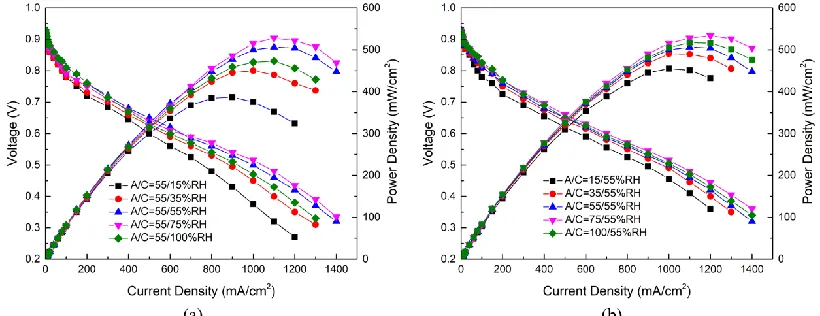
Fig.2(a) shows the polarization curves of different cathode humidity(15%,35%,55%,75% and 100%) when anode humidity kept 55% constant. The A/C=55/15%RH in the Fig corresponds to 55% of the anode humidity and 15% of the cathode humidity. Other humidity conditions are expressed in a similar way. It can be seen that at low current density, the cell performed best at 75% and 100% cathode humidity and there is little difference in cell performance under the above five humidity conditions. It is possible that under low current conditions, less water is generated inside the cell. The cell is in a relatively dry environment, which is alleviated by increasing the relative humidity of the cathode. Increasing the relative humidity will enhance proton conductivity of the membrane and improve the cell performance[16, 17].With the increase of current density, the performance differences of these humidity conditions become more obvious. Under medium and high current density, the cell performed best when cathode humidity is 55% and 75% while the performance decreased obviously at 100% cathode humidity. This is probably due to the high cathode humidity causing cell flooding. The cell performed worst when cathode humidity is 15% and this is probably too dry inside the cell. Fig.2(b) shows the polarization curves of different anode humidity when cathode humidity kept 55% constant. The cell had the best performance when the anode humidity is 75% and 100%. Similar to Fig.2(a), the cell performed worst when anode humidity is 15%. However, the performance difference under these humidity conditions is obviously smaller than that in Fig.2(a). It can be concluded that the cathode humidity has greater impact on cell performance. The results are the same as those of Iranzo et al.[9] and Cai et al.[18].
Figure 2. Polarization curves (a) different cathode humidity,(b) different anode humidity
3.2 Spatial current density distribution 3.2.1 The effect of cathode relative humidity
[image:4.596.92.502.450.608.2]
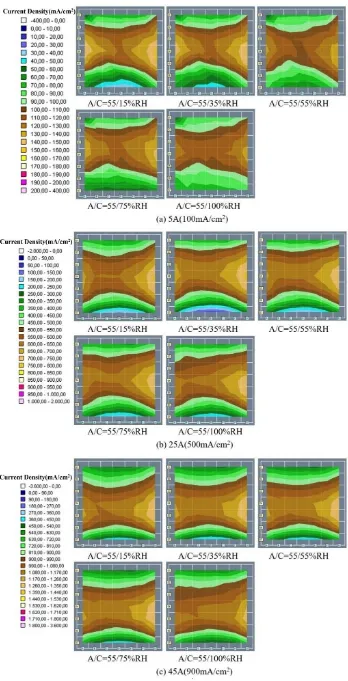
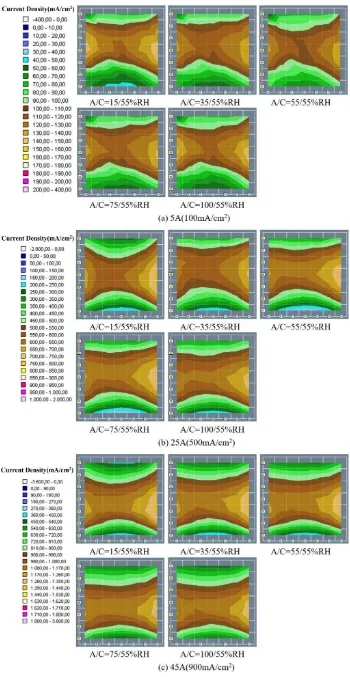
Fig.3 shows the cathode current density distribution maps of different cathode relative humidity when anode humidity was kept at 55% constant. The current density distribution map of the anode is similar to that of the cathode, so it was not shown in this paper. Fig.3(a) is operated at 5A constant current, the current density is most uniform at 75% and 100% cathode humidity. When the cathode humidity is 15% and 35%, the air inlet area has poor performance and the overall uniformity is also bad. Jeon et al.[19] also reported that higher cathode humidity improved the cell performance and the uniformity of current density distribution. It is possible that under low current conditions, the cell is in a relatively dry environment, which is alleviated by increasing the relative humidity of the cathode. Fig.3(b) and Fig.3(c) show the current density distribution of the cell operating at 25A and 45A respectively. The uniformity is best when the cathode humidity is 55% and 75% while the air outlet area has poor performance at 15% and 100% cathode humidity. It can be concluded that the cell is too dry at 15% humidity. And at 100% cathode humidity, excess water inside the cell is accumulated in cathode, resulting in flooding at the cathode outlet. A similar result was obtained by Bayrakçeken et al. [20], they thought it was because the excess water inside the cell blocked oxygen transmission, resulting in a decline in cell performance. To analyze the performance difference between cathode and anode, the segment current density percentage difference 𝑃𝐷% is defined:
𝑃𝐷% = (𝐴 − 𝐶)/[(𝐴 + 𝐶)/2] × 100% (1)
[image:7.596.173.418.226.422.2]
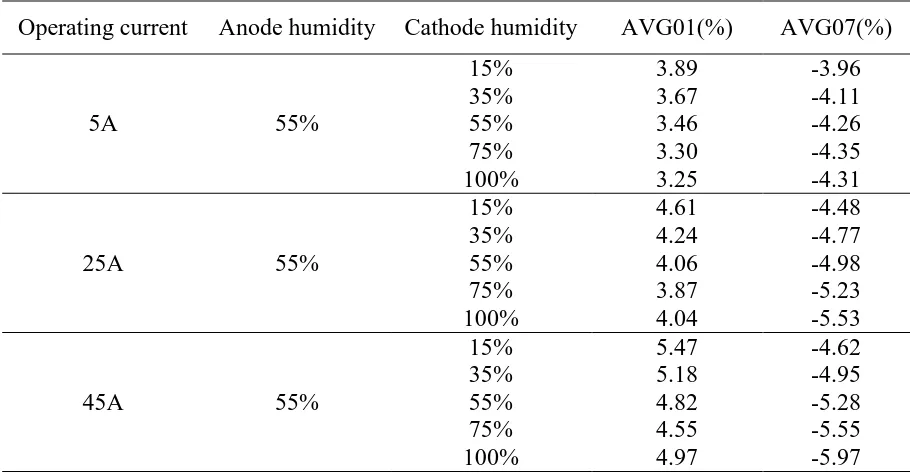
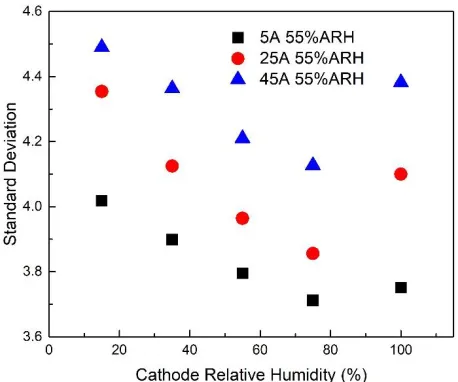
decreases, while the absolute value of AVG07 always increases. And at the same humidity, with the increase of operating current, increase of operating current, the percentage difference is also increased. It can be easy to understand that this phenomenon is amplified with the increase of operating current. Fig.5 shows the standard deviation of different cathode relative humidity. 55%ARH in the Fig indicates that the humidity of the anode is 55%. It can be seen that the standard deviation becomes larger as the operating current increases. With the increase of cathode humidity, the standard deviation first decreases and then increases. It can be concluded that too dry or too wet environment is not conducive to the uniformity of cell performance.
[image:7.596.70.525.500.737.2]Figure 4. 𝑃𝐷(%) at 25A (A/C=55%/55%RH) Table 2. Average percentage difference(𝑃𝐷(%)) of row 01 and row 07
Operating current Anode humidity Cathode humidity AVG01(%) AVG07(%)
5A 55%
15% 3.89 -3.96
35% 3.67 -4.11
55% 3.46 -4.26
75% 3.30 -4.35
100% 3.25 -4.31
25A 55%
15% 4.61 -4.48
35% 4.24 -4.77
55% 4.06 -4.98
75% 3.87 -5.23
100% 4.04 -5.53
45A 55%
15% 5.47 -4.62
35% 5.18 -4.95
55% 4.82 -5.28
75% 4.55 -5.55
Figure 5. Standard deviation of different cathode relative humidity
3.2.2 The effect of anode relative humidity
[image:8.596.179.408.74.265.2]
[image:10.596.87.507.233.684.2]
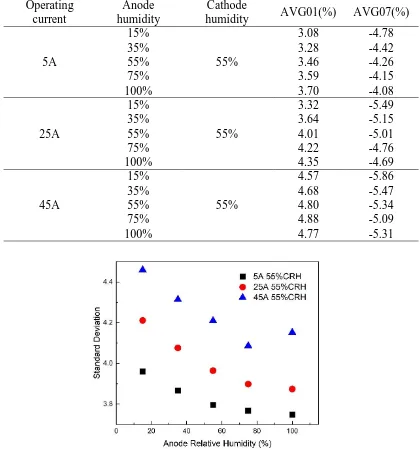
when the cell is operated at 45A, the absolute value of AVG07 first decreases and then increases. This may be because the cell is too wet in this area at 100% anode humidity. Fig.7 shows the standard deviation of different anode relative humidity. 55%CRH in the Fig indicates that the humidity of the cathode is 55%. When the cell is operated at 5A and 25A, the standard deviation decreases with the increase of anode humidity. But at 45A, the standard deviation first decreases and then increases. It is possible that the cell is too wet at 100% anode humidity. And at 5A and 25A, less water is generated inside the cell, so this phenomenon does not happen.
Table 3. Average percentage difference(𝑃𝐷(%)) of row 01 and row 07 Operating
current
Anode humidity
Cathode
humidity AVG01(%) AVG07(%)
5A
15%
55%
3.08 -4.78
35% 3.28 -4.42
55% 3.46 -4.26
75% 3.59 -4.15
100% 3.70 -4.08
25A
15%
55%
3.32 -5.49
35% 3.64 -5.15
55% 4.01 -5.01
75% 4.22 -4.76
100% 4.35 -4.69
45A
15%
55%
4.57 -5.86
35% 4.68 -5.47
55% 4.80 -5.34
75% 4.88 -5.09
100% 4.77 -5.31
4. CONCLUSIONS
In this study, the segmented cell technology was used on anode and cathode simultaneously to study the uncoupling characteristics of PEM fuel cell. The polarization curves of different relative humidity were tested. At each relative humidity, the current density distribution maps of anode and cathode were tested simultaneously at 5A, 25A and 45A constant current. The local difference of cathode and anode performance was also investigated with different relative humidity.
1. The polarization curve result shows that the cathode relative humidity has greater impact on cell performance than anode humidity. The cell has poor performance at low cathode humidity and anode humidity. At high cathode humidity, the cell is prone to flooding under high load and results in poor performance. And at high anode humidity, the cell tends to have better performance in a wetter environment.
2. The performance difference of the anode and cathode is mainly reflected in hydrogen inlet and air inlet. The anode has better performance at hydrogen inlet while cathode has better performance at air inlet. It is possible that hydrogen is sufficient at the hydrogen inlet, resulting in better anode performance. In the same way, the cathode performs better at the air inlet.
3. With the increase of operating current, the performance difference is amplified, resulting in the increase of percentage difference. With the increase of cathode humidity, the standard deviation first decreases and then increases. It can be concluded that too dry or too wet environment is not conducive to the uniformity of cell performance. However, with the increase of anode humidity, the standard deviation decreases at 5A and 25A constant current. It indicates that the cell is suitable for running at relatively high anode humidity and the cathode humidity needs to be limited to prevent the cell from flooding.
ACKNOWLEDGEMENT
The authors gratefully acknowledge the financial support from National Key Research and Development Program of China (No. 2016YFB0101319) and National Natural Science Foundation of China (No. 21776222).
References
1. X.Z. Yuan, H. Li, S. Zhang, J. Martin, H. Wang, Journal of Power Sources, 196 (2011) 9107-9116. 2. S.G. Kim, M.J. Kim, Y.J. Sohn, International Journal of Hydrogen Energy, 40 (2015)
11676-11685.
3. F. Nandjou, J.P. Poirot-Crouvezier, M. Chandesris, J.F. Blachot, C. Bonnaud, Y. Bultel, Journal of Power Sources, 326 (2016) 182-192.
4. I. Alaefour, G. Karimi, K. Jiao, X. Li, Applied Energy, 93 (2012) 80-89.
5. I. Alaefour, G. Karimi, K. Jiao, S.A. Shakhshir, X. Li, Electrochimica Acta, 56 (2011) 2591-2598. 6. Q. Meyer, K. Ronaszegi, J.B. Robinson, M. Noorkami, O. Curnick, S. Ashton, A. Danelyan, T.
Reisch, P. Adcock, R. Kraume, Journal of Power Sources, 297 (2015) 315-322.
7. Q. Meyer, K. Ronaszegi, P.J. Gan, O. Curnick, S. Ashton, T. Reisch, P. Adcock, P.R. Shearing, D.J.L. Brett, Journal of Power Sources, 291 (2015) 261-269.
Hydrogen Energy, 37 (2012) 7736-7744.
9. A. Iranzo, P. Boillat, J. Biesdorf, A. Salva, Energy, 82 (2015) 914-921.
10.D.N. Ozen, B. Timurkutluk, K. Altinisik, Renewable & Sustainable Energy Reviews, 59 (2016) 1298-1306.
11.R. Lin, C. Cao, J. Ma, E. Gülzow, K.A. Friedrich, International Journal of Hydrogen Energy, 37 (2012) 3373-3381.
12.D.G. Sanchez, T. Ruiu, I. Biswas, M. Schulze, S. Helmly, K.A. Friedrich, Journal of Power Sources, 352 (2017) 42-55.
13.Q. Zhang, R. Lin, L. Técher, X. Cui, Energy, 115 (2016) 550-560.
14.J. Shan, R. Lin, S. Xia, D. Liu, Q. Zhang, International Journal of Hydrogen Energy, 41 (2016) 4239-4250.
15.Q. Zhang, R. Lin, X. Cui, S.X. Xia, Z. Yang, Y.T. Chang, Journal of Power Sources, 341 (2017) 230-239.
16.P. Sridhar, R. Perumal, N. Rajalakshmi, M. Raja, K.S. Dhathathreyan, Journal of Power Sources, 101 (2001) 72-78.
17.V. Lilavivat, S. Shimpalee, J.W.V. Zee, H. Xu, C.K. Mittelsteadt, Electrochimica Acta, 174 (2015) 1253-1260.
18.Y. Cai, J. Hu, H. Ma, B. Yi, H. Zhang, Electrochimica Acta, 51 (2006) 6361-6366.
19.H.J. Dong, K.N. Kim, S.M. Baek, H.N. Jin, International Journal of Hydrogen Energy, 36 (2011) 12499-12511.
20.A. Bayrakçeken, S. Erkan, L. Türker, İ. Eroğlu, International Journal of Hydrogen Energy, 33 (2008) 165-170.
21.M.V. Williams, H.R. Kunz, J.M. Fenton, Journal of Power Sources, 135 (2004) 122-134. 22.H.Y. Kim, K. Kim, International Journal of Hydrogen Energy, 41 (2016) 11776-11783. 23.K.M. Yin, C.P. Chang, Fuel Cells, 11 (2011) 888-896.