Int. J. Electrochem. Sci., 12 (2017) 178 – 191, doi: 10.20964/2017.01.51
International Journal of
ELECTROCHEMICAL
SCIENCE
www.electrochemsci.org
Determination of Ethyl Vanillin by a Using Briggs-Rauscher
Oscillator
Waqar Uddin1, Gang Hu1,*, Lin Hu2, Xiaofeng Shen1, Zhaohui Fang3, Yu Zhang1, and Jimei Song1
1 Department of Chemistry, Anhui University, Hefei, 230601, People’s Republic of China 2 Institute of Applied Chemistry, East China Jiaotong University, Nanchang, 330013, People’s Republic of China
3 The First Affiliated Hospital of Anhui University of Chinese Medicine, Hefei, 230031, People’s Republic of China
*E-mail: hugang@ustc.edu
Received: 22 July 2016 / Accepted: 19 October 2016 / Published: 12 December 2016
A study on the determination of an antioxidant ethyl vanillin (EV) built on its perturbation effects on a Briggs-Rauscher (BR) oscillator was reported in this paper. A tetraazamacrocyclic Ni(II) complex, [NiL](ClO4)2, was used as a catalyst in such a oscillator, and the ligand L in the complex is 5,7,7,12,14,14-hexamethyl-1,4,8,11-tetraazacyclotetradeca-4,11-diene. The pH value for the BR reaction was kept at 2, which is analogous to the pH of the fluids of the human stomach. It has been concluded from the experimental data that the addition of EV into BR system could cause the temporary cease in the oscillation after inhibition time (tin) depending on the concentration of EV added. It was found that, as the concentration of EV were increased, the tin were increased. Thus, a polynomial regression curve was achieved over a range 7.5 × 10⁻⁶ to 3.5 × 10⁻⁵ M of EV with a correlation coefficient of 0.98. The obtained RSD from six measurements of 2.5 × 10⁻⁵ M of EV is 0.159%. On the basis of the FCA model, reaction mechanism involving HOO• radical has been proposed.
Keywords: Antioxidant; Briggs-Rauscher; Chemical oscillation; Ethyl vanillin; Inhibitory effect
1. INTRODUCTION
acid and polyphenols are some good examples of them. Deficiency in standard of antioxidants could lead to oxidative stress and may damage or slay cells [1]. Oxidative stress play a substantial role in various human illnesses, such as cancers [2]. Consumption of food antioxidants, dietary supplements reduce the oxidation stress by increasing the level of antioxidant capacity within human body [3]. On the basis of occurrence, antioxidants can be classified into two kinds: natural and synthetic. The natural antioxidants are mainly founds in fruits, vegetables and beverages in a form of vitamin C & E, polyphenols and carotenoids [4]. Both natural and synthetic antioxidants have the ability to lower the level of auto-oxidation of lipids [5]. The side effects of natural antioxidants is less in the human body as compare to synthetic antioxidants [6] and natural antioxidants has more application in the medicine and food industry [7, 8].
The influences of antioxidants on the Briggs-Rauscher (BR) oscillator using metal ion and macrocyclic catalysts have been recently reported [9-14]. The BR oscillator [15] was discovered by two science instructors in San Francisco by replacing bromate (BrO3−) in the BZ oscillator with iodate and adding hydrogen peroxide. When antioxidants were put into the active BR system, the oscillation could be quenched and regenerated after inhibition time (tin). Damping in the oscillation is due to the free radical intermediates present in the course of reaction. Such damping in oscillation cause by antioxidant on the BR system using macrocyclic Ni (II) catalyst are well explained on basis of FCA mechanism.
In this article we described a new technique for the determination of an antioxidant, Ethyl vanillin (EV) based on inhibitory effect on the BR oscillator in the presence of macrocyclic Ni (II) catalyst (NiL(ClO4)2), where ligand L is 5,7,7,12,14,14-hexamethyl-1,4,8,11-tetraazacyclotetradeca-4,11-diene. The addition of EV into the active BR caused immediate ceasing and regeneration of oscillation after tin dependent on the concentration of EV. Reaction temperature was set at 4 ± 0.5 OC and pH value was kept at 2 which is similar with the pH of human stomach fluid.
EV (Scheme 1) is a synthetic compound having chemical formula (C2H5O) (HO)C6H3CHO, flavor agent derived from vanillin. It is available as fine white or slightly yellow crystal and is slightly soluble in water. EV has much stronger flavor than vanillin. It is widely used in various industries like food manufacturing, beverages, pharmaceutical products etc. Different methods were reported for the determination of EV, including spectrophotometry [16], liquid chromatography [17], liquid chromatography with mass spectrometric [18] and liquid chromatography with ultraviolet detection [19].We contribute a novel quantitative analytic technique for the determination of EV by using BR, which has some advantages over instrumental techniques i.e. simplicity in setup, ease for the procedure, larger linear range and lower limit of detection.
2. EXPERIMENTAL
2.1. Reagents
All the reagents, malonic acid (MA), H2SO4 (Aldrich, 98%), KIO3 and H2O2 (30%), and EV were used of analytical grade. Whereas tetraazamacrocyclic complex, [NiL](ClO4)2, was synthesized [20, 21] and identified by IR spectrum and elemental analysis. Its structure is shown in Scheme 2. Solution of 2.5 × 10⁻² M H2SO4 was made from 98% of H2SO4, and 2.00 M malonic acid, 0.014M KIO3, 1.73 × 10⁻² M [NiL](ClO4)2, 4.00 M H2O2 were prepared within such a H2SO4 solution. Solutions of different concentration of EV were also prepared in acidic solution of H2SO4.
Scheme 2. Structure of macrocyclic Ni complex, [NiL](ClO4)2.
2.2. Apparatus
The instrumental setup for the BR mainly consists of a glass reactor (50 ml) and a potential measurement system. The glass reactor was equipped with a thermostat model (DZCS-IIC, Nanjing Dazhankejiao Institute of Instrument, China). A 79-3 magnetic stirrer (Jiangsu, China) was used to homogenize the reaction solution by kept its stirring rate at 500 rmp, and a temperature controller to keep reaction temperature at 4 ± 0.5 OC. The potential measurement system consists of two electrodes. A platinum electrode (model 213 Shanghai, China) was applied as working electrode while a saturated calomel electrode (SCE) (Model 217 Shanghai, China) via a salt bridge containing 1 M Na2SO4 acted as reference electrode, both of which were immersed into the glass reactor. The changes in potential Vs time were recorded in PC through an Amplifier and a GO!Link sensor interface, both of which were purchased from Vernier Software Technology, USA, with a Logger Lite data-acquisition program.
2.3. Procedure
the glass reactor and potentials v.s. time were recorded in a PC through an Amplifier and a Go!link sensor interface with logger lite data acquisition program. After a short interval of time, the oscillation was started. The different concentrations of EV were used to perturb the BR oscillator at the base of potentiometric cycle. As a result, oscillations could be quenched and then restarted with an inhibition time (tin) being noticed. The tin is the interval of time in sec before oscillation regains.
3. RESULT AND DISCUSSION
The typical oscillation profile was shown in Figure 1a, which was obtained by direct mixing of the above described reagents. The solution color was noticed to change from yellow to brown then back to yellow due to the one electron transfer process between [NiL]2+ and [NiL]3+ for catalyst during oscillation.
[NiL]
2(yellow)
[NiL]
3(green)
During oscillation, I2 was formed and dissolved into the oscillating solution, and that is why the appearance of the solution color was observed brown rather than green [22]. However, in Mn2+ -catalyzed BR oscillator, continuous change in color from colorless to yellow to blue was noticed in starch indicator [23].
Figure 1. The oscillation profile for the proposed BR oscillator in the absence and presence of ethyl vanillin perturbation using Pt vs SCE electrodes. a): [EV] = 0 M; b): [EV] = 2.5 × 10⁻⁸ M; Common condition: [H2SO4] = 9.375 × 10⁻³ M; [KIO3] = 2.1 × 10⁻² M; [[NiL](ClO4)2 ] = 8.65 × 10⁻⁴ M; [MA] = 1.5 × 10⁻¹ M; [H2O2] = 1.4 M; t = 4 ± 0.5 OC
[image:4.596.90.512.400.549.2]
Active BR oscillator was perturbed by 40 µL of different concentration of EV at the bottom of potentiometric cycle. The oscillation, after temporary cease upon perturbation, could be regenerated with inhibition time (tin), as shown in Figure 1b. In order to make precise and accurate measurements, numerous injection points were tested. From experimental data it was notice that the tin is dependent on the concentration of EV added. As the concentration of EV increased, the tin was increased. Thus a new way for the determination of EV could be anticipated to be applied from above-mentioned behavior. This analytical technique, has more significance over instrumental method as its shows a good limits of detection and precision, which will be discussed in determination section.
3.1. Influence of experimental variables
To guarantee the extreme conceivable sensitivity and precision for determination of EV, the effects of MA, sulfuric acid, potassium iodate, hydrogen peroxide, [NiL](ClO4)2 were studied, by keeping the concentration of one reactant variable while the concentration of others reagents were kept constant. The tin was selected as measured parameter, because the addition of EV in the active BR caused the temporary cease in oscillation.
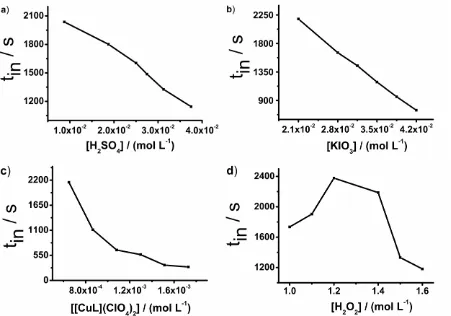
The influence of H2SO4 was tested over a range 8.75 × 10⁻³ M – 3.75 × 10⁻² M. It was notice that as the concentration of H2SO4 increased the tin were decreased, as shown in Figure 2a. A concentration 2.5 × 10⁻² M was selected at optimum, because oscillations run uniformly.
The influence of changing KIO3 concentration on the tin over a range of 2.1 × 10⁻² M – 4.2 × 10 -2 M was studied. It was found that, as concentration of KIO3 was increased, the tin of the system decreased, shown in Figure 2b. A concentration 2.1 × 10⁻² M, the top concentration point, was chosen because more stable oscillations over time could be obtained at such a concentration of KIO3.
The influence of changing concentration of [NiL](ClO4)2 was similar to the effect of H2SO4 and KIO3 over system. In the [NiL](ClO4)2 concentration range of 6.49 × 10⁻⁴ M to 1.73 × 10⁻³ M, it was notice that as the concentration of catalyst was increased, the tin was decreased, shown in Figure 2c. The 8.65 × 10⁻⁴ M of [NiL](ClO4)2 was selected as optimum concentration for catalyst as system oscillated stably.
The effect of H2O2 was studied over range of 1 M to 1.6 M. The tin was increased when concentration of the H2O2 was increased from 1 M up to 1.2 M but tin was decreased when concentration of H2O2 dropped from 1.2 to 1.6 M, as shown in Figure 2d. Thus 1.4 M of H2O2 was chosen as best concentration because at this concentration the oscillation was more stable.
The influence of MA shows similar effect like that of H2O2. The effect was tested over a concentration range of 0.1 M to 0.225 M. The tin was increased as concentration of MA was increased from 0.1 M up to 0.15 M, but tin was decreased below 0.15 M of MA, shown in Figure 2e. Thus 1.5 × 10⁻¹ M, the middle highest concentration point, was selected because at this concentration the oscillation was more stable.
amplitude of oscillation (A), oscillation period (T), life of oscillation were decreased while above 25 OC the oscillation had ceased. Thus 4 ± 0.5 OC was selected as optimum value for working condition.
The oscillating system is highly affected by foreign species. We examine the effects of a few foreign species on [NiL]2+-catalyzed chemical oscillator. The value of interference producing inaccuracy below 5% in the determination of 1 × 10⁻⁵ M EV was consider as tolerance range. The data are mention in Table 1. It was notice that, no influences of Na+ and other common ions were observed
[image:6.596.74.525.406.722.2]while few species like I- and Br- have immense effect on the determination of EV.
Table 1. Influence of foreign ions and species on the determination of 1 × 10⁻⁵ M EV*
Foreign ion and species Tolerated ratio
Br- , I- 0.2:1
Ag+, Fe2+, Cl- 2:1
F- 10:1
H2PO-, Co2+ 200:1
Ni2+, Li+ 1000:1
Na+, K+, Al3+, Zn2+ 2000:1
Figure 2. Influence of the concentrations of reactants on the inhibition time: (a) H2SO4; conditions: [KIO3] = 2.1 × 10⁻² M; [[NiL](ClO4)2 ] = 8.65 × 10⁻⁴ M; [MA] = 1.5 × 10⁻¹ M; [H2O2] = 1.4 M; t = 4 ± 0.5 OC. [EV] = 2.5 × 10⁻⁸ M. (b) KIO3; conditions: [H2SO4] = 9.375 × 10⁻³ M; [[NiL](ClO4)2 ] = 8.65 × 10⁻⁴ M; [MA] = 1.5 × 10⁻¹ M; [H2O2] = 1.4 M; t = 4 ± 0.5 OC. [EV] = 2.5 × 10⁻⁸ M. (c) [NiL](ClO4)2; conditions: [H2SO4] = 9.375 × 10⁻³ M; [KIO3] = 2.1 × 10⁻² M; [MA] = 1.5 × 10⁻¹ M; [H2O2] = 1.4 M; t = 4 ± 0.5 OC. [EV] = 2.5 × 10⁻⁸ M. (d) H2O2; conditions: [H2SO4] = 9.375 × 10⁻³ M; [KIO3] = 2.1 × 10⁻² M; [[NiL](ClO4)2 ] = 8.65 × 10⁻⁴ M; [MA] = 1.5 × 10⁻¹ M; t = 4 ± 0.5 OC. [EV] = 2.5 × 10⁻⁸ M. (e) MA, conditions: [H2SO4] = 9.375 × 10⁻³ M; [KIO3] = 2.1 × 10⁻² M; [[NiL](ClO4)2 ] = 8.65 × 10⁻⁴ M; [H2O2] = 1.4 M; t = 4 ± 0.5 OC. [EV] = 2.5 × 10⁻⁸ M.
3.2. Determination of Ethyl vanillin (EV)
Under the optimal condition as described above, we performed the perturbation experiment, by injecting different concentrations of EV which resulted in variation in tin. It was notice that as the concentration of EV was increased the tin was increased. Thus polynomial regression curve was achieved in a range between 7.5 × 10⁻⁶ to 3.5 × 10⁻⁵ mol/L of EV with a correlation coefficient of 0.98, as shown in Figure 3a. However, the calibration data achieved follow following equation:
tin = 470.55265 -6.36091 × 10⁷*EV+2.94766 × 10¹² *EV2 (r = 0.98).
The precision relative standard deviation (RSD), calculated from six perturbation of 2.5 × 10⁻⁵ M EV, was 0.159%. The limit of detection obtained was 5 × 10⁻⁶ M. Such precision is quite acceptable.
[image:7.596.186.412.72.229.2][image:8.596.86.514.133.284.2]
was achieved by injecting same amount of same concentration at different ordinal cycle i.e. (3 to 21), as shown in Figure 3b.
Figure 3. (a). The polynomial regression curve between tin and concentration of EV in the range of 7.5 × 10⁻⁶ to 3.5 × 10⁻⁵ M. b). tin Vs scheduled time commencing perturbation performance (n: ordinal number of cycle for the oscillations) in the presence of 1.5 × 10⁻⁵ M EV. Common condition: [H2SO4] = 9.375 × 10⁻³ M; [KIO3] = 2.1 × 10⁻² M; [[NiL](ClO4)2 ] = 8.65 × 10⁻⁴ M; [MA] = 1.5 × 10⁻¹ M; [H2O2] = 1.4 M; t = 4 ± 0.5 OC
Table 2. Determination results and recovery for EV* Sample Known concentration / 10-5
M
Added
concentration/10-5 M
Found concentration/10-5 M
Recovery %
1 0.9 0.3 1.19 99
2 1.25 0.3 1.47 94
3 1.50 0.2 1.55 91
4 1.60 0.2 1.66 92
5 1.65 0.2 1.78 96
6 1.75 0.2 1.79 91
7 2 0.2 2.18 99
8 2.5 0.2 2.66 99
* Common conditions: [H2SO4] = 9.375 × 10⁻³ M; [KIO3] = 2.1 × 10⁻² M; [[NiL](ClO4)2 ] = 8.65 × 10⁻⁴ M; [MA] = 1.5 × 10⁻¹ M; [H2O2] = 1.4 M; t = 4 ± 0.5 OC
[image:8.596.26.571.421.618.2]
of detection of EV which was obtained by our oscillating techniques were compared with the linear range and limit of detection of EV obtained through other instrumental techniques as shown in Table 3. It is clear that, from the above and below (Table 3) experimental data, this method is suitable for practical analysis.
Table 3. Comparison of EV determination by BR chemical oscillator with some instrumental techniques.
Techniques Linear Range Percentage recovery (%)
Limit of Detection BR Chemical
Oscillator (this work)
7.5 × 10⁻⁶ to 3.5 × 10⁻⁵ M
91 to 99%, 5 × 10⁻⁶ M
Liquid
Chromatography [27]
0.1 – 1.22 g / 100 ml
85-95 0.10 g / 100 ml
Mass
Spectrometry [16]
1-20 mg / L 88-99 0.38 mg / L
LC/MS [28] 10- 100 ug/Kg 91-99 1.5 ug / kg
HPLC [29] 0.5- 200 mg / L 97.5-103 0.04 mg / L
[image:9.596.88.506.197.424.2] [image:9.596.93.503.201.410.2]For comparison with present method, EV was determined by UV spectroscopy (standard method). For UV experiments, equal amount (200ul) of different concentration of EV in the range between 2 × 10⁻⁴ M to 3.17 × 10⁻⁴ M were put into the mixture of 25 ml of 2.5 × 10⁻² M H2SO4 and 5 ml of 1.4 × 10⁻¹ M KIO3.
Figure 4. (a). The UV spectrum of EV in the presence of H2SO4 and KIO3, conditions: [EV] = 2 × 10⁻⁴ to 3.17 × 10⁻⁴ M, [H2SO4] = 2 × 10⁻² M, [KIO3] = 2.3 × 10⁻² M, (b). The linear regression curve between absorbance and concentration of EV in the range of 2 × 10⁻⁴ to 3.17 × 10⁻⁴ M.
[image:9.596.75.518.490.645.2]
regression curve was achieved over a range 2 × 10⁻⁴ to 3.17 × 10⁻⁴ M of EV with a correlation coefficient of 0.98 (as shown in Figure 4b).
3.3. Mechanism
3.3.1. Cyclic voltammetry (CV)
In the presence and absence of EV, the experiments were performed to the below listed media to clarify which reagent react with EV:
1).H2SO4 + KIO3, 2) H2SO4+H2O2, 3) H2SO4 + M.A, 4) H2SO4 + [NiL](CLO4)2
It may be concluded from the result of cyclic voltammetry that, the EV can be oxidized by KIO3 as indicated in the Figure 5. It was observed that, from the Figure 5, as the amount of EV increases, the reduction current decreases while oxidation current increases. This phenomena indicate the redox reactions that exit between the KIO3 and EV.
Here it is noticed that in oscillating system the concentration of EV is less (trigger in micro-molar level or less) as compare to the concentration of KIO3. So EV would quickly be consumed if it reacts directly with KIO3. Due to this respect it is hard to clarify the tin by considering the direct reaction between KIO3 and EV. Here we demonstrated that the tin was cause by the reaction of antioxidant (EV) with intermediate species (HOO•) as indicated in below reactions (13 & 14).
Figure 5. Cyclic Voltammogram of the reaction between EV and the reactants obtained in the idant and prooxidant action of same concentration of EV, [KIO3] = 2 × 10⁻² M, Common condition; [H2SO4] = 2.50 × 10⁻² M. Scan rate = 100 mV / s.
3.3.2. Interpretation of Mechanism
[image:10.596.195.406.422.562.2]
experimental outcomes from flow and batch reactors. Furrow et al [13, 33] proposed a new mechanism called FCA model which was derived from the NFand DE models. The FCA mechanism is based on the important role played by HOO• radical (intermediate species which was generated during oscillatory reactions). Based on FCA model, the oscillatory mechanism for [Ni]2+ complex-catalyzed system consists of 12 oscillatory reactions as below.
HOI + I− + H+ ↔ I2 + H2O 1
HIO2 + I− + H+ → 2HOI 2
IO3− + I− + 2H+↔ HIO2 + HOI 3
2HIO2 → IO3− + HOI + H+ 4
IO3− + HIO2 + H+↔ 2IO2• + H2O 5
2HOO• → H2O2 + O2 6
HOI + H2O2 → I−+ O2 + H+ + H2O 7
IO2• + [NiL]2+ + H+↔ [NiL]3+ + HIO2 8
H2O2 + [NiL]3+ → [NiL]2+ + HOO• + H+ 9
HOO• + IO3− + H+→ O2 + H2O + IO2 • 10
MA ↔ MA(enol) 11
I2 + MA(enol) → MAI(IMAI) + I- + H+ 12
inhibition time. It is our claim that such an inhibition time was due to the involvement of HOO• radical with antioxidant (ethyl vanillin). The detail explanations are as below.
(Where m stands for integer)
Reactions 13 and 14 show that EV reacts with HOO• radicals to generate EV radical and EV radical reacted together to form products. Both reactions 13 and 14 should be included to FCA Model [43].
The HOO• radical were consumed both in reactions 10 and 13, whereas consumption in reaction 13 is faster, that’s why reaction 13 become dominated in consuming HOO• radicals. The deficiency in HOO• radicals caused the decrease in the IO2• radicals via reaction 10. The IO2• radical responsible for the oxidation of [NiL]2+ into [NiL]3+ via reaction 8. The Insufficiency of IO2• radical led to the decreased in the [NiL]3+ thus the reduction of [NiL]3+ into [NiL]2+ was stop via reaction 9. So in short the oscillation between [NiL]2+ and [NiL]3+ were terminated. Therefore the inhibition time were noticed. When EV was completely consumed in reaction 13, the reaction 8, 9, and 10 become predominate again and the oscillation regenerated.
4. CONCLUSIONS
In this paper, we presented the quantitative method for determination of EV (antioxidant) by using a Briggs-Rauscher oscillator. The oscillator was catalyzed by a tetraazamacrocyclic complex with ligand L being 5,7,7,12,14,14-hexamethyl-1,4,8,11-tetraazacyclotetradeca-4,11-diene. The addition of small amount of EV in the BR system temporarily ceased and regenerated oscillation after inhibition time (tin). The tin was dependent on the concentration of EV. When the amount of EV increased, inhibition time increased. Thus polynomial regression curve was achieved over a range of 7.5 × 10⁻⁶ to 3.5 × 10⁻⁵ M with a correlation coefficient of 0.98 of EV. Although the cyclic voltammetry results showed the redox reaction between the KIO3 and EV, the inhibition time was actually caused by the reaction between EV and HOO• intermediate species.
ACKNOWLEDGEMENT
References
1. H. Sies, Exp. Physiol, 82 (1997) 291–5.
2. S. J. Dixon, and B. R. Stockwell, Nat Chem. Biol, 10 (2014) 9–17. 3. H. H. Draper, and R. P. Bird, J. Agri. Food. Chem, 32 (1984) 433–435. 4. J. Wu, M. H. Lee, C. T. Ho, and Chang, S. J. A. O. C. S, 59 (1982) 339–345.
5. Z. Formanek, J. P. Kerry, F. M. Higgins, D. J. Buckley, P. A. Morrissey, and Farkas, J. Meat Science, 58 (2001) 337–341.
6. S. Nieto, A. Garrido, J. Sanhueza, L. Loyola, G. Morales, and F. Leighton et al, J. A. O. C. S, 70 (1993) 773–778.
7. M. Karpinska, J. Borowski, and M. Danowska-Oziewicz, Food Chemistry, 72 (2001) 5–9. 8. H. Liu, N. Qiu, H. Ding, and R. Yao, Food. Res. Int, 41 (2008), 363–370.
9. G. Hu, Q. Zheng, Yangang. Hu, Xiafeng. Shen, and J. Song, Electrochim. Acta, 136 (2014) 33-40. 10.R. Cervellati, N. Crespi-Perellino, S. D. Furrow, and A. Minghetti. Helv. Chem. Acta, 83 (2000)
3179-3190.
11.R. Cervellati, K. Honer, S. D. Furrow, C. Neddens, S. Costa, Helv. Chim. Acta, 84 (2001) 3533-3547.
12. R. Cervellati, K. Honer, S. D. Furrow, and F. Mazzanti, Helv. Chim. Acta, 85 (2000) 2523. 13. S. D. Furrow, K. Honer, and R. F. Cerellati, Helv. Chim. Acta, 87 (2004) 735.
14.J. G. Kljusuric, S. Djakovic, I. Kruhak, K. K. Ganic, D. Komes, and Z. F. Kurtanjek, Acta. Aliment. Hung, 34 (2005) 483.
15.T. S. Briggs, and W. C. Rauscher, J. Chem. Educ, 50 (1973) 496.
16.Ni. Yongnian, G. Zhang, and S. Kokot, Food chemistry, 89 (2005) 465-473. 17.Kahan, and S. Krueger, J. A. O. A. C. Int, 80 (1997) 3.
18.De. Jager, Lower. S. Perfetti, Gracia. A. Diachenko, and W. Gregory, J. chromatogr, 45 (2000) 83-88.
19.L. Ali, and Perfetti, Diachenko, G. J. A. O. A. C. Int., 91 (2008) 383-6. 20.N. F. Curtis, J. Chem. Soc. Dalton. Trans, 13 (1972) 1357-1361.
21.N. F. Curtis, and R. W. Hay, Chem. Commun. London, 0 (1966) 524-525.
22.G. Hu, L. Zhu, M. M. Guo, and H. Liu, Asian Journal of Chemistry, 22 (2010) 6393–6396. 23.R. Cervellati, and S. D. Furrow, Russ. J. Chem. A, 87 (2013) 2121-2126.
24.S. D. Furrow, R. Cervellati, and E. Greco, Z. Naturforsch, B, 67 (2012) 89-97.
25.J. Gao, Y. Liu, J. Ren, X. Zhang, M. Li and W. Yang, J. Serb. Chem. Soc., 77 (2012) 95-104. 26.M. Milos, and D. Makota, Food Chemistry, 113 (2012) 296-299.
27.T. C. Choit, and B. W. Tharp, Journal of Dairy Science, 46 (1963) 237.
28.Y. Shen, C. Han, B. Liu, Z. Liu, X. Zhou, C. Wang, and Z. Zhu, J. Dairy Sci., 97 (2014) 679-686. 29.E. Perez-Esteve, M. J. Lerma-García, A. Fuentes, C. Palomares, and J. M. Barat, Food control, 67
(2016) 171-176.
30.R. M. Noyes, and S. D. Furrow, J. Am. Chem. Soc, 104 (1982) 45. 31.P. D. Kepper, and I. R. Epstein, J. Am. Chem. Soc, 104 (1982) 49.
32.V. Vukojevic, P. G. Sorensen, and F. Hynne, J. Phys. Chem. 100 (1996) 17175.
33.R. Cervellati, K. Höner, S. D. Furrow, F. Mazzanti, and S. Costa, Helv. Chim. Acta, 87 (2004) 133. 34.D. A. Franz, J. Chem. Educ, 68 (1991) 57.
35.R. Cervellati, E. Greco, and S. D. Furrow, J. Phys. Chem. A, 114 (2010) 12888-12892. 36.E. Szabo and P. Sevcik, J. Phys. Chem. A, 113 (2009) 3127–3132.
37.R. Cervellati, C. Renzulli, M. C. Guerra, and E. Speroni, J. Agric. Food Chem. 50 (2002) 7504-7509.
38.T. Cecchi, P. Passamonti, and P. Cecchi, Food Anal. Methods, 3 (2010) 1–6.
40.T. Lawson, J. Fulop, M. Wittmann, Z. Noszticzius, N. Muntean, G. Szabo, and L. Onel, J. Phys. Chem. A, 113(2009) 14095–14098.
41.M. Li, G. Hu, and Y. Chen, Food Chemistry, 197 (2016) 987–991.
42.J. Hu, G. Hu, J. Song, Z. Fang, X. Shen and L. Hu, J. Chin. Chem. Soc. 63 (2016) 572-579. 43.S. Fujisawa, T. Atsumi, Y. Kadoma, and H. Sakagami, Toxicology, 177 (2002) 39-54.

![Figure 2. Influence of the concentrations of reactants on the inhibition time: (a) H2SO4; conditions: [KIO3] = 2.1 × 10⁻² M; [[NiL](ClO4)2 ] = 8.65 × 10⁻⁴ M; [MA] = 1.5 × 10⁻¹ M; [H2O2] = 1.4 M; t = 4 ± 0.5 OC](https://thumb-us.123doks.com/thumbv2/123dok_us/1801914.135128/7.596.186.412.72.229/figure-influence-concentrations-reactants-inhibition-time-conditions-nil.webp)

![Figure 4. (a). The UV spectrum of EV in the presence of H2SO4 and KIO3, conditions: [EV] = 2 × 10⁻⁴ to 3.17 × 10⁻⁴ M, [H2SO4] = 2 × 10⁻² M, [KIO3] = 2.3 × 10⁻² M, (b)](https://thumb-us.123doks.com/thumbv2/123dok_us/1801914.135128/9.596.93.503.201.410/figure-uv-spectrum-presence-kio-conditions-so-kio.webp)
![Figure 5. Cyclic Voltammogram of the reaction between EV and the reactants obtained in the idant and prooxidant action of same concentration of EV, [KIO3] = 2 × 10⁻² M, Common condition; [H2SO4] = 2.50 × 10⁻² M](https://thumb-us.123doks.com/thumbv2/123dok_us/1801914.135128/10.596.195.406.422.562/figure-voltammogram-reaction-reactants-obtained-prooxidant-concentration-condition.webp)
