Int. J. Electrochem. Sci., 13 (2018) 4670 – 4692, doi: 10.20964/2018.05.28
International Journal of
ELECTROCHEMICAL
SCIENCE
www.electrochemsci.org
Experimental and Theoretical Studies of the Inhibition Effects
of 4-Hydroxycoumarin Derivatives on the Corrosion of Al in
Hydrochloric Acid Solution
A. S. Fouda1,*, S. H. Etaiw2, M. Salah1
1
Department of Chemistry, Faculty of Science, El-Mansoura University, El-Mansoura-35516, Egypt,
2
Department of Chemistry, Faculty of Science, Tanta University, Tanta, Egypt
*
E-mail: asfouda@hotmail.com, asfouda@mans.edu.eg
Received: 15 January 2018 / Accepted: 5 March 2018 / Published: 10 April 2018
The effect of 4-Hydroxycoumarin Derivatives (HCD), as a safe inhibitor, was examined by calculating the corrosion of Al in 1.0 M HCl solution at 25–45°C. Calculation was shown under numerous experimental conditions utilized mass loss (ML), Tafel polarization (TP), electrochemical impedance EIS and electrochemical frequency modulation EFM tests. The protection efficiency (% I) improved with raised in concentration of the inhibitors. Rise in temperature improved the corrosion rate in the existence and nonexistence of inhibitors but reduced the protection efficiency. (HCD) obeyed adsorption isotherm of Langmuir at all temperatures used. TP curves gave indication that the HCD act as mixed-kind inhibitor. The morphology of inhibited Al surface was analyzed by scanning electron microscope (SEM), Fourier transform infrared spectroscopy (FTIR) and nanotechnology atomic force microscopy (AFM). Finally, Theoretical data and experimental results were in good correlation.
Keywords: 4-Hydroxycoumarin Derivatives, Corrosion inhibition, HCl, SEM, EDX, AFM, FTIR
1. INTRODUCTION
produced [4]. These inhibitors are used to prevent the corrosion of Fe, Al and Cu in the various corroding media because it has high efficiency in inhibiting Al, density is less, the appearance is pleasing and corrosion resistant [5]. The inhibition of Al by organic compounds is as follows adsorbing organic particles on the metal surface and forming a protective layer which reduces metal corrosion [6-8]. Chemical and Physical adsorption are the two highest type of adsorption that occur as obtained data of interaction among organic inhibitors and the metal surface. The collection of these compounds is established on: a) are highly soluble in the examined medium, and b) contain polar functional groups (such as N=N, –CN, and C=O) and multiple bonds and c) have high molecular size
The objective of this work is to examine the protective action of HCD, as a safe-inhibitor, against the Al corrosion in 1.0 M HCl solution utilizing different tests such as ML and some electrochemical methods. The obtained data were verified by using FT-IR spectroscopy, AFM, SEM, and theoretical data.
2. MATERIALS AND TECHNIQUES
2.1. Materials and solutions
The working electrode was prepared from Al sheet (99.98%). The coins were mechanically abraded with dissimilar grades of emery papers (320- 2000) then wash away with twice distilled water, and desiccated at room temperature. The preparation of aggressive solution using twice distilled water to dilute analytical reagent grade 37% HCl to obtain the required acid concentration (1 M HCl).
2.2. Inhibitors
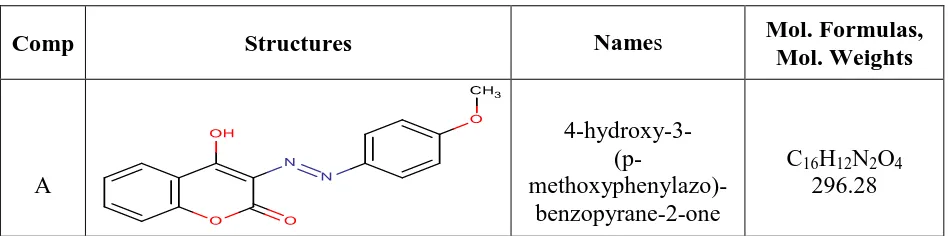
[image:2.596.62.536.625.743.2]The investigated 4-hydroxycoumarin and its para-substituted derivatives were synthesized according to the procedures that illustrated in previous paper [9]. These compounds are presented in Table (1) .The stock solutions of HCD (10-3M) were ready by dissolving an accurately weight quantity of each material in suitable volume of dimethyl formamide (DMF) and absolute ethanol, then the required concentration (4 x10⁻⁶ - 24 x10-6M) were prepared by dissolving with twice distilled water.
Table 1. Chemical structures and molecular formulas of the organic inhibitors
Comp Structures Names Mol. Formulas,
Mol. Weights
A
4-hydroxy-3-
(p- methoxyphenylazo)-benzopyrane-2-one
C16H12N2O4
B
4-hydroxy-3- (p-methyl phenylazo)-benzopyrane-2-one
C16H12N2O3
280.28
C
4-hydroxy-3-phenylazo- benzopyrane-2-one
C15H10N2O3
266.25
D
4-hydroxy-3- (p-chloro- phenylazo)-benzopyrane-2-one
C15H9N2O3Cl
300.70
2.3. Techniques utilized for corrosion tests 2.3.1. Mass loss technique
Glass beaker of volume 100 ml was used in this method. The temperature of the experiment was controlled by using water bath. The Al pieces were prepared as previously mentioned. The solutions of 100 ml of 1M HCl only and with presence of various concentrations of HCD were prepared by immersion of Al coins for 3 hours at temperature range from 25 to 45°C. After every 30 min of the test the Al was detached from the solution, washed with twice distilled water, dried and then weighed carefully by sensitive balance. The (I %) and surface coverage (θ) could be measured from the average ML values as in the next eq. (1).
I % = ϴ × 100 = [ 1 – (Winh / Wfree)] × 100 (1)
where Wfree is the average ML of Al in acid only and Winh of acid in presence of different
concentrations of HCD.
2.3.1.1 Temperature Effect
The influence of temperature on the Al corrosion was studied at various temperatures as 25°C, 30°C, 35°C, 40°C and 45°C for 3 hours. The results obtained from this study could be used to calculate the (I %), activation and adsorption parameters.
2.3.3 Electrochemical procedures
measure the corrosion rate by two different techniques (Tafel polarization, EFM and EIS). This computer was utilized to collect the results by Gamry applications, which contain EIS300 for EIS, DC105 for polarization and EFM140 for (EFM) tests. Graph and fit data were done by using software like Echem Analyst. The electrode potential was automatically changed from (-0.8 to 0.8 V vs. SCE) at OCP with a scan rate 1 mVs-1 to obtain Tafel polarization diagrams. The corrosion current densities could be obtained by extrapolation of the cathodic and anodic diagrams to corrosion potential. The (I %) and (ϴ) were measured by utilizing corrosion current density (icorr) according to the following eq.
(2).
I% = ϴ × 100 = [1 – (icorr(inh) /icorr(free))] × 100, (2)
where icorr(free) is the corrosion current density for Al in acid only and icorr(inh) for Al in acid with
various concentrations of inhibitor.
EIS technique was carried out in suitable conditions such as frequency range of 107 Hz to 0.1 Hz with amplitude of 5 mV [10]. According to the next eq. (3), the (I %) and (ϴ) were measured by utilizing the next eq. (3)
I% = [1 – (R°ct / Rct)] × 100 = ϴ × 100, (3)
where R°ct and Rct represent the resistance of charge transfer for Al in acid only and with
presence of various concentrations of inhibitor.
Two frequencies: 2 and 5 Hz were used in EFM test. Three evidences are the principles for the choice of these frequencies [11-13]. The parameters obtained from EFM (icorr, ßa, ßc and the causality
factors CF-2&CF-3 were measured by using the large peaks. Before any measurements, the electrode potential was allowed to stabilize half hour. The electrochemical processes were done at room temperature.
2.4 Surface characterization
The Al metal was put in 1M hydrochloric acid only and in acid with addition of higher concentration of HCD for 24 hours, removed from the solution and dried at room temperature. The film formed on the Al surface was examined by using techniques such as SEM, AFM and FT-IR spectroscopy.
2.5 Quantum Chemical Calculations
3. RESULTS AND DISCUSSION
3.1. Tafel polarization (TP) characterization
-1.5 -1.0 -0.5 0.0
1E-5 1E-4 1E-3 0.01 0.1
Blank 4x10⁻⁶ M
8x10⁻⁶ M
12x10-6 M 16x10-6 M
20x10-6 M 24x10-6 M
log i
, m
A
cm
-2
E, mv (vs SCE)
Figure 1. Tafel polarization graphs for Al corrosion in with and without various concentrations of compound A at 25°C
Table 2. TP parameters at various concentrations of investigated compounds on Al corrosion in 1M HCl at 25°C
Comp Conc., x106 M 106 M
icorr,
μA cm-2
- Ecorr,
mV vs SCE
βa
mV dec-1
βc
mV dec-1
C.Rx102
mpy Ɵ % I
Blank 0.0 510 735 120 257 154 -- --
A
4 67.8 770 80 160 70 0.778 77.8
8 58.5 740 78 140 69 0.802 80.2
12 55.30 742 71 143 52 0.853 85.3
16 40.6 753 67 133 22 0.873 87.3
20 26.2 752 68 129 15 0.916 91.6
24 21.5 754 70 137 10 0.935 93.5
B
4 79.3 740 88 158 88 0.759 75.9
8 67.8 770 83 152 71 0.775 77.5
12 61.00 742 76 139 62 0.827 82.7
16 51.7 755 73 144 32 0.867 86.7
20 33 762 67 133 28 0.902 90.2
24 26.2 763 72 131 18 0.924 92.4
C
4 81.5 771 74 166 94 0.739 73.9
8 73.5 766 88 140 81 0.755 75.5
12 68.60 770 76 137 72 0.808 80.8
16 56.3 770 79 151 42 0.847 84.7
20 37.7 754 77 142 38 0.878 87.8
24 28.4 763 74 138 25 0.904 90.4
D
4 81.5 771 84 144 98 0.718 71.8
8 73.5 766 85 140 86 0.733 73.3
12 68.60 770 76 155 79 0.784 78.4
16 56.3 770 81 139 52 0.808 80.8
20 37.7 754 84 142 48 0.849 84.9
[image:5.596.174.421.133.323.2] [image:5.596.40.564.421.733.2]
Figure 1 indicates the resulting effect on TP graphs for Al corrosion in 1M hydrochloric acid only and also in acid in existence of varied concentrations of the inhibitor (A). Other curves were received for other compounds (not presented). Parameters that related to this processes were listed in Table 2. It was observed that the data of icorr decrease gradually in presence of HCD inhibitors and
hence decreases the corrosion rate. Both anodic and cathodic diagrams move to lower current density in existence of inhibitors in 1M hydrochloric acid. It was found that the mechanism of Al corrosion process and hydrogen evolution not change when inhibitors were added. This is due to the stability values of both anodic and cathodic slopes in presence of HCD. Generally, if the Ecorr in presence of
inhibitors move to more 85 mV than in case of absence of inhibitor, this inhibitor will be classified as cathodic type [14]. In presence of HCD, corrosion potential (Ecorr) transmits to negative value but this
move is less than 85 mV, so these compounds can be classified as mixed kind inhibitors. The order of IE of the investigated inhibitors is observed to be: A > B > C > D
3.2. EIS Characterization
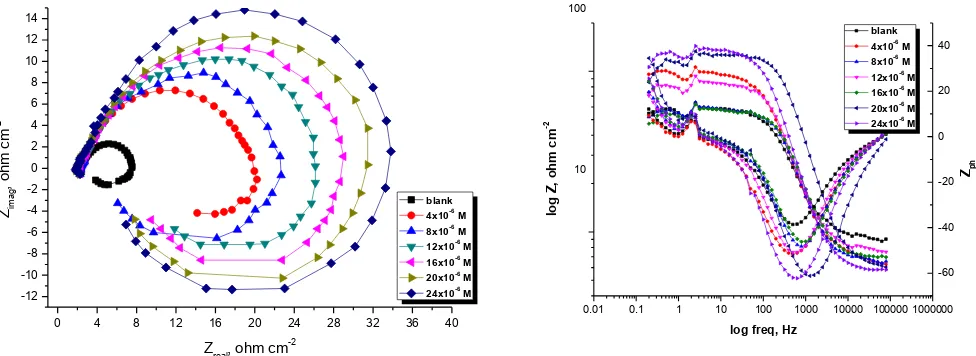
Both Nyquist and Bode graphs for Al corrosion in 1M HCl only and also in acid in presence of various concentrations of inhibitor (A) were obtained by EIS procedure and shown in Figures 2. The same curves attained for other compounds (not presented). It is noticed from Nyquist Figure that the curves appear semicircular.
0 4 8 12 16 20 24 28 32 36 40
-12 -10 -8 -6 -4 -2 0 2 4 6 8 10 12 14 blank
4x10⁻⁶ M
8x10⁻⁶
M
12x10-6
M
16x10-6 M
20x10-6 M
24x10-6
M Zima
g , o h m cm -2
Zreal, ohm cm-2
0.01 0.1 1 10 100 1000 10000 100000 1000000
10 100 blank 4x10⁻⁶ M 8x10⁻⁶ M 12x10-6 M
16x10-6 M
20x10-6 M 24x10-6 M lo g Z , o h m c m -2
log freq, Hz
[image:6.596.57.545.415.593.2]-60 -40 -20 0 20 40 Zph
[image:6.596.145.448.656.730.2]Figure 2. Nyquist and Bode graphs for Al corrosion in 1M HCl only and in acid in existence of varied concentrations of inhibitor (A) at 25°C
The frequency dispersion is responsible for the shape of the curves. The special shape of the Nyquist curves confirms that the Al corrosion is controlled by charge transfer process [15, 16]. It was found that in the Nyquist diagrams the presence of inhibitor leads to increase the diameter of capacitive loop. Resistance of charge transfer (Rct) is responsible for high frequency capacitive loop.
Figure 3, which represent a single charge transfer reaction and fits well with our experimental result data. The constant phase element, CPE, is introduced in the circuit instead of a pure double layer capacitor to obtain a more correct fit [17]. The (Cdl) is the frequency at which the element of the
impedance is maximum and could be measured according to the next eq. (4)
Cdl = 1 / 2 Fmax Rct (4)
where Rct is the charge transfer resistance and Fmax is the frequency at the maximum height of
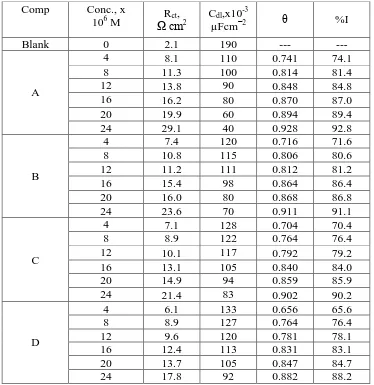
[image:7.596.112.486.328.713.2]the semicircle [18,19]. To measure the (I %), eq. (3) was applied. The parameters obtained by EIS process was reported in Table 3.
Table 3. Parameters obtained by EIS process for Al corrosion in 1M HCl only (blank) and in acid in existence of varied concentrations of examined compounds at 25°C
Comp Conc., x
106 M Ω cmRct, 2 Cdl,x10
-3
µFcm−2 θ %I
Blank 0 2.1 190 --- ---
A
4 8.1 110 0.741 74.1
8 11.3 100 0.814 81.4
12 13.8 90 0.848 84.8
16 16.2 80 0.870 87.0
20 19.9 60 0.894 89.4
24 29.1 40 0.928 92.8
B
4 7.4 120 0.716 71.6
8 10.8 115 0.806 80.6
12 11.2 111 0.812 81.2
16 15.4 98 0.864 86.4
20 16.0 80 0.868 86.8
24 23.6 70 0.911 91.1
C
4 7.1 128 0.704 70.4
8 8.9 122 0.764 76.4
12 10.1 117 0.792 79.2
16 13.1 105 0.840 84.0
20 14.9 94 0.859 85.9
24 21.4 83 0.902 90.2
D
4 6.1 133 0.656 65.6
8 8.9 127 0.764 76.4
12 9.6 120 0.781 78.1
16 12.4 113 0.831 83.1
20 13.7 105 0.847 84.7
From the obtained data, it was observed that the Rct values increase with increasing
investigated compound concentration but Cdl values decrease. The results obtained prove that the HCD
works by forming the protecting layer on the Al surface which changes the Al/acid interface. The order of IE obtained from EIS test is: A> B > C > D.
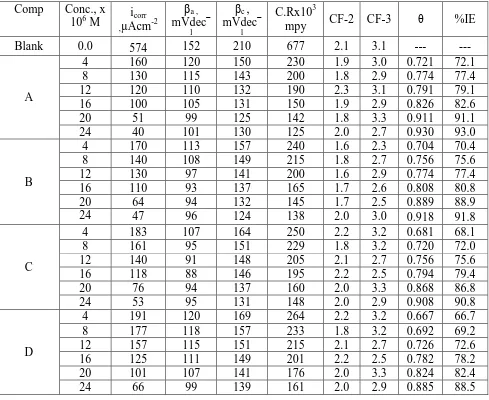
3.3. EFM characterization
Intermodulation spectrum was obtained from EFM experiments. The spectrum is due to current response as a function of frequency. The equivalent current response in intermodulation spectrum for Al corrosion in acidic solution only and also in acid in existence of varied concentrations of inhibitor (A) was shown in Figure 4. Similar intermodulation spectra were obtained for different compounds (not shown). Results obtained by EFM processes were shown in Table 4. EFM technique produces different corrosion parameters such as (I %), (βa, βc), (icor) and (CF-2, CF-3) for Al corrosion in
hydrochloric acid in existence of varied concentrations of examined inhibitors. It was observed from obtained information that the corrosion current density data lower with improving the HCD concentration and hence the IE% rises.
0.0 0.2 0.4 0.6 0.8 1.0 1.2 1.4 1.6
1E-8 1E-7 1E-6 1E-5 1E-4 1E-3
0.0 0.2 0.4 0.6 0.8 1.0 1.2 1.4 1.6
1E-8 1E-7 1E-6 1E-5 1E-4 1E-3
0.0 0.2 0.4 0.6 0.8 1.0 1.2 1.4 1.6
1E-10 1E-9 1E-8 1E-7 1E-6 1E-5 1E-4 1E-3
0.0 0.2 0.4 0.6 0.8 1.0 1.2 1.4 1.6
1E-8 1E-7 1E-6 1E-5 1E-4 1E-3
0.0 0.2 0.4 0.6 0.8 1.0 1.2 1.4 1.6
1E-8 1E-7 1E-6 1E-5 1E-4 1E-3
0.0 0.2 0.4 0.6 0.8 1.0 1.2 1.4 1.6
1E-8 1E-7 1E-6 1E-5 1E-4 1E-3
0.0 0.2 0.4 0.6 0.8 1.0 1.2 1.4 1.6
1E-8 1E-7 1E-6 1E-5 1E-4 1E-3 Cu rr e n t( A) Frequency(Hz)
4x10⁻⁶M
Cu rr e n t( A) Frequency(Hz)
8x10⁻⁶M
Cu rr e n t( A) Frequency(Hz)
12x10-6M
Cu rr e n t( A) Frequency(Hz)
16x10-6M
Cu rr e n t( A) Frequency(Hz) 20x10-6M C ur ren t( A ) Frequency(Hz)
24x10-6M
[image:8.596.121.482.376.636.2]C ur re nt (A ) Frequency(Hz) Blank
Figure 4. EFM spectra for Al corrosion in 1M hydrochloric acid only and also in acid in existence of varied concentrations of inhibitor (A) at 25oC
spectra of the current response were used to calculate the causality factors. If the EFM measurements were affected by noise, the causality factors would depart significantly from the theoretical values. If the causality factors are very near to the theoretical data, the results obtained are powerful data. The presence of the causality factors which act as quality control on the validity of the EFM makes this technique powerful. The % I that evaluated from this test is in the order A > B > C > D.
Table 4. Parameters obtained by EFM process for Al corrosion in 1M HCl only and also in acid in existence of varied concentrations of investigated compound at 25oC
Comp Conc., x
106 M ,µAcmicorr -2
βa ,
mVdec−
1
βc ,
mVdec−
1
C.Rx103
mpy CF-2 CF-3 θ %IE
Blank 0.0 574 152 210 677 2.1 3.1 --- ---
A
4 160 120 150 230 1.9 3.0 0.721 72.1
8 130 115 143 200 1.8 2.9 0.774 77.4
12 120 110 132 190 2.3 3.1 0.791 79.1
16 100 105 131 150 1.9 2.9 0.826 82.6
20 51 99 125 142 1.8 3.3 0.911 91.1
24 40 101 130 125 2.0 2.7 0.930 93.0
B
4 170 113 157 240 1.6 2.3 0.704 70.4
8 140 108 149 215 1.8 2.7 0.756 75.6
12 130 97 141 200 1.6 2.9 0.774 77.4
16 110 93 137 165 1.7 2.6 0.808 80.8
20 64 94 132 145 1.7 2.5 0.889 88.9
24 47 96 124 138 2.0 3.0 0.918 91.8
C
4 183 107 164 250 2.2 3.2 0.681 68.1
8 161 95 151 229 1.8 3.2 0.720 72.0
12 140 91 148 205 2.1 2.7 0.756 75.6
16 118 88 146 195 2.2 2.5 0.794 79.4
20 76 94 137 160 2.0 3.3 0.868 86.8
24 53 95 131 148 2.0 2.9 0.908 90.8
D
4 191 120 169 264 2.2 3.2 0.667 66.7
8 177 118 157 233 1.8 3.2 0.692 69.2
12 157 115 151 215 2.1 2.7 0.726 72.6
16 125 111 149 201 2.2 2.5 0.782 78.2
20 101 107 141 176 2.0 3.3 0.824 82.4
24 66 99 139 161 2.0 2.9 0.885 88.5
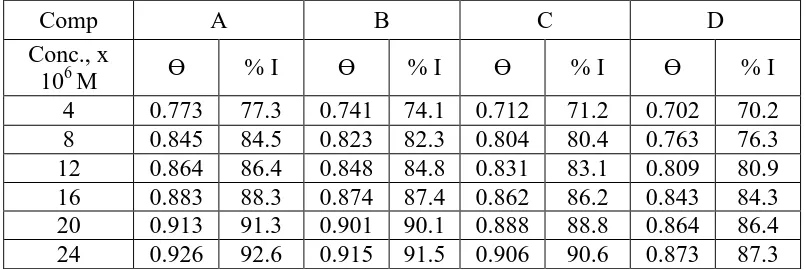
3.4. ML characterization
[image:9.596.55.544.223.623.2]
cm-2) and the corrosion rate (C.R.). The (% I) and the θ, of the examined compounds for the corrosion of Al were calculated from eq. (1) [21]. % I occurred by these compounds decreased in the order: A > B > C > D.
20 40 60 80 100 120 140 160 180 200
0.0 0.4 0.8 1.2 1.6 2.0 2.4 2.8
Blank 4x10⁻⁶
M 8x10⁻⁶
M 12x10-6 M 16x10-6
M 20x10-6
M 24x10-6 M
We
ig
h
t l
o
ss
,m
g
c
m
-2
Time (min)
Figure 5. ML-time curves for the dissolution of Al without and with various concentrations of compound (A) at 25oC
Table 5. % I of all compounds at 120 min for Al corrosion in 1M HCl solution without and with various concentrations of investigated compounds as determined from ML technique at 25ºC
Comp A B C D
Conc., x
106 M Ɵ % I Ɵ % I Ɵ % I Ɵ % I
4 0.773 77.3 0.741 74.1 0.712 71.2 0.702 70.2 8 0.845 84.5 0.823 82.3 0.804 80.4 0.763 76.3 12 0.864 86.4 0.848 84.8 0.831 83.1 0.809 80.9 16 0.883 88.3 0.874 87.4 0.862 86.2 0.843 84.3 20 0.913 91.3 0.901 90.1 0.888 88.8 0.864 86.4 24 0.926 92.6 0.915 91.5 0.906 90.6 0.873 87.3
3.5. Effect of temperature
Various inhibitors concentrations were examine in the temperature range of 298–318 K utilizing ML tests. It was found that the % I decreases with raising temperature but at slight rate than in unprotected solutions with increasing the concentration of the HCD, as shown in Table 6, also the data from (Table 6) for compound (A), explains that the adsorption decreases with increasing the temperature and corrosion rate (kcorr) [22], similar tables were acquired for other compounds (not
[image:10.596.165.431.150.344.2] [image:10.596.97.500.462.597.2]
Figure 6 variation of I% of compound (A) with various temperatures using different concentrations of compound (A) for Al corrosion in 1M HCl, (similar curves were acquired in presence of the other compounds, (but not presented). The decrease of % I with temperature rise an indication for the physical adsorption of these investigated compounds on Al surface.
300 305 310 315 320
0 20 40 60 80 100
I%
T, K
4x10⁻⁶
M 8x10⁻⁶
M 12x10-6
M 16x10-6
M 20x10-6
M 24x10-6
[image:11.596.139.456.173.413.2]M
[image:11.596.125.473.511.761.2]Figure 6. Effect of temperature on % I at various concentrations of compound (A) for Al corrosion in 1M HCl
Table 6. Values of % I, ( ) and corrosion rate (kcorr) for Al dissolution after 120 min immersion in 1M
HCl without and with various concentrations of compound (A) at various temperatures Conc.,
x 106M
Temp, K
kcorr,
mg cm-2 min-1 θ %I
blank
298
16.7 --- ---
4 3.7 0.773 77.3
8 2.5 0.845 84.5
12 2.2 0.864 86.4
16 1.9 0.883 88.3
20 1.4 0.913 91.3
24 1.2 0.926 92.6
blank
303
18.3 ---- ---
4 4.5 0.754 75.4
8 3.1 0.826 82.6
12 2.8 0.845 84.5
16 2.4 0.864 86.4
20 1.9 0.894 89.4
blank
308
22.4 --- ---
4 6.0 0.73 73
8 4.4 0.802 80.2
12 4.0 0.821 82.1
16 3.5 0.84 84
20 2.9 0.87 87
24 2.6 0.883 88.3
blank
313
44.5 --- ---
4 12.8 0.711 71.1
8 9.6 0.783 78.3
12 8.8 0.802 80.2
16 7.9 0.821 82.1
20 6.6 0.851 85.1
24 6.0 0.864 86.4
blank
318
58.3 --- ---
4 17.7 0.695 69.5
8 13.5 0.767 76.7
12 12.4 0.786 78.6
16 11.3 0.805 80.5
20 9.6 0.835 83.5
24 8.8 0.848 84.8
The (E*a) of the corrosion process was measured utilizing Arrhenius eq. (6):
kcorr = A exp (-E*a / RT) (6)
where A is Arrhenius constant and E*a values of activation energies. The E*a data can be result
from the slope of the lines of drawing log kcorr vs 1/T (Figure 7) with and without investigated
compounds at various temperatures, the data are given in Table 7. The E*a values increases in presence
of inhibitor than in their absence. The measured E*a established that the examined compounds inhibit
corrosion more effectually at upper concentrations. Likewise, improve in E*a with the presence of
various concentrations of investigated compounds showing that the energy barrier for the corrosion reaction rises. These data showed that the existence of these HCD inhibitors improve the E*a of the
metal dissolution reaction and that the process is diffusion controlled (Ea*> 40 kJ mol–1). The blocking
of the active sites must be connect with rise in the E*a of Al corrosion in the protect state [23-24]. Δ
H*and ΔS* are measured from transition state theory utilizing eq. (7) [25]: kcorr = RT/Nh exp (ΔS*/R) exp (-Δ H*/ RT) (7)
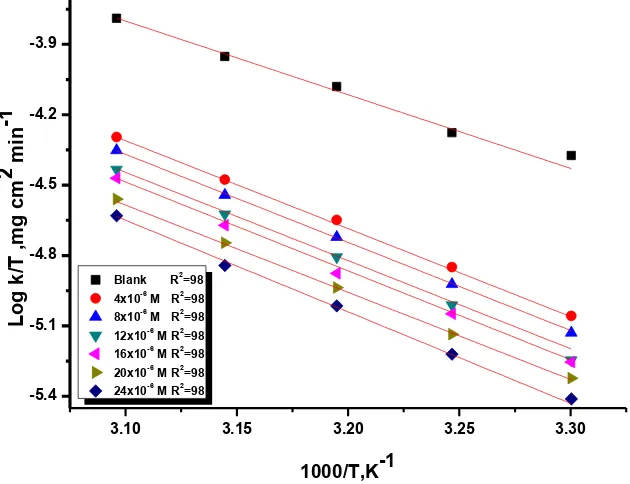
where h is Planck’s constant. Figure 8 displays a draw of log (kcorr /T) vs (1/T). Lines are
achieved with a slope of (ΔH*
[image:12.596.124.472.69.374.2]/2.303 R) and an intercept of (log R/Nh + ΔS*/2.303 R) and with linear regression (R2) is close to 1 from which the data of ΔH* and ΔS* are measured and also recorded in Table 7.
existence of these compounds. The -ve ∆S* showed that the activated complex in the rate-determining step signifies an association rather than dissociation step [28].
3.10 3.15 3.20 3.25 3.30
-3.0 -2.7 -2.4 -2.1 -1.8 -1.5 -1.2
Blank R2 =98 4x10⁻⁶
M R2 =98 8x10⁻⁶
M R2 =98 12x10-6
M R2 =98 16x10-6
M R2 =98 20x10-6
M R2 =98 24x10-6
M R2 =98 L o g k c o rr ,m g c m
2 m
in
-1
1000/T,K-1
Figure 7. Arrhenius plots (log kcorr vs 1/T) for the dissolution of Al in 1M HCl without and with
various concentrations of compound (A)
3.10 3.15 3.20 3.25 3.30
-5.4 -5.1 -4.8 -4.5 -4.2 -3.9
Blank R2
=98
4x10⁻⁶
M R2
=98
8x10⁻⁶
M R2
=98
12x10-6 M R2=98
16x10-6
M R2
=98
20x10-6
M R2
=98
24x10-6
M R2
=98 L o g k /T ,m g c m
2 m
in
-1
[image:13.596.129.472.130.396.2]1000/T,K-1
Figure 8. Plots of (log kcorr / T) vs 1/ T for the dissolution of Al in 1M HCl without and with various
[image:13.596.142.457.475.717.2]
Table 7. Kinetic activation data for Al corrosion in 1M HCl without and with various concentrations of all inhibitors
Comp Conc., x 106 M
Ea*,
kJ mol-1
∆H*
, kJ mol-1
-∆S*, J mol-1K-1
Blank 0.0 61.4 58.8 84.6
A
4 72.4 69.8 79.6
8 73 70.4 57.3
12 73.1 70.5 56.8
16 74.8 72.2 55.2
20 76.1 73.5 54.3
24 77.9 75.3 53.5
B
4 70.6 68 81.6
8 71.8 69.2 61.4
12 71.9 69.3 60.3
16 73.2 70.6 59
20 73.8 71.2 58.3
24 76 73.4 58
C
4 66.6 64 82.5
8 68.3 64.7 70.2
12 69.2 65.8 64.2
16 67.9 66.3 63.4
20 67.2 67.6 62.3
24 67.8 68 61.8
D
4 65.3 62.7 82.8
8 65.6 63.4 77.2
12 65.8 63.8 76.6
16 66.2 64.3 75.6
20 66.6 65.1 74.2
24 66.9 65.9 73.1
3.7. Adsorption isotherms
Different isotherms were applied on the obtained data from several curves by fitting these results. Figure 9 shows the graphs between (C/Ө) and (C) concentration of inhibitor A. Alike diagrams were acquired for other compounds (not presented). These diagrams were straight lines and give the correlation coefficient equal approximately unity. The good value of correlation shows that the type of adsorption of inhibitor on Al surface is Langmuir isotherm. Consequence, it is illustrated that there is harmony among the adsorbed molecules on the Al surface [29]. The standard free energy of adsorption (ΔG°ads) can be measured from the data of the equilibrium constant (Kads). The constant (Kads) of the
adsorption can be measured by the next eqs. [30, 31]:
C/Ө = 1/Kads + C (8)
Kads = 1/55.5 exp (-ΔG°ads)/RT (9)
The thermodynamic parameters results obtained are shown in Table 8. From these results, it was found that the ΔG°ads has negative sign. This -ve ΔG°ads designates that the adsorption of
investigated inhibitors on Al surface is spontaneous process.
0.000000 0.000005 0.000010 0.000015 0.000020 0.000025 0.04
0.08 0.12 0.16 0.20
25 oC
30 oC
35 oC
40 oC
45 oC
Concentration,(g/L)
C/
[image:15.596.153.441.154.370.2]
Figure 9. Diagrams from Langmuir for the adsorption of compound (A) on Al in 1M HCl at various temperatures
3.10 3.15 3.20 3.25 3.30
1.88 1.90 1.92 1.94 1.96 1.98 2.00 2.02 2.04 2.06 2.08
L
o
g
K ads
1000/T,K-1
Figure 10. Van`t Hoff plots (Log Kads vs 1/T) of inhibitor (A) in 1M HCl
In General, if the data of ΔG°ads reached about -20 kJ mol-1, there will be electrostatic
interaction among the charged Al and the charged molecules and this type of adsorption is called physical adsorption. Also, if the values of ΔG°ads reached more than -40 kJ mol-1, there will be transfer
[image:15.596.154.440.407.625.2]
ln Kads = - ΔH°ads /RT+ const. (10)
The graph between log Kads and 1/T for Al degradation in 1M hydrochloric acid in presence of
inhibitor (A) appears in Figure 10. From the results in Table 8, it is shown that the adsorption is an exothermic process due to the -ve sign ΔH°ads [35, 36]. At the end, the standard adsorption entropy
ΔS°
ads can be determined from the following eq.(11):
ΔGo
ads = ΔHoads - T ΔSoads (11)
From the calculated data in Table 8, it is appeared that the standard adsorption entropy data have negative sign. Negative value ΔSoads showed that a decrease in disorder of corrosion process on
Al surface in 1M HCl using organic compounds as corrosion inhibitors (Table 8) [37,38].
Table 8. Thermodynamic parameters for Al corrosion in HCl for investigated compounds at various temperatures
Comp Temp., K
Kads
M-1
-∆G°ads
kJ mol-1
-∆H◦ads
kJ mol-1
-∆S◦ads
J mol-K-1
A
298 125 22.1
26.1
71.2
303 114 21.2 68.3
308 101 20.3 66.1
313 98 19.4 65.9
318 77 18.5 63.1
B
298 75 20.6
30.7
69.1
303 65 20.1 66.5
308 60 19.6 63.3
313 56 19.1 62.7
318 47 18.1 61.8
C
298 44 18.4
32.2
66.2
303 39 18.1 62.7
308 36 17.9 61.3
313 32 17.2 60.1
318 26 16.9 58.3
D
298 35 17.9
36.7
61.2
303 28 17.3 59.7
308 27 16.8 57.4
313 25 16.3 54.4
318 21 15.9 51.2
3.8. Atomic force microscopy (AFM) analysis
[image:16.596.126.472.281.614.2]
Free Blank
Compound (A) Compound (B)
Compound (C) Compound (D)
[image:17.596.85.512.65.715.2]
[image:18.596.120.471.195.309.2]
The 3D images for polished Al surface (standard specimen), Al immersed in 1M hydrochloric acid (blank) and Al immersed in 1M hydrochloric acid containing 24x10-6 M from investigated compounds were shown in Figure 11. Roughness data for different Al surfaces are listed in Table 9. The roughness data give clear indication that the Al surface appears smoother due to the adsorption of the inhibitors on its surface and creating the protective layer [40].
Table 9. AFM roughness data of compounds (A-D) at 24x10-6M for 24 hours at 25oC Specimen Average roughness(Sa) nm
Free 33.2
Blank 433.5
compounds (A) 71.9
compounds (B) 83.4
compounds (C) 93.8
compounds (D) 121.3
3.9. (SEM) morphology
Free Blank Compound (A)
Compound (B) Compound (C) Compound (D)
[image:18.596.59.541.359.697.2]
To estimate the changes of the metal surface immersed in acid solution with and without inhibitors (A-D). The Al surface was analyzed using SEM. The Al samples in 1.0 M HCl solution in the presence and absence of the highest concentration of the inhibitors (A-D) (24x10-6) for one day were exposed to analysis. Figure (12) shows SEM micrographs. It is clear that, Al surface corrosion was reduced with the presence of the inhibitors (A-D). The other pictures revealed that there is high damage, several pits and cavities on the Al surface in the absence of inhibitors (A-D). This may be due to the adsorption of the organic compounds on the Al surface and create the passive film on it, this blocks the active sites existence on the Al surface [41, 42].
3.10. FTIR examination
Functional groups and characterizing covalent bonding data had been noticed by FT-IR which is significant analytical device [32] FTIR spectrum of the corrosion creation at Al superficial in 1M HCl does not display any suitable adsorption peaks; therefore, the corrosion creation of Al is not IR active. The finger print spectra of the inhibitor (A) and the Al surface after immersion in 1M HCl + 24x10-6 M of inhibitor A for 6 hours was give and associated to each other it was clearly clear that the same finger print of inhibitor (A) stock solution existence on Al surface except the nonexistence of some functional group and it recommended due to reaction with HCl. (similar plots were obtained in existence of the other compounds, (but not presented). From Figure 13 there are minor shift in the peaks at Al superficial from the original peak of the stock inhibitor solution, these changes designate that there is interaction among Al and HCD inhibitor’s molecules.
3500 3000 2500 2000 1500 1000 500
20 40 60 80 100
Free Inhibitor Inhhibitor + metal
%
T
ran
smi
ttan
ce
%
T
ran
smi
ttan
ce
Wavenumber (cm-1)
[image:19.596.171.427.450.628.2]50 100 150
Figure 13. FTIR spectra of inhibitor (A) stock solution (10-3 M) (b) and adsorbed layer of inhibitor (A) on Al surface (a)
3.11. Theoretical study of inhibitors
The measured quantum chemical directories (EHOMO, ELUMO, µ) of examined composites are
HOMO to LUMO. (ΔE), which is significant constancy index, is useful to improve theoretical models for elucidation the structure and conformation barriers in many molecular systems [43, 44]. The smaller is the data of ΔE, the more is the probable protection efficiency. It was displayed from Table 10 that compound (A) has the lowest (ELUMO–EHOMO) energy gap related with the other molecules.
Inhibitor s
HOMO LUMO
Mulliken Charges
A
B
C
D
Figure 14. The frontier molecular orbital density distribution of the examined inhibitors (HOMO and LUMO).
Accordingly, it could be predictable that composite (A) has more inclination to adsorb on the A surface than the other molecules. The higher data of (µ), the more is the likely protection efficiency. Finally, from Table 10, we create that the E HOMO and the E LUMO exchanged regularly, while the ∆E
[image:20.596.51.547.159.623.2]
of the electron. That is, there was electron transferring in the interaction among the inhibitor molecules and the Al surface. The ∆E lower with improving the % I, this designates that the more unstable of the inhibitors, the stronger interaction among the HCD and surface of Al. From the outcome data given we create that, the order of dipole moment lower in the next sequence:
[image:21.596.111.484.228.384.2]Compound (A) > (B) > (C) > (D) and this approve with the outcome data gotten from the experimental tests.
Table 10. Quantum chemical parameter for investigated derivatives
Compounds A B C D
EHOMO, (eV) -9.18 -9.35 -9.47 -9.51
ELUMO, (eV) -1.42 -1.43 -1.44 -1.28
ΔE, (eV) 7.76 7.92 8.03 8.23
μ , (Debye) -5.3 -5.4 -5.43 -5.46
4. MECHANISM OF CORROSION PROTECTION
As known from literature, the Al surface is negatively charged in acidic solutions [45]. These investigated compounds are present as protonated species (cationic form) in acid solution. So, it is easier for the protonated species to approach the negatively charged Al surface due to the electrostatic attraction [45]. Thus, we can achieve that protection of Al corrosion in HCl is mainly due to electrostatic interaction. The order of decreasing %I of the HCD compounds from all tests utilized techniques is: A ˃ B ˃ C ˃ D. Inhibitor (A) is the most efficient inhibitor due to: i) the existence of greatly electron donatingp-OCH3 group (with Hammett constant = -0.27) [46] which improves the
delocalized -electrons on the molecule ii) also may add an additional active site to the molecule due to its oxygen atom. Inhibitor (B) comes after inhibitor (A) in %I due existence of p-CH3 with ( = -0.17) which contribute less electron density to the molecule and also the absence of oxygen atom so gives less active centers. Inhibitor (C) is the least efficient inhibitor, this may be due to the existence of substituent group in para position and existence of H atom ( = 0.0) that donates no charge density to the molecule. Inhibitor (D) is the least efficient one, due to the presence of p-Cl (+0.22) group which acts as electron withdrawing groups; so it lowers the electron density on the active site and also the protection efficiency.
5. CONCLUSIONS
perform as mixed kind inhibitors for Al in HCl solution. EIS studies led to Rct data improved, while Cdl
data lowered in the existence of the inhibitors. The adsorption of the examined inhibitors was established to obey the adsorption Langmuir isotherm indicating that the inhibition process occurs via adsorption. The attendance of the protective film on the surface of Al was proving by AFM, SEM and FTIR analysis. The %I obtained from electrochemical and non-electrochemical tests are in a best agreement.
References
1. K. C. Emregul and A.A. Aksut, Corros. Sci., 42 (2008) 2051.
2. M.G. Fontana and R.W. Staehle (Eds.), Adv. Corros. Sci. Technol., 1 (1970) 248. 3. T. Jain, R. Chowdhary and S.P. Mathur, Mater. Corros., 57 (2006) 422.
4. S.L. Granese, Corrosion, 44 (1988) 322.
5. T. Mimani, S.M. Mayanna and N. Munichandraiah, J. Appl. Electrochem., 23 (1993) 339. 6. E.E. Oguzie, Corros. Sci., 49 (2007) 1527.
7. M.A. Hukovic, Z. Gribac and E.S. Lisac, Corrosion, 50 (1994) 146. 8. S.S. Mahmoud and G.A. El-Mahdy, Corrosion, 53 (1997) 437. 9. A.G.F. Shoair, J. Coord. Chem., 60(10) (2007) 1101.
10.H. Ma, S. Chen, L. Niu, S. Zhao, S. Li and D. Li, J. Appl. Electrochem., 32 (2002) 65. 11.R.W. Bosch, J. Hubrecht, W.F. Bogaerts and B.C. Syrett, Corrosion, 57 (2001) 60.
12.S.S. Abdel–Rehim, K.F. Khaled and N.S. Abd–Elshafi, Electrochim. Acta, 51 (2006) 3269. 13.Z. Khiati, A.A. Othman, M. Sanchez-Moreno, M.C. Bernard, S. Joiret, E.M.M Sutter and V.
Vivier, Corros. Sci., 35 (2011) 3092.
14.W.H. Smyrl, J.O.M. Bockris, B.E.Conway, E. Yeager and R.E. White (Eds.), Comprehensive Treatise of Electrochemistry, Plenum Press, New York, 4 (1981) 116.
15.M. El–Achouri, S. Kertit, H.M. Gouttaya, B. Nciri, Y. Bensouda, L. Pere, M. Rinfante and K. Elkacemi, Prog. Org. Coat., 43 (2001) 267.
16.J.R. Macdonald, W.B. Johanson, J.R. Macdonald (Ed.), John Wiley& Sons, Fundamentals of impedance spectroscopy, book chapter 1, New York (1987) 1.
17.S.F. Mertens, C. Xhoffer, B.C. Decooman and E. Temmerman, Corrosion, 53 (1997) 381. 18.M. Lagrenée, B. Mernari, M. Bouanis, M. Traisnel and F. Bentiss, Corros. Sci., 44 (2002) 573. 19.F. Bentiss, M. Lagrenée, and M. Traisnel, Corrosion, 56 (2000) 733.
20.E. Kus and F. Mansfeld, Corros. Sci., 48 (2006) 965.
21.D.Q. Zhang, Q.R. Cai, X.M. He, L.X. Gao and G.S. Kim, Mater. Chem. Phys., 114 (2009) 612. 22.M.P. Chakravarthy, K.N. and C.P. Kumar, Int. J. Ind. Chem., 5(2) (2014) 19.
23.A.S. Fouda, W.M. Mahmoud and K.M. A. Elawayeb, Protection of Metals and Physical Chemistry of Surfaces, 53(1) (2017) 13.
24.S.H. Etaiw, M.M. El-bendary, A.S. Fouda and M.M. Maher, Protection of Metals and Physical Chemistry of Surfaces, 53(5) (2017) 937.
25.A.S. Fouda, R.M. Abou Shahba, A.E. EL-Shenawy and T.J.A. Seyam, Chem. Sci. Trans., 7(2) (2018) 1.
26.S.T. Arab and E.A. Noor, Corrosion, 49 (1993) 122.
27.W. Durnie, R.D. Marco, A. Jefferson and B. Kinsella, J. Electrochem. Soc., 146 (1999) 1751. 28.M.K. Gomma and M.H. Wahdan, Mater. Chem. Phys., 39 (1995) 209.
29.E. Khamis, Corrosion, 46 (1990) 476.
30.A.S. Fouda, A.M. El-desoky and A. Nabih, Advances in Materials and Corrosion, 2 (2013) 9. 31.A.N. Frumkin, Zeitschrift für Physikalische Chemie, 116 (1925) 466.
33.L. Tang, X. Li, Y. Si, G. Mu and G. Liu, Mater. Chem. Phys., 95 (2006) 29. 34.A.K. Maayta and N.A.F. Al-Rawashdeh, Corros. Sci., 46 (2004) 1129.
35.S.S. Abd El-Rehim, S.A.M. Refaey, F. Taha, M.B. Saleh and R.A. Ahmed, J. Appl. Electrochem., (2001) 429.
36.A.S. Fouda, D. Mekkia and A.H. Badr, J. Korean Chem. Soc., 57 (2013) 264. 37.X. Li and G. Mu, Appl. Surf. Sci., 252 (2005) 1254.
38.G. Mu, X. Li and G. Liu, Corros. Sci., 47 (2005) 1932.
39.B. Wang, M. Du, J. Zang and C.J. Gao, Corros. Sci., 53 (2011) 353.
40.S. Rajendran, C. Thangavelu and G. Annamalai, J. Chem. Pharm. Res., 4 (2012) 4836. 41.A.S. Fouda, Y.M. Abdallah and D. Nabil, IJIRSET, 3 (2014) 12965.
42.Y.Y. Enriadi and N.J. Gunawarman, BCES, 14 (2014) 15. 43.J.M. Costa and J.M. Liuch, J. Corros. Sci., 24 (1984) 929. 44.C. Lee, W. Yang and R.G. Parr, Phys. Rev. B, 37 (1988) 785. 45.L.R. Chauhan and G. Gunasekaran, Corros. Sci., 49 (2007) 1143.
46.H. Ashassi-Sorkhabi, B. Shaabani and D. Seifzadeh, Appl. Surf. Sci., 239 (2005) 154.


![Table 7. The enthalpy of a chemisorption process reached (100 kJ mol-1) [26, 27]. The rise in the (ΔH*)](https://thumb-us.123doks.com/thumbv2/123dok_us/1787156.132974/12.596.124.472.69.374/table-enthalpy-chemisorption-process-reached-mol-rise-dh.webp)