Int. J. Electrochem. Sci., 13 (2018) 9385 – 9398, doi: 10.20964/2018.10.56
International Journal of
ELECTROCHEMICAL
SCIENCE
www.electrochemsci.org
Safety Insight of Li(Ni
0.5Co
0.2Mn
0.3)O
2Based Lithium Ion
Batteries with Gel Electrolyte
Siyuan Wang1, Li Wang1 ,*, Yuming Shang1, Siqi Zheng1, Guangyu Tian2, Xiangming He1,2
1
Institute of Nuclear and New Energy Technology, Tsinghua University, Beijing, 100084, China. 2
State Key Laboratory of Automotive Safety and Energy, Tsinghua University, Beijing, 100084, China
*E-mail: wang-l@tsinghua.edu.cn
Received: 6 June 2018 / Accepted: 29 July 2018 / Published: 1 September 2018
Safety is a crucial issue for large format lithium ion batteries. In this study, an attempt of thermal analysis is tried to know why the gel electrolyte is safer by understanding more about the thermal characteristics of the gel electrolyte battery and insight reason of safety enhancement. The extended volume-accelerating rate calorimetry (EV-ARC) is applied to evaluate the thermal stability of MCMB (mesoCarbon microBeads) | electrolyte | Li(Ni0.5Co0.2Mn0.3)O2 batteries with gel electrolyte, and the battery with conventional electrolyte. The results indicate that the gel electrolyte delays the onset temperature of self-heating from 67°C to 135°C, and the onset temperature of thermal runaway from 195°C to 272°C, leading to large enhancement of the safety of the battery. The polymer of gel electrolyte shifts the temperature range of heat absorption from mainly before 180°C to higher temperature. The polymer from gel electrolyte can transform into a rigid film gradually during solvent evaporation, which prevents the polyolefin separator from shrinkage at temperatures below 225°C and thus avoids short circuit. This investigation demonstrates the confirmation of safety enhancement of gel electrolyte by thermal stability analysis. The gel electrolyte is a reasonable way towards safer LIBs.
Keywords: Lithium ion batteries; Safety; Gel electrolyte; Thermal runaway; Accelerating Rate Calorimeter.
1. INTRODUCTION
Application of lithium ion batteries (LIBs) in the fields of electric vehicles (EVs) and stationary energy storage has been a research hotspot in response to the serious environmental problems and energy crisis. However, increasing burning and even explosion accidents of EVs due to LIBs hurt consumers’ confidence, so safety is a bottle-neck issue for the large scale application of lithium ion batteries in EVs.
so its evolution process and features are important to evaluate the thermal safety of lithium ion batteries[1-4]. Feng et al.[5] analysed the thermal runaway process in detail and divided it into six stages, including SEI decomposition, the deintercalation of Li+ ion from anode at high temperature (that is the reaction between anode and electrolyte because of SEI decomposition), separator melting, internal short-circuit, decomposition of cathode and electrolyte oxidation, and the reactions between anode and cathode. The battery releases energy instantly and fiercely when short circuit occurs and then its temperature rockets up. Thus, it is remarkable that electrolyte and separator play significant roles in thermal runaway process, as the reactions after SEI decomposition are all closely linked with them[6].
To improve the thermal safety of LIBs, gel electrolytes are considered to be effective to solve the problems of liquid electrolytes, such as leakage and flaming. For gel electrolytes, which is a kind of semi-solid electrolytes consisting of polymer matrix and liquid electrolyte, the polymer matrix generally builds three-dimensional structure and thus locks liquid electrolyte therein[7, 8]. When the polymers are selected to be thermally, chemically and physically stable, gel electrolyte will be non-flammable, without liquid leakage and enable batteries to work well[9].
The poly(methyl methacrylate) (PMMA) based gel electrolyte has good electrochemical stability with the metal lithium electrode and low interfacial impedance. In addition, the interaction between of the carbonyl (-CO-) side groups in MMA units and the oxygen atoms in carbonate electrolyte is strong, which makes the PMMA based gel electrolyte have the ability to hold a large number of liquid electrolytes[10]. At present, PMMA based gel electrolytes have been applied on LIBs and many researches have been carried out to further improve the performance of the PMMA based gel electrolyte.
Arora et al.[11] prepared poly(methyl methacrylate) (PMMA) based gel electrolytes containing nano-dispersed silica, LiBF4 and binary solvent mixtures with the ratio of propylene carbonate and N,N-dimethylformamide (PC:DMF) is 1:1, which showed the maximum ionic conductivity of 9.4 mS·cm-1 at 25 °C. Xiao et al.[12] fabricated a sandwiched polymer membrane with two outer layers of poly(vinyl difluoride) (PVdF) and one inner layer of PMMA. The membrane presents a good property of elongation for the fracture strain of the membrane is much larger than that of the pure PMMA film. Gwon et al.[13] prepared PMMA-grafted polyethylene (PE) separators which showed an oxidation stability on the lithium metal up to 5 V. Fu et al.[14] found that the PVdF/PMMA/SiO2 composite membrane retained their original dimensions after heat treatment at 150°C for 1 hour. Wang et al.[15] analysed the methyl methacrylate (MMA)-maleic anhydride (MAh) copolymer by TGA. The result showed that the thermal degradation temperature is 300°C.
2. EXPERIMENT
2.1 Cell preparation
Type 1 and Type 2 cells were measured in this study, and they used dry cells of the same electrodes. In detail, the dry cells were MCMB| separator | Li(Ni0.5Co0.2Mn0.3)O2 (NCM523), and the separator is PE-base separator with Al2O3 ceramic coating (12μm PE+2μm Al2O3 oneach side, MTI Corporation). Type 1 cells were filled with commercial liquid electrolyte (1M LiPF6 in EC/ DMC/ EMC= 1: 1: 1, v/v, BLE-201, purchased from Beijing institute of Chemical Reagent (BICR), and used without any treatment). Type 2 cells were filled with gel electrolyte (purchased from BICR). The design capacity of Type 1 and Type 2 cells are both 5 Ah.
The gel electrolyte was composed of liquid electrolyte (1M LiPF6 in EC/ DMC/ EMC= 1: 1: 1, v/v, BLE-201 by BICR), monomers (MMA), polymerization initiator (AIBN) and additive agents. The electrolyte with 20%wt MMA was labelled as solution A, and the electrolyte with 0.2%wt AIBN was labelled solution B. The cell assembly was carried out in a glove box. The solution A and B were mixed in a mass ratio of 1:1, injected into the dry cell with suitable amount. Then the cells were sealed, kept at room temperature for 24 hours, and followed with standing at 60°C for 12 hours. Specifically, settling the batteries at room temperature for 24 hours was to ensure full accessibility of mixture solution into porous electrode and separator, and the following standing at 60°C was to complete the process of initiate polymerization and gelatinization. All the cell samples containing gel electrolyte or commercial liquid electrolyte were all settled for 24 hours in glove box before the test.
[image:3.596.110.491.570.641.2]Fig.1 shows the mechanism of polymerization and gelatinization process. It is free radical polymerization with three steps, including chain initiation, chain propagation and chain termination. The AIBN decomposes and generates free radicals when temperature higher than 50°C, then MMA monomers are initiated and in-situ polymerized. Meanwhile, the liquid electrolyte is blocked by the three-dimensional polymer matrix and gel electrolyte forms.
Figure 1. The mechanism of polymerization and gelatinization process
kept at room temperature for 12 hours before the EV-ARC test.
2.2 The EV-ARC test
EV-ARC (Thermal Hazard Technology (THT), UK), which can provide the information of the thermal characteristics of LIBs during thermal runaway process, was used to analyse the thermal stability of LIBs. The experimental process could be described as heat-wait-seek[6, 16]. Firstly, the EV-ARC heated the sample with a constant heating rate till the temperature reached the fixed temperature, and then kept waiting for 30 minutes. During the waiting period, if the temperature rising rate caused by self-heating was lower than 0.02 °C·min-1, EV-ARC would come back to the step of heating after waiting process. Otherwise, it would switch to the exothermic mode, keeping the temperature of the chamber identical with the test sample (maximum heating rate is 10°C·min-1), thereby creating an adiabatic condition for the test.
[image:4.596.172.426.447.739.2]During the measurement, two identical cells were tied up, with thermal couples inserted between them, in order to measure the pseudo-internal centre temperature of the cells, as shown in Fig.2. There were also thermal couples fixed on the surface of the cells by high temperature adhesive tape to measure the surface temperature. According to the data, pseudo-internal centre temperature is always higher than the surface temperature. Considering the possible heat dissipation on battery surface during thermal runaway, only pseudo-internal centre temperature is used in the following discussion. All of the test cells were charged to 100% SOC before EV-ARC test. The resistance and voltage information of the samples was recorded by HIOKI BT3562.
samples. (b) The photograph of authentic battery samples.
2.3 Characterizations of electrolyte and separator
To insight the reason of safety enhancement by using gel electrolyte, characterizations of electrolyte and separator were carried out.
Sample A-E, which represented the plain separator, normal liquid electrolyte, separator with normal liquid electrolyte, gel electrolyte, and separator with gel electrolyte, respectively, were put in the containers (which are the cathode shells for 2032 batteries) and heated from 20 °C to 350 °C by hot plate (JF-956) to study variations of electrolytes and separators with temperature rising. Changes of Sample A-E during heating were recorded by photos. The samples were also evaluated by DSC-TGA (STA 409 PC, NETZSCH), heated from 20 °C to 600 °C with a constant rate of 20 °C·min-1. All the samples were prepared and tested in an argon atmosphere.
Gel electrolyte samples were heated to different temperatures, which were 60°C, 170°C, 225°C, 250°C and 290°C respectively. The morphology of the gel electrolyte samples heated to different temperatures are examined by scanning electron microscope (SEM, FEI Quanta 200 FEG) with EDS. Large field detector is used to examine the samples without surface coating treatment in the coarse vacuum condition of 80 Pa. And the samples after treatment at different temperatures were also investigated by FTIR spectra (VERTEX 70, Bruker). Before the experiment, gel electrolyte samples were coated on Al foils and accomplished the gelation process, then they were heated to the fixed temperature. The as-heated samples were labelled as Gel60, Gel170, Gel225, Gel250 and Gel290, which represented gel electrolyte heated to 60°C, 170°C, 225°C, 250°C and 290°C, respectively.
3. RESULTS AND DISCUSSION
3.1 EV-ARC test results
(d) the comparison of temperature of self-heating and thermal runaway. The onset temperature (T1) of self-heating is increased from 67°C to 135°C, and the thermal runaway onset temperature (T2) is increased from 195.4°C to 272°C when the gel electrolyte is applied.
The characteristic temperature, T1, T2 and T3, are the signals of different stages during thermal runaway process. T1 is the temperature where self-heating can be detected. When temperature reaches T1, ARC stops heating the cells and the temperature rising is only caused by the self-exothermic heat of the cells. T2 is the temperature when thermal runaway occurs, where the temperature rising rate reaches 1°C·s-1. And T
3 is the maximum temperature that the cells can reach during thermal runaway.
The variation of temperature rising rate and resistance of the cells vs. temperature are shown in Fig. 3. According to Fig. 3 (a), the thermal runaway process of type 1 cells can be described as two stages.
Stage I: T1 is about 67°C, and it is the onset temperature of stage I. As it is widely accepted that for LIBs, self-heating is mainly caused by SEI decomposition, which further causes the anode materials exposure to the liquid electrolytes[17, 18]. The reactions between lithiated anode active materials and liquid electrolyte release heat, make the energy accumulation and cause rise of temperature[19, 20]. Continuous rising in temperature accelerate the reactions between anode and electrolyte, leading to further temperature rising and even volatilization of liquid electrolyte. Consequently, continuous decrease in ionic conductivity and increase in resistance can be observed before the temperature reaches 170°C. And it is generally believed that the little drop in resistance before 195.4°C is caused by micro short circuit due to separator melting[5].
Stage II: Characterized with T2 and featuring steep change in temperature rate and resistance, it starts at 195.4°C. With the breakup of separator, fierce short circuit occurs as the resistance dropping to 0 Ω. Great energy are released instantly due to reactions including the decomposition of NCM cathode materials[21, 22], electrolytes[23, 24] and PVDF[17, 25]. The fast energy release makes the temperature rising rate leap. The T3 of type 1 cells reaches 730°C. The total heat released can be calculated by the following equation:
ΔH = m · Cp · (T3 - T1)
where ΔH is the total heat released during the ARC test, Cp = 1.1 ×10³ J·kg-1·K-1 is the specific heat capacity of the tested cell, m = 150g is the mass of a single cell before the experiment. Then the total heat released in type 1 cell is 109.4 kJ.
Similar to type 1 cells, the thermal runaway process of type 2 cells shown in Fig. 3 (b) can also be divided into two stages.
Stage I: It starts at T1 = 135°C, where self-heating can be detected. It can be inferred that the self-heating temperatures of type 1 and type 2 cells are different, indicative of their different SEI layers. Here, most of the heat in this stage comes from SEI decomposition and the reactions between lithiated anode and the gel electrolyte.
separator with normal liquid electrolyte. In addition, most of the heat generation in this stage is from the reactions between cathode, anode, and electrolyte. The T3 of type 2 cells is 908°C and the total heat released is 127.5 kJ. It seems that the total heat released by type 2 cells is a little higher than that released by type 1 cells. Considering of the following two reasons, the difference in total heat release may not be meaningful for safety evaluation. On one hand, the gel polymer and additives can also release heat by oxidation during thermal runaway. On the other hand, T3 is in fact lower than the real battery temperature due to battery expansion, and it is understandable that more severe thermal runway leads to larger deviation of T3 from the actual temperature.
The temperature vs. time curves are shown in Fig.3(c). Self-heating is detected at 67°C for type1 cell. This shows that the thermal stability of the MCMB| electrolyte | Li(Ni0.5Co0.2Mn0.3)O2 (NCM523) cell with normal liquid electrolyte at 100% SOC is below 67°C. This temperature is very close to the up limits of operation temperature, which normally is 60°C. Anyway, the cell temperature is easily over 60°C during operation, e.g., high-rate charge/discharge, or a charged car is at standstill under sun exposure in hot weather. In these cases, shortly afterwards, the cell temperature can reach the temperature (195.4°C) of thermal runaway by its inner heat generation. However, self-heating is detected up to 135°C for type 2 cell. This indicates that the thermal stability of the MCMB| electrolyte | Li(Ni0.5Co0.2Mn0.3)O2 (NCM523) cell with gel electrolyte at 100% SOC is up to 135°C. This temperature is much higher than 67°C. And this temperature cannot be easily reached under normal conditions. Besides, the thermal runaway temperature (T2) is increased from 195.4°C to 272°C when the gel electrolyte is applied, as shown in Fig.3(c). It means that type 2 cell with gel electrolyte is safe under 272°C, while the type 1 cell with normal liquid electrolyte is safe only under 195.4°C. It concludes that the gel electrolyte largely enhances the safety of the MCMB| electrolyte | Li(Ni0.5Co0.2Mn0.3)O2 (NCM523) cell.
The characteristic temperatures of the two types of cells during thermal runaway are summarized in Fig.3(d). As there is little difference between the total heat released by the two type of cells, the thermal runaway onset temperature is crucial for the safety of lithium ion batteries. Thus, by comparison of the distinction in T1 and T2 between the two types of batteries, it can be proved directly that batteries with gel electrolytes are much safer than normal liquid electrolyte lithium ion batteries.
Figure 4. the snapshots of samples at different temperatures during heating. The gel electrolyte helps the separator against shrinkage even when the temperature is higher than 250°C. By contrast, the normal liquid electrolyte turns into white powders sticking on the ware, and the separator soaked with liquid electrolyte shrinks to only 1/5 the area of the pristine separator.
To understand more about the safety enhancement by gel electrolyte, the shrinkage of the separator with gel electrolyte at different temperature is tested. Fig. 4 shows the appearance variations of samples at different temperatures during heating from room temperature to 350°C. Unlike Sample A (separator with ceramic coating) and Sample C (separator with normal liquid electrolyte) which begins to curl and shrink under 140°C, Sample D (gel electrolyte) and Sample E (separator with gel electrolyte) keeps stable without obvious variation below 150°C. It can be observed that the Sample D turns to be milky when the temperature rises from 160°C to 200°C, indicative of lithium salt precipitation. Then it turns yellow and later becomes black from 210°C to 270°C, the gradual decomposition of the polymer may be responsible for this phenomena[26, 27]. Meanwhile, it can be observed that the film blisters (which can be observed more clearly in Sample E) as the polymer matrix cannot bound the volatilized liquid. The lithium salts start to precipitate at 280°C, and cracks generate as a result of slight shrinkage at high temperature. The variation of Sample E during temperature rising is similar to that of Sample D. The only difference is the colour of Sample E is darker than Sample D. Since there is an extra PE-based separator in Sample E and it makes Sample E not that transparent, the difference in colour is understandable.
From the pictures of Sample D and Sample E at 350°C, it can be observed that both the gel electrolyte and the separator with gel electrolyte show obvious cracks especially in the edge area, but they both are still self-standing films and cover most of the original area, indicating that the gel electrolyte helps the separator against shrinkage even when the temperature is higher than 250°C and in this way reduces the degree of internal short circuit. By contrast, the normal liquid electrolyte turns into white powders sticking on the ware, and the separator soaked with liquid electrolyte shrinks to only 1/5 the area of the pristine separator.
Above analysis indicates that the polymer matrix of gel electrolyte can stand by and support separator from shrinkage at high temperature. Less shrinkage leads to less short circuit. Thus, the safety of the cell is enhanced. The rigid film formed at high temperature by gel electrolyte is the main reason for making LIBs safer.
3.3 DSC/TGA analysis on separator and electrolytes
centring at about 252.8°C and starting at about 64.3°C, with a heat absorption of 491.1J·g-1 (83.4 J·g-1 before 180°C and 407.7 J·g-1 after 180°C). The mass loss of gel electrolytes mainly concentrates in the temperature range from 180°C to 280°C. According to the comparison between Sample B and Sample D, it is obvious that gel electrolyte is more stable than normal liquid electrolytes. And it can be inferred that the gel electrolyte can inhibit the volatilization of the solvent in liquid electrolytes.
[image:9.596.182.415.184.734.2]
electrolyte). (b) The DSC comparison of Sample A (separator), Sample C (separator with normal liquid electrolyte) and Sample E (separator with gel electrolyte). (c) The comparison of heat absorption at low temperature below 180°C and high temperature over 180°C. The gel electrolyte is more stable before 180°C. The polymer matrix of gel electrolyte can fix the liquid electrolyte and limits the volatilization of the flammable solvents.
DSC curves of Sample A (separator), Sample C (separator with normal liquid electrolyte) and Sample E (separator with gel electrolyte) are exhibited in Fig 5(b). The plain separator shows an endothermic peak at about 152.1°C with a heat absorption of 172 J·g-1 (170.6 J·g-1 before 180°C and 1.4 J·g-1 after 180°C), corresponding to the melting process of PE[29]. Compared with the DSC curve of normal liquid electrolyte, the endothermic peak for solvent volatilization and PE melting may be coincident, which is confirmed by the DSC curve of Sample C. Sample C presents two endothermic peaks at 160.4°C and 247.1°C, with an onset at about 54.6°C, and the total heat is about 306.9 J·g-1 (219.8 J·g-1 before 180°C and 87.1 J·g-1 after 180°C). The first endothermic peak of Sample C is at 160.4°C, which may be due to the volatilization of DMC and EMC as well as PE melting, while the second one is caused by EC volatilization and LiPF6 decomposition. For Sample E, there are also two endothermic peaks with an onset at about 120°C. The first one at 145.7°C corresponds with separator melting according to Sample D, and the second one can be attributed to solvent volatilization, LiPF6 decomposition, and complicated reactions happened on the gel polymer. The heat is calculated to be 401.9 J·g-1 (72.8 J·g-1 before 180°C and 329.1 J·g-1 after 180°C). The thermal properties of the two type electrolytes may also cause difference in the total heat between Type1 and Type2 cells.
In detailed analysis, if a line is set at 180°C, TGA results shows that the data of mass loss are 31.43% and 57.16% for gel electrolyte and liquid electrolyte, respectively, before 180°C, as shown in Fig.5(a). It indicates that the gel electrolyte is more stable before 180°C. The heat behaviours are summarized in Fig.5(c). Comparing Sample B and Sample D, the liquid electrolyte gives 59.5% of heat absorption before 180°C, while the gel electrolyte gives 17.0% heat absorption before 180°C. Comparing Sample A, C and E, the separator and the separator with liquid electrolyte gives 99.2% and 71.6% of heat absorption, respectively, before 180°C, while the separator with gel electrolyte gives 18.1% heat absorption before 180°C. This shows that the gel electrolyte makes the electrolyte more stable before 180°C, indicating that the polymer matrix of gel electrolyte has fixed the liquid electrolyte and limits the volatilization of the flammable solvents. This is the second reason for gel electrolyte making LIBs safer.
3.4 The variations in morphology and composition of gel electrolyte with temperature rising
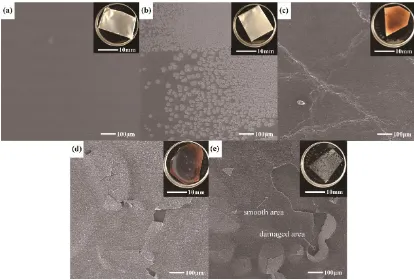
[image:11.596.89.503.221.501.2]
salt particles segregate obviously but the gel electrolyte film is still flat. Fig. 6(c) shows the film turns to be yellow and brown in appearance, the segregated lithium salt particles disappear and there are micro cracks after heat treatment at 225°C. When the temperature rises to 250°C and 290°C, as shown in Fig. 6(d) and (e), the gel electrolyte film becomes darker in colour and finally turns into black and fractured. Though the gel electrolyte film experiences great changes and are not uniform both in colour and in morphology after heat treatment at 290°C, the damaged area and the smooth area of the film show similar aluminium content according to the EDS result in Table 1. This indicates that there are no perforations in damaged area, otherwise Al content would be very high.
Figure 6. The photos (the inserts in up-right corner) and SEM images of the gel electrolyte on Al foil heated to 60°C, 170°C, 225°C, 250°C and 290°C respectively. (a) to (e) are the samples stop at different temperatures, which are named as Gel60, Gel170, Gel225, Gel250 and Gel290, respectively. The gel electrolyte is thermal stable up to 225°C. The carbon element can be detected both in the damaged area and smooth area, indicating that the polymer from gel electrolyte can be a film as separator up to 290°C. It can prevent the cell from short circuit.
Table 1. The elemental composition of the damaged area and the smooth area of Gel290 by EDS
element C O F Al Si P
mol% at the damaged area 16.29 10.72 67.05 0.90 1.99 3.05
mol% at the smooth area 11.68 6.42 78.62 0.76 1.86 0.65
[image:11.596.47.553.642.725.2]
reason of internal short circuits. As macro cracks can be observed in photos but no cracks in SEM images, it can be inferred that fracture happens rather in a few areas than throughout the whole gel electrolyte film, which proves that most part of the rigid film can play a role in reducing the degree of internal short circuit. Moreover, the carbon element can be detected both in the damaged area and smooth area, indicating that the polymer from gel electrolyte forms a dimensionally stable film up to 290°C. It can prevent the cell from short circuit. This is the third reason for the gel electrolyte making battery safer.
[image:12.596.177.421.381.573.2]Further investigation is made to confirm the stability of gel electrolyte at high temperature. FTIR analysis of gel electrolyte at different temperature is shown in Fig.7. It can be observed that the peak positions are basically the same, while the peak intensity decreases with the increase of temperature, especially when the temperature is higher than 225°C. In detail, the peaks at 1082 cm-1 and 1193 cm-1 refer to C–O–C stretching, the peak at 1766 cm-1 refers to C=O stretching, and the peaks at 3003 cm- 1 and 2937 cm-1 can be attributed to methyl and methylene, respectively. Most of the peaks are the characteristic FTIR signal of PMMA. As only peak intensity decreases with temperature rising, it can be concluded that PMMA matrix, which the bone of the gel electrolyte, does not change greatly until the temperature is higher than 225°C, where PMMA pyrolysis. So the film changes colour from colourless to brown and black may be caused by the decomposition of PMMA in gel electrolyte.
Figure 7. The FT-IR result of the gel electrolyte heated to different temperature. The decomposition of the polymer in gel electrolyte occurs over 225°C.
4. CONCLUSIONS
272°C, which are nearly 70 and 80°C higher than those of the cell with normal liquid electrolyte. These indicate that the gel electrolyte largely enhances the safety of lithium ion batteries. The following evidences imply the main reasons why the gel electrolyte makes battery safer.
(1) Real-time observation on separator shrinkage indicates that the polymer matrix of gel electrolyte can stand by and support separator from shrinkage at high temperature, which enhances the safety of the battery.
(2) DSC/TGA analysis indicates that the polymer matrix of gel electrolyte can fix the liquid electrolyte and shift the volatilization of the flammable solvents from below 180°C to higher than 180°C.
(3) Thermal stability analysis proves that the gel electrolyte is thermally stable up to 225°C. The polymer from gel electrolyte can form a dimensionally stable film up to 290°C. It can prevent the cell from short circuit.
In another word, the thermal runaway onset temperature of gel electrolyte batteries is nearly 80°C higher than normal electrolyte batteries. Because the polymer matrix of gel electrolyte has fixed the liquid electrolyte and limits the volatilization of the flammable solvents under around 180°C. Meanwhile, the mechanical strength of the gel electrolyte provides a constraining force to improve the shrinkage of separator. As a result, the separator with gel can endure a higher temperature to avoid the contact between cathode and anode. This study discloses the role of gel electrolyte during thermal runway process of LIBs, which indicates a reasonable way towards safer LIBs.
ACKNOWLEDGEMENTS
This work is supported by the MOST (Grant No. 2016YFE0102200) and the NSFC (Grant No. U1564205).
References
1. R. Spotnitz, J. Franklin, Journal of Power Sources, 113 (2003) 81-100.
2. T.M. Bandhauer, S. Garimella, T.F. Fuller, Journal of the Electrochemical Society, 158 (2011) R1-R25.
3. D. Lisbona, T. Snee, Process Safety and Environmental Protection, 89 (2011) 434-442. 4. J. Wen, Y. Yu, C. Chen, Materials Express, 2 (2012) 197-212.
5. X. Feng, M. Fang, X. He, M. Ouyang, L. Lu, H. Wang, M. Zhang, Journal of Power Sources, 255 (2014) 294-301.
6. S. Zheng, L. Wang, X. Feng, X. He, Journal of Power Sources, 378 (2018) 527-536. 7. J.Y. Song, Y.Y. Wang, C.C. Wan, Journal of Power Sources, 77 (1999) 183-197. 8. A.M. Stephan, European Polymer Journal, 42 (2006) 21-42.
9. K. Murata, Electrochimica Acta, 40 (1995) 2177-2184.
10. N.H. Idris, M.M. Rahman, J.Z. Wang, H.K. Liu, Journal of Power Sources, 201 (2012) 294-300. 11. N. Arora, S. Singh, R. Kumar, R. Kumar, A. Kumari, Solid State Ion., 317 (2018) 175-182. 12. Q.Z. Xiao, Z.H. Li, D.S. Gao, H.L. Zhang, J. Membr. Sci., 326 (2009) 260-264.
13. S.J. Gwon, J.H. Choi, J.Y. Sohn, Y.M. Lim, Y.C. Nho, Y.E. Ihm, J. Ind. Eng. Chem., 15 (2009) 748-751.
15. S.H. Wang, H.X. Yan, X.Y. Ma, Y. Huang, Acta Polym. Sin., (2008) 442-447.
16. T.H. Technology, The Accelerating Rate Calorimeter (EV-ARC) Operations Manual Version 1, 2010.
17. H. Maleki, G.P. Deng, A. Anani, J. Howard, Journal of the Electrochemical Society, 146 (1999) 3224-3229.
18. X.L. Yao, S. Xie, C.H. Chen, Q.S. Wang, J.H. Sun, Y.L. Li, S.X. Lu, Electrochimica Acta, 50 (2005) 4076-4081.
19. M.N. Richard, J.R. Dahn, Journal of the Electrochemical Society, 146 (1999) 2068-2077. 20. P. Biensan, B. Simon, J.P. Peres, A. de Guibert, M. Broussely, J.M. Bodet, F. Perton, Journal of
Power Sources, 81 (1999) 906-912.
21. I. Belharouak, W.Q. Lu, D. Vissers, K. Amine, Electrochemistry Communications, 8 (2006) 329-335.
22. H. Wang, A. Tang, K. Huang, Chinese Journal of Chemistry, 29 (2011) 27-32.
23. S.E. Sloop, J.K. Pugh, S. Wang, J.B. Kerr, K. Kinoshita, Electrochemical and Solid State Letters, 4 (2001) A42-A44.
24. G.G. Botte, R.E. White, Z.M. Zhang, Journal of Power Sources, 97-8 (2001) 570-575.
25. A. Du Pasquier, F. Disma, T. Bowmer, A.S. Gozdz, G. Amatucci, J.M. Tarascon, Journal of the Electrochemical Society, 145 (1998) 472-477.
26. Y.H. Hu, C.Y. Chen, C.C. Wang, Polymer Degradation and Stability, 84 (2004) 545-553. 27. A. Collier, H. Wang, X.Z. Yuan, J. Zhang, D.P. Wilkinson, International Journal of Hydrogen
Energy, 31 (2006) 1838-1854.
28. H. Yang, G.V. Zhuang, P.N. Ross, Jr., Journal of Power Sources, 161 (2006) 573-579. 29. A.C.Y. Wong, F. Lam, Polymer Testing, 21 (2002) 691-696.