White Rose Research Online URL for this paper:
http://eprints.whiterose.ac.uk/142373/
Version: Accepted Version
Article:
Erhan, L., Ndubuaku, M., Ferrara, E. et al. (5 more authors) (2019) Analysing objective
and subjective data in social sciences: Implications for Smart Cities. IEEE Access. ISSN
2169-3536
https://doi.org/10.1109/access.2019.2897217
[email protected] https://eprints.whiterose.ac.uk/
Reuse
This article is distributed under the terms of the Creative Commons Attribution (CC BY) licence. This licence allows you to distribute, remix, tweak, and build upon the work, even commercially, as long as you credit the authors for the original work. More information and the full terms of the licence here:
https://creativecommons.org/licenses/
Takedown
If you consider content in White Rose Research Online to be in breach of UK law, please notify us by
Date of publication xxxx 00, 0000, date of current version xxxx 00, 0000.
Digital Object Identifier 10.1109/ACCESS.2017.DOI
Analysing objective and subjective data
in social sciences: Implications for
Smart Cities
L. ERHAN1, M. NDUBUAKU1, E. FERRARA1, M. RICHARDSON2, D. SHEFFIELD2, F.J. FERGUSON2, P. BRINDLEY3AND A. LIOTTA1
1
Data Science Research Centre, University of Derby, Derby, UK (e-mail: L.Erhan, M.Ndubuaku, E.Ferrara, [email protected])
2
Human Sciences Research Centre, University of Derby, Derby, UK (e-mail: M.Richardson, D.Sheffield, [email protected])
3
Department of Landscape Architecture, University of Sheffield, Sheffield, UK (e-mail: [email protected])
Corresponding author: L. Erhan (e-mail: [email protected]).
This work is based on data provided by the IWUN project. The IWUN project was supported by the Natural Environment Research Council, ESRC, BBSRC, AHRC & Defra [NERC grant reference number NE/N013565/1].
ABSTRACT The ease of deployment of digital technologies and the Internet of Things, gives us the opportunity to carry out large scale social studies and to collect vast amounts of data from our cities. In this work we investigate a novel way of analysing data from social sciences studies by employing machine learning and data science techniques. This enables us to maximise the insight gained from this type of studies by fusing both objective (sensor information) and subjective data (direct input from the users). The pilot study is concerned with better understanding the interactions between citizens and urban green spaces. A field experiment was carried out in Sheffield, UK, involving 1870 participants for two different time periods (7 and 30 days). With the help of a smartphone app, both objective and subjective data was collected. Location tracking was recorded as people entered any of the publicly accessible green spaces. This was complemented by textual and photographic information that users could insert spontaneously or when prompted (when entering a green space). By employing data science and machine learning techniques, we identify the main features observed by the citizens through both text and images. Furthermore, we analyse the time spent by people in parks, as well as the top interaction areas. The study allows us to gain an overview about certain patterns and the behaviour of the citizens within their surroundings and it proves the capabilities of integrating technology into large-scale social studies.
INDEX TERMS Data analysis, data science, smart cities, social science, urban analytics, urban planning.
I. INTRODUCTION
T
HE advancements in technology and the digitalisation of the physical world, allows the Internet of Things (IoT) to encourage a variety of multidisciplinary studies, part of which focuses on the human interaction with cyber-physical systems [1]. This is due to the desire of harmon-ising the interaction between society and the smart things. Furthermore, a paradigm focusing on the social side of IoT emerges [2]. The Internet of Things vision for a Smart City employs advanced technologies to foster the administration of cities with the aim of providing better utilization of public infrastructure, improved quality of service to the citizens, while operating at minimal administrative budget [3]. The end goal is to create an integrated approach for managing and analysing the data to help in planning, policy, and decisionpatterns, and make correlations in a way that may not be easily identified with traditional statistical tools. Further-more, by taking advantage of the increase in technology use, besides the subjective data directly collected from the study participants, objective data can also be obtained (as recorded by sensors in the used devices).
This pilot study is concerned with better understanding the interaction of citizens with green spaces and improving well-being through engaging with urban nature. The insights from these interactions can be used to help stakeholders in planning, policy and decision making, in addition to improve-ment of the citizens’ experience and life quality. The study involved tracking 1,870 subjects for two different periods (7 and 30 days), covering 760 digitally geo-fenced green spaces in Sheffield, UK. To collect data, we used Shmapped, a smartphone app developed by the IWUN project [6], which allows measuring the human experience of city living. The app serves as a dual data-collection tool for both subjective data (well-being, personal feelings, type of social interaction, the users’ observations about their surroundings) and objec-tive data (location tracking for when a user enters a digitally geo-fenced green space in the city and activity detection). The app is also used as an intervention tool that prompts participants to notice and record the good things in their environment, using either text or/and photographs. This is theorized to improve their well-being, as research has shown links between exposure to green space and well-being [7], [12]. Moving beyond exposure, [20] and [11] outline the benefits of improving nature connectedness through noticing the good things in nature. Such research has led to much interest in the design of smart city management frameworks for improved quality of life [13], [14]. The research in this line of interest can be a major challenge due to the complex processes involved in planning, collecting and analysing vast amounts of data. Clearly, a large-scale IoT infrastructure can improve this process by automating data collection, storage, processing and analytics [5].
We are looking at a novel model of analysing the infor-mation obtained from data driven social applications in order to maximise the insight gain. Through the use of technology, particularly smartphones, we aim at complementing the tradi-tional way of gathering data in social sciences. Furthermore, this also allows the collection of objective data (sensors’ information) which can open the study to new dimensions of analysis. Through information fusion we can find new links between a citizen’s interaction with the surrounding environment and the features of the city. This kind of study enables a smart city approach and allows for a better and accurate representation of a citizen’s interaction with the city, because users are asked for information or interrogated about their observations and behaviour in moments of action. This difference to the traditional way of gathering people to fill out a questionnaire, allows for monitoring in the moment of interaction, collecting both subjective and objective informa-tion about the specific time. For example, when users enter a geo-fenced green space, they are prompted to answer a series
of questions specific to that moment: who is accompanying them in the visit; what good things do they notice about the surroundings; how would they grade this interaction etc. Simultaneously, the location and other sensor specific information (from the accelerometer) are tracked and can be used to determine the time spent in the green space, speed etc. Furthermore, this approach allows for scaling up social studies and collecting information from multiple subjects at the same time. In a smart city scenario this can be used to monitor and improve existing infrastructure, as well as quality of life. We use several data science and machine learning techniques in order to gain insight from the data generated by the users in Sheffield, UK. First, we clean and pre-process the raw information, and then we proceed into a further analysis of the text observations, the images taken, as well as the location points. We identify the clusters of topics in the observations and we automatically map the observa-tions against the categories of themes from previous research into noticing the good things in nature [20]. We identify the features in the images taken by the users and compare the top labels with the text data. Based on the location points, we look at the time spent in the green spaces from different perspectives and compare it against the location data derived from the observations. These types of information fusion allow us to gain a better understanding of the interactions between the users and their surroundings, as well as plan the next steps for extending and improving the present work.
This paper is organised as follows: Section II gives an overview of the related work; Section III describes the meth-ods used for this work; Section IV characterizes the dataset we used; Section V outlines which features were noticed by the users; Section VI looks at the time users spent in green spaces; in Section VII an analysis of the park use based on gender and age is being done; and in Section VIII we draw the conclusions and indicate future research directions.
II. RELATED WORK
A. DATA CHALLENGES IN SOCIAL SCIENCE STUDIES
B. MINING OBJECTIVE AND SUBJECTIVE DATA
Based on the method of data collection, data could be broadly classed as objective data or subjective data. From the IoT perspective, objective data can be obtained from the things in the IoT, such as sensors, GPS receivers and smartphones, while subjective data is collected directly from humans. Technology has made it easier and faster to collect objective data, and such research can boast of large volume of data for analysis. In one such study, [26] data collected from accelerometers is used to control gaming mechanisms that encourage metabolic activities. Authors in [27] performed real-time monitoring of urban mobility (traffic conditions and movement of pedestrians) using data collected from the GPS of mobile phone users, buses and taxis. While such objective studies may perform better at collecting information faster and at a larger scale, they hardly account for the harmonious interaction between these smart objects and the humans, an important element in smart cities [21]. Again one has to deal with issues of data quality in objective data like uncertainty (sensor precision, missing readings), inconsistency and re-dundancy in data [29]. Subjective data presents the problem of being limited in volume, and diminishing in quality over time (people start a study with high response at the start and then get tired - law of diminishing returns). Social networks have made it easier and faster to collect subjective data like event tweets [30], however they tend to be noisy, messy and get thinner when filtered down to specific interests. Though the process of collecting subjective data may limit the volume for Big Data studies, it could make for richer, diverse and complementary analytics for smart cities [25].
We address the limitation and leverage the strength of the two using a hybrid data collection approach. On the one hand we collect data from GPS and sensors, and on the other, we put in the human element through text and image information collected from participants. There are similar works that have employed the concept of objective and subjective data mining. In [8] the participants are asked to report their well-being at random times during the day, whilst having their location tracked. The response of participants in the app is then correlated with the GPS and weather information. In our work we show that the text and image entries collected from participants can be harnessed in the context of smart cities to complement other modalities such as the location data from the GPS, thus providing a comprehensive view of the green space in the city.
C. APP-BASED STUDIES ON THE CONNECTION BETWEEN WELL-BEING AND NATURE
With IoT and smartphones, it is now possible to automati-cally collect much larger sample data, both subjective and objective. This is more cost-effective and involves larger datasets and, in turn, yields more statistically robust findings [22]. Mappiness [8] is a social app designed as an inter-vention tool to enhance happiness as an element of well-being. In Mappiness, participants are asked to report their well-being at random times during the day, whilst having
their location tracked. Urban Mind [9] is another social app, designed to examine how exposure to green spaces impacts mental well-being in real-time. In that study, there were seven prompts a day for assessing well-being in urban areas. The set of questions the users had to answer was dependent on their location (indoors/outdoors). In both cases, most of the collected data was done when the participants were indoors, as they only spent at most 14 percent of their time outdoors, making it challenging to collect the data in green spaces, where the reported level of happiness is actually higher. This was seen as a major limitation in these two apps. In an attempt to address this issue and optimize Shmapped for data collection, the green spaces were structured into geo-fences and the users were prompted to observe their environment upon entering one. Thus, the reliability of the study concerning the interaction with nature is improved as people are prompted to give details of their experience when in green spaces.
III. METHODS A. SHMAPPED
Given the spread of smartphones in today’s digitalised world, it is reasonable to employ apps in order to gain insight into the users’ interaction with nature. For this study the app dubbed Shmapped (Sheffield Mapped) was developed [6]. Shmapped uses a chatbot to achieve a human friendly and engaging interaction with the participants. It collects both subjective and objective data, by means of two main tools:
• The intervention tool, prompts the users to notice
some-thing good about their environment and to translate any observations into text, image or both. This prompt can also be snoozed and the users are reminded of it in the evening. In the latter case, we can assume that the users’ comments are made retrospectively rather than during the moment of interaction. Since this data is generated directly by the users, we consider it to be subjective. In the remainder, we will refer to this as the "observations" or the "comments data".
• The data collection tool tracks the participants’
move-ment whilst they are within geo-fenced green spaces. We collect the user’s GPS location and derive their ac-tivity from the device sensors. Therefore, we can discern among different users: stationary, walking, running, etc. In the remainder, we refer to this data as "objective", since no user intervention is involved.
we could establish how the participants’ well-being changed throughout the study.
B. DATA COLLECTION
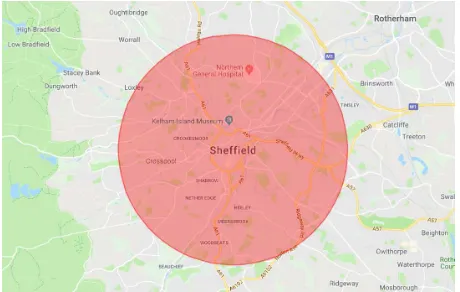
[image:5.576.60.254.239.333.2]As mentioned earlier, there are two main types of data gathered from the users: Subjective Data and Objective Data. GPS locations of participants were tracked within digital geo-fences (circular areas comprising the green spaces of interest as shown in Fig. 1), with data then being recorded once participants entered the more detailed geography of publicly accessible green spaces (provided by Sheffield City Council). The use of the geo-fences allowed phones to be woken from standby alongside more accurate GPS recording. Specific information about the data collected are:
FIGURE 1. Preview of the extracted geo-fences.
• Locations (Objective Data)
– GPS Data
Location and speed data, used to analyze the users’ dwelling time in the green spaces.
– Derived Data
Based on the information provided by sensors the app also evaluates the user activity: it creates and updates fields like is_moving and activity_type. The latter is classified in four mains categories: still, on foot, in vehicle and unknown.
• Observations (Subjective Data)
During the study, the app asks the users for input. They introduce observations about the "good things they noticed" in their surroundings. When they insert their comment, the app asks for additional information. This aims at obtaining an overview of their experience. The collected data are:
– Comment about what they noticed
– Picture (optional)
– Why they are in that place (‘whyThere’)
– With whom they spend time (‘whomWith’)
– How built-up the place is (‘howMuch’)
– How they feel in the moment (‘howFelt’)
C. DATA CLEANING AND PRE-PROCESSING
One of the first steps we had to take at the beginning of our interaction with the dataset was data cleaning. Parts of the collected data were irrelevant for the study and problem at hand. For example, there were users who registered and took part in the study but were not living in Sheffield, UK. As the
study was focused on this specific city, their data had to be filtered out.
The subjective user responses included free text, images, or a mix of both, but also controlled input such as: whom they were with, how they felt, why they went there, how built-up the environment was. The information were fused through a mix of semantic text and image analysis as well as correlating the whom, why and how.
The objective data includes mainly the location points and other sensor information, which were used as the starting point to infer things like dwelling time and type of activity.
The types of cleaning or filtering which were undertaken are shortly described below based on the category of data they belong to.
1) Users
For the study, participants were split into two categories: the green (70%) and the built (30%). The former group was prompted to notice good things about nature. The latter group recorded their observations regarding the built environment, a condition which was included by the psychology researchers as a control group. For our analysis, parts of the data were split according to the built/green criteria, with an emphasis on the green. This is due to the focus being on gaining insight in the citizens’ interaction with the natural surroundings. The total number of registered users in the app was 1870. Out of these, 580 were part of the built group and 1290 of the green group (69%). It is important to note that the numbers of unique users in the different types of analysis turned out to be lower. This is because not all people who registered went on to use the app or provide data. Furthermore, some of the users who signed up were not living in Sheffield. They were filtered out by using the postal code provided at registration.
2) Observations
4226 entries from 718 users. Location was not taken into account here as the focus was rather on classification and feature extraction. To have a better clustering performance, we filtered text to only include the green users. The data used to train the model for text classification was specifically about nature, hence it was necessary to filter out the observations which were gathered for built users. The number of images used for analysis was 1641; 1020 belonged to the green group and 621 to the built group.
3) Location points
[image:6.576.43.273.398.544.2]As mentioned earlier, users were tracked while inside green spaces. In the app, there were mapped 949 green spaces falling within 760 geo-fences. First, we filtered out location data points falling within the circular geo-fence but outside the actual green spaces. Particular attention was needed to avoid excessive filtering. For instance, people walking along the paths surrounding the green space were kept. We decided to select the location points with an associated accuracy lower than 10 meters. This means that we take into account the edge cases. The location data was used to infer the dwelling time in the green spaces. For the time analysis we restricted ourselves to green spaces contained within the 5 kilometres radius circle centered in the city center of Sheffield as shown in Fig. 2. This resulted in 539 green spaces that were analysed. This corresponds to approximately 78 square kilometres and 1184702 location points.
FIGURE 2. Study area for time analysis.
D. TEXT ANALYSIS
To have an initial understanding of the data, we performed an exploratory analysis to understand the key topics in the obser-vations. We used the K-means clustering algorithm to parti-tion the observaparti-tions into chunks of related data points based on some similarity measure such as the euclidean distance, using as parameter the number of clusters, K. This number is typically determined experimentally, aiming to satisfy a given metric such as a distortion and silhouette score. An optimal number of K clusters is chosen such that it minimizes the distortion and maximizes the silhouette. We found this to be K=40, which leads to the minimum steepness of the
distortion and silhouette. This means that the users’ entries were divided into 40 separate clusters. Next was to map the Shmapped data against earlier studies of human connection to nature conducted by [20]. This study was conducted with 65 participants who were asked to record three good things in nature each day for five days. Using an emergent coding, the information was then hand-coded into 11 themes using content analysis, a systematic technique used to code large volumes of data [33], [34]. Table 1 shows the list of themes of the training data, the description and distribution in the dataset. We used the Fasttext API [19] to train a classifier with the training data. Using the trained classifier, the model outputs the most likely labels for our observation data. As the training data are few, we train on 100,000 epochs. We recognize this as a multi-label classification problem where an input instance can be mapped to multiple output classes [28]. Hence, we extract the predicted labels alongside the probability. We set the threshold such that the predicted labels with probability below 50% are eliminated from the count. Semantic analysis as was done on social tweets in [30] does not work with our dataset because the people had been asked to notice the ‘positive’ things about their environment. So, nearly all the texts had positive sentiment except for very few outliers.
E. IMAGE ANALYSIS
When the users were prompted to insert an observation about the good things in their environment they had the option to also take a picture. The approach undertook for analysing them was object recognition. We used the Google Cloud Platform, namely the Google Cloud Vision API [18]. For each image we identified a set of associated labels and their corresponding scores. An example is provided in Table 2. Afterwards, we carried out a frequency analysis and counted all uniquely identified labels for all images, and for each of the two groups. Furthermore, we filtered the labels in order to reduce their number and lower the amount of redundant information. This was done in the following way: for each image, its set of labels was analysed; if any of the labels contained another label, the contained label was discarded; the explanation for this action is that the "shorter label" is the "parent" of the composed label. For the example in Table 2, the labels "flowering plant" and "annual plant" would be discarded after the compression. An additional frequency count was carried out. Further compressing of the resulted labels with similar meanings (e.g. ‘flower’ and ‘flora’) would be possible with specific dictionaries of words (such as WordNet) or by manual categorisation.
F. TIME ANALYSIS
TABLE 1. Labels from training data [20].
S/N Theme Description Example Distribution
1 Specific part of nature When an example of specific plant, animal or feature of nature was given with no or very little context
A bumble bee; Bluebell wood; Bright rainbow; Beach
100
2 Animals being active in
their habitat
When animals were discussed in terms of some activity in their habitat
Pigeons walking in a group together like a fam-ily; A buzzard being mobbed by crows; watch-ing 2 birds dance together; Squirrels runnwatch-ing up a tree together
109
3 Animals interacting
to-gether
Reference to animals engaging in an activity with at least one other animal such as play-ing/chasing/hunting
Pigeons walking in a group together like a fam-ily; A buzzard being mobbed by crows; watch-ing 2 birds dance together; Squirrels runnwatch-ing up a tree together
47
4 Sensation of nature Items which focus on the sensations of nature; smell, sound (including bird song) or touch.
Sun on my skin; Birds tweeting in the trees; Sound of long grass in the wind; hearing the birds singing to one another
159
5 Colour Items which had a specific emphasis on colour Bright pink blossom on the trees; The slug
that I removed from my sage plant had quite a fetching orange belly; The grass looks very green in the rain; Green on the leaves
76
6 Effect of weather on
something
When the weather has an effect on a plant or another aspect of the environment
The breeze in the trees; Sunlight streaming in through my window; The long grass on the bank if the stream had been flattened beneath the weight of the rain drops hanging from it this morning
93
7 Growth/temporal
changes
Reference to new buds, things in coming into bloom and changes associated with the seasons
The soft new leaves emerging on our beech hedge; Purple flowers starting to bloom; Bud-ding leaves on the trees outside my window at work; Regeneration across the seasons
124
8 Reflections on the
weather
Judgement/observation on the weather or a re-flection on the dynamic weather
How nice the weather was; dramatic hail storm this morning; The constantly changing weather, from rain to bright sunshine and back
72
9 Beauty/appreciation/
wonder of a particular landscape or aspect of nature
Items which refer to beauty or a specific land-scape the person appreciates. Expression of the wonder of nature or the resilience and diversity of nature
The beauty of a magnolia tree in someones garden; Mist shrouding the trees first thing in the morning; Cow parsley in the grass verge lining the road for miles on my way home
98
10 Good feelings Reference to nature creating positive feelings or
state of mind
Walking by the brook at university was very peaceful; The sun was shining, walked past the park, everyone was smiling:); However I could hear the dawn chorus through my open bedroom windows and it immediately lightened my mood
40
11 Other Statements that didn’t fit into themes but didn’t
form a theme of their own
A nice house made of wood. The beautiful wood texture and its functions are so great; The threat of rain in the air
20
if two consecutive recorded points in a day were created within a time limit of five minutes. We assumed that if two consecutive location points are farther apart in time, it would be erroneous to consider that the user spent the time there. This is because while in a green space, a user’s location should be continuously recorded within a small time span. Furthermore, some parks are very small and the crossing time is very low, requiring a threshold for the minimum time distance between two consecutive location points. An example for this is Dial Way Garden depicted in Fig. 3 covering an area of 37 square meters. The five minutes imposed check helps us in correctly discriminating the user presence in the determined park. We consider the points satisfying the imposed condition relevant. Based on that, we increase associated counters that take notice of the time spent by the user inside that area, the number of visits inside the different parks and the number of days in which the users were tracked. The procedure is repeated for every user inside
all the considered areas. It enabled us to obtain the data for all the time spent. After this phase, we grouped and filtered that data to obtain different overviews, such as the total time spent by users in the different areas, the parks with the most time spent inside etc.
IV. DATASET CHARACTERISATION
In this section we provide an overview of the dataset. We compiled this based on the demographic information pro-vided by the users when registering.
A. PARTICIPANTS’ DESCRIPTION
TABLE 2. Example of labeling for an image.
Image example Labels
plant: 0.98 flower: 0.96 flowering plant: 0.89 flora: 0.79
[image:8.576.38.287.78.498.2]garden: 0.77 shrub: 0.75 annual plant: 0.69 herb: 0.67 groundcover: 0.65 yard: 0.59
FIGURE 3. Dial Way Garden: one of the smallest green spaces taken into account in the study.
[image:8.576.313.521.394.589.2]noticed that the young people group was considerably larger, possibly due to a greater digital engagement of this category. To reduce the bias across categories, we have normalised all results, so as to achieve directly comparable results.
TABLE 3. Gender distribution.
Gender Number of users Percentage
Female 894 64.64%
Male 489 35.36%
Table 3 illustrates the gender distribution of the partici-pants. Again, in the carried analysis the results were nor-malised as to have a fair comparison between the two cat-egories.
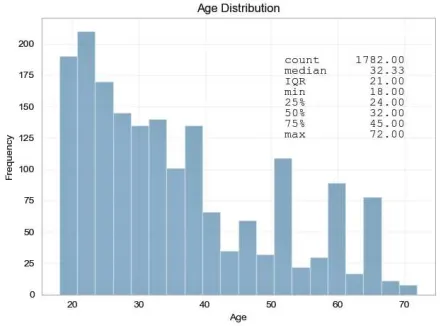
FIGURE 4. Age distribution of the sample dataset.
B. PARTICIPANTS’ INTERACTION WITH SHMAPPED
One of the questions the users had to answer when prompted was ‘who they were with’. Overall, 5626 entries were taken into consideration. The distribution of social interaction types is shown in Fig. 5. It is indicating that the majority of participants were either alone or with ‘friends & family’. The group ‘Other’ comprises also free-text responses or a multiple selection. The most common multiple selection was ‘with friends, family or partner’ and ‘pet’.
FIGURE 5. Participants’ companionship / social interactions.
[image:8.576.82.231.626.655.2]FIGURE 6. How the participants felt while interacting with their surrounding on a scale from 5 (positive) to 1 (negative).
FIGURE 7. Heat-map representing the density of the users’ feelings and the associated grades. The scale varies from blue (medium) to red (high).
C. PARTICIPANTS’ WELL-BEING
Participants’ well-being was evaluated based on a specialised psychometric scale which quantifies the response for each item on the scale. As a result, each user has an associated well-being score. The number of participants was restricted to those who completed the initial and the after-study ques-tionnaires. As a result, the number of users decreased from the initial of 1870 to 403, because the participants either chose not to complete the after study form or they disengaged with using the app. To give an overview, for the 403 partic-ipants at the beginning of the study, 22% had a well-being classed as clinical cases, while the rest of 78% had a well-being above the threshold. The impact of noticing the good things in urban nature on well-being is reported in a separate paper, however statistical analysis revealed clinically signif-icant improvements in mental health for clinical cases along with significant improvements in mental health for the whole sample.
V. FEATURES NOTICED BY THE USERS
In order to find out which elements of nature get the attention of the users, we analysed the observations data, namely the text entries and the uploaded pictures.
A. WHAT DO THE IMAGES SAY?
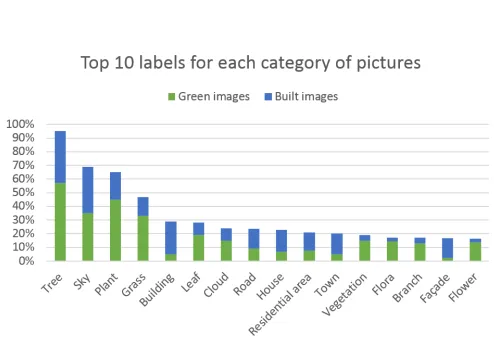
For the images, we filtered the identified labels and did a count analysis as described in Section III-E. Table 4 gives an overview of the number of labels for the two participant groups. The column "No. of labels" gives the total number of labels identified across all pictures, while the following column tells us how many of those labels are actually unique. After we apply the filtering described in Section III-E, we can see that these numbers reduce.
TABLE 4. Number of labels for participant categories.
User group
No.of labels
No.of unique labels
No. of labels after filtering
No. of unique la-bels after filtering
Green 9610 804 8450 676
Built 5630 640 5012 530
FIGURE 8. Top 10 labels for each category of images.
[image:9.576.61.255.249.388.2]in the green category is 2694, while for the built it is 1317. This represents approximately 32% of the total for the former and 26% for the latter, respectively. A better view could be obtained with a compression of synonymous labels in just a few clusters. However, this would require a dictionary for each cluster or a human expert for manual categorisation of the labels.
B. WHAT DOES THE TEXT SAY?
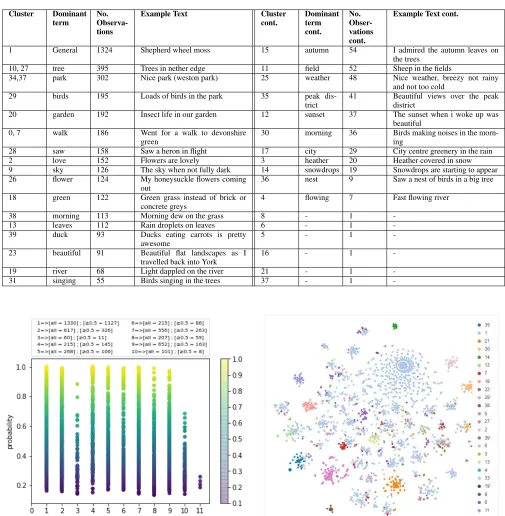
Using the text clustering API of [31], we obtained the result in Table 5 which contains the count of the number of ob-servations for each cluster and an example from the dataset. A visualisation of the clustering using a simple technique, which generated twice the number of observations of the general category (cluster 1) is shown in Fig. 10 with a snippet of some of the cluster labels. There were clusters formed for observations with specific parks mentioned which enabled us to have an idea of the location of the citizens. Cluster 32 and 34 were observations about parks including those in Sheffield like the Weston Park, Meersbrook Park and Hillsborough Park. It was earlier mentioned that the app did not produce some expected result for the data analysis, with only 418 observations being recorded at the time of the observation. The users were allowed to record their observations at the end of the day. This was supposed to be an advantage to give people flexibility and convenience and allow for more entries to be recorded. However, since most of the observations could not be tagged to a location, we could not carry out anal-ysis mapping locations with observations. This introduced errors as some observations were made and tagged to wrong locations. In the text analysis results, we found some clusters around predominantly mentioned parks. This could be used further to match missing information from the study.
The clustering gave an idea of the kind of activities people were engaging in. Clusters 0 and 7 related to walking activi-ties. A relation with the ‘whyThere’ field was observed. Most of the text observations clustered around walking; (Cluster 0 and 7) received ‘Walking’ as the response to why the people were there. Other reasons were travelling and exercising. The clusters with only one observation count contained rather long text which could fit into multiple themes. Some other clusters give us an insight into the kind of the biodiversity of the park - birds, ducks, bird’s nest, flowers. The category "tree" has the highest number of cluster elements for a specific dominant term and is represented in two clusters (Clusters 10 and 27). It is interesting to note that in the case of the image analysis, the highest count for the labels extracted was also "tree".
We can see some level of correspondence between the clusters and the themes recurring in the [20] study. There is a clustering around colour with most of the comments being about the green colour of leaves or grass. We can see the effect of weather on different elements, as well as reflections about the weather in most of the observa-tions containing the word ‘morning’. There is also the beauty/appreciation/wonder in the cluster about love and
beauty. Most of the clusters about animals were referring to the ‘animals being active in their habitat’. Some clusters hint at the specific actions that occur naturally in the environment and which people notice: i.e. in cluster 4 (‘flowing’) people are mostly observing how the river is flowing, and in clus-ter 31 (‘singing’) the depicted activity is concerning birds singing on the trees.
The result of the text classification as described in Section III-D is shown in Fig. 9. The "specific aspect of nature" theme happened to be the dominating theme regardless of the used threshold. For a threshold of above 50%, the "animals being active in their habitat theme" is the second highest. The top 5 themes with probability above 50% in this study, interestingly corresponds to the top 5 themes of the study in [20] gathered by a traditional, and time consuming approach to content analysis. The present analysis demonstrates that automated approaches to content analysis are possible. How-ever, unlike their study which has the "sensations of nature" theme as the dominating theme, this study has the "specific aspect of nature" as the top theme.
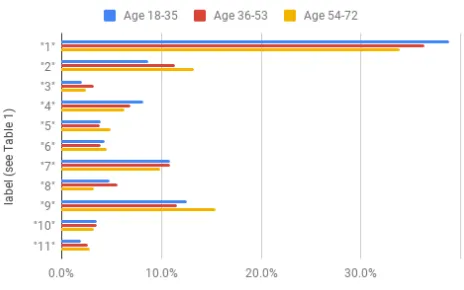
Fig. 11 shows the result obtained from classification for the various age groups. Theme 1 and 9 happen to be the most popular in each group as expected from the general classi-fication. For the younger group, there is less interest in the activity of animals in their habitat than in other age groups, as growth and temporal changes appear to be more interesting to them. In Fig. 11, the female and male gender seem to vary only slightly, with the females scoring only a little higher for some themes like the sensations of nature, colour and beauty. In summary, understanding the good things in nature inform the design of future interventions to engage and connect people with nature for their well-being, for example, by prompting people to notice trees and birds, or adapting prompts based on gender and age. Future developments could allow real-time text analysis to vary the prompts away from aspects which are being frequently recorded, or towards those known to be associated with improvements in well-being.
C. HOW DO IMAGE AND TEXT CORRESPOND?
TABLE 5. Text clustering.
Cluster Dominant term
No. Observa-tions
Example Text Cluster
cont.
Dominant term cont.
No. Obser-vations cont.
Example Text cont.
1 General 1324 Shepherd wheel moss 15 autumn 54 I admired the autumn leaves on
the trees
10, 27 tree 395 Trees in nether edge 11 field 52 Sheep in the fields
34,37 park 302 Nice park (weston park) 25 weather 48 Nice weather, breezy not rainy
and not too cold
29 birds 195 Loads of birds in the park 35 peak
dis-trict
41 Beautiful views over the peak
district
20 garden 192 Insect life in our garden 12 sunset 37 The sunset when i woke up was
beautiful
0, 7 walk 186 Went for a walk to devonshire
green
30 morning 36 Birds making noises in the
morn-ing
28 saw 158 Saw a heron in flight 17 city 29 City centre greenery in the rain
2 love 152 Flowers are lovely 3 heather 20 Heather covered in snow
9 sky 126 The sky when not fully dark 14 snowdrops 19 Snowdrops are starting to appear
26 flower 124 My honeysuckle flowers coming
out
36 nest 9 Saw a nest of birds in a big tree
18 green 122 Green grass instead of brick or
concrete greys
4 flowing 7 Fast flowing river
38 morning 113 Morning dew on the grass 8 - 1
-13 leaves 112 Rain droplets on leaves 6 - 1
-39 duck 93 Ducks eating carrots is pretty
awesome
5 - 1
-23 beautiful 91 Beautiful flat landscapes as I
travelled back into York
16 - 1
-19 river 68 Light dappled on the river 21 - 1
-31 singing 55 Birds singing in the trees 37 - 1
-FIGURE 9. Classification of the textual observations into the themes of Table 1 with the FastText algorithm.
to one image was treated as a text observation. The result was overwhelmingly "label 1" (approximately 90%) which represents a specific part of nature. This is not surprising and just reinforces the idea mentioned above regarding the rather static nature of an image.
FIGURE 10. Clusters produced from k-means clustering (k=40) of textual observations. Legend captures 25 clusters.
VI. TIME SPENT IN GREEN SPACES
TABLE 6. Average time spent in parks, by user.
User Period Study Tracked Days N. Visit Visits for day N. Parks Total Time Avg Daily Time Avg Visit Time
1 35 Days 30 106 4 10 5 days 20:40:01 04:41:20 01:19:37
2 70 Days 23 64 3 14 2 days 00:31:09 02:06:34 00:45:29
3 38 Days 20 47 2 7 1 days 07:22:15 01:34:07 00:40:03
4 8 Days 7 25 4 6 0 days 08:17:29 01:11:04 00:19:54
5 11 Days 11 48 4 11 0 days 12:54:22 01:10:24 00:16:08
6 43 Days 19 37 2 8 0 days 21:55:20 01:09:14 00:35:33
7 69 Days 24 37 2 7 1 days 03:19:41 01:08:19 00:44:19
8 114 Days 41 168 4 8 1 days 20:00:32 01:04:24 00:15:43
9 122 Days 74 154 2 26 3 days 04:23:51 01:01:57 00:29:46
[image:12.576.46.530.236.351.2]10 24 Days 16 94 6 25 0 days 16:18:26 01:01:09 00:10:25
TABLE 7. Average time spent inside green spaces, by park.
Rank Park Tracked N.Visit N.Users Visits Visits Total Avg Daily Avg Visit
Days for Day for Device Time Time Time
1 Endcliffe Park 124 358 68 2.89 5.26 10 days 19:28:10 02:05:33 00:43:29
2 Whiteley Woods 71 111 23 1.56 4.83 2 days 20:24:10 00:57:48 00:36:58
3 Weston Park 149 807 170 5.42 4.75 5 days 19:31:05 00:56:11 00:10:22
4 Botanical Gardens 97 191 39 1.97 4.90 2 days 22:46:01 00:43:46 00:22:14
5 Ponderosa Park 82 231 46 2.82 5.02 2 days 00:13:41 00:35:17 00:12:32
6 Hillsborough Park 52 165 29 3.17 5.69 1 days 02:24:19 00:30:28 00:09:36
7 Hallam Square 117 287 56 2.45 5.13 1 days 09:53:09 00:17:23 00:07:05
8 Crookes Valley Park 90 246 76 2.73 3.24 0 days 23:20:11 00:15:33 00:05:42
9 St. Georges Lecture Park 109 310 76 2.84 4.08 0 days 20:05:13 00:11:03 00:03:53
[image:12.576.43.275.382.527.2]10 Peace Gardens 135 334 91 2.47 3.67 1 days 00:09:48 00:10:44 00:04:20
[image:12.576.44.275.567.707.2]FIGURE 11. Age classification of textual observations.
FIGURE 12. Gender classification of textual observations.
A. TOP USERS AND PARKS BASED ON AVERAGE TIME
SPENT IN GREEN SPACES
they interacted with at least one park. The top 10 users shown in Table 6 have a time spent in nature higher than average and, excluding user 4, also the number of parks with which users interact is higher. Then there are some borderline situations, for example, user 1 spent an average of 4 hours a day in green spaces. By analyzing their data we noticed that they spent almost all their time in a park. This suggests that they are connected to this park for a specific reason, i.e. it may be that they work in the park (an example could be park maintenance, a dog-sitter or fitness instructor).
The top ten parks users interact with in terms of average time spent can also be observed. Using heat-maps (also called density maps) it is possible to see how the people interact with parks, where they go and what paths are the most used. Fig. 13 shows the users’ interactions with "Endcliffe Park". The heat map evolves from green (fewer location points) to red (higher number of location points). The red path identifies with the actual built path in the park which can be identified by the light coloured thin line. The green paths are rather in green spaces where there are no built paths and the users freely walk around. It can be seen that this view allows us to identify the most used paths in a green space, as well as the less explored parts. This can act as a trigger for administration and local authorities to decide in which areas should the new interventions in that park be focused.
B. AGE AND GENDER DISTRIBUTION IN PARK
UTILISATION
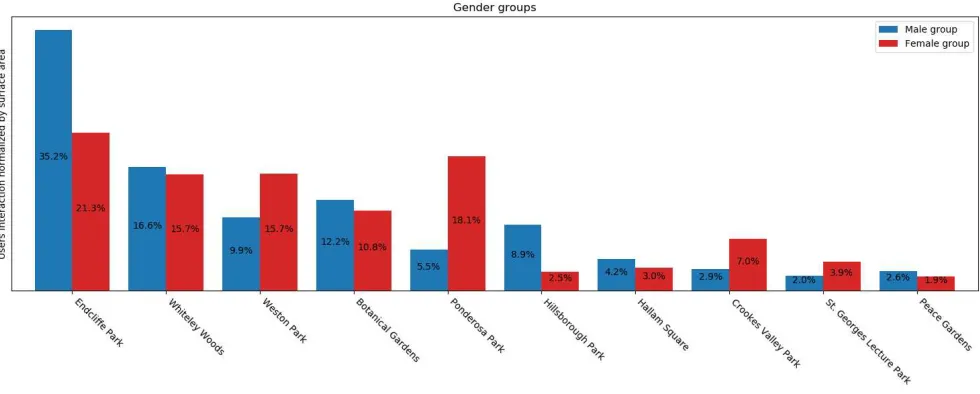
In Fig. 14 and Fig. 15 we can see a depiction of how the different age and gender groups interact in terms of time spent with the top 10 green spaces. Focusing on the age dis-tribution, it can be noticed that the middle-age group prefers to spend more time inside big parks like Endcliffe Park, Ponderosa Park and Hillsborough Park. The younger group instead prefers parks like Endcliffe Park, Whitley Woods, Weston Park and Botanical Gardens. The older group spent more time inside parks like Endcliffe Park, Whitley Woods and Hillborough Park. Analysing Fig. 15 we can assert that some parks are used in an unbalanced way by the different genders. Examples are Endcliffe Park and Hillsborough Park where there is a higher presence of male users. The opposite happens in Weston Park, Ponderosa Park and Crookes Valley Park, where there is a higher use by the female participants. This basic analysis shows how the data collection method-ology could provide data of interest to local authorities and inform the design and provision of urban green spaces. More detailed analysis can explore the park characteristics and relationships to outcomes such as well-being.
VII. COMPARISON BETWEEN OBJECTIVE AND SUBJECTIVE INTERACTION
In a previous work [32], we analysed the interaction of users with the green spaces through the app utilization and we did a chart of the top 10 areas based on the number of observations. In this paper we look at a similar analysis. We compare the interaction based on the number of observations with the
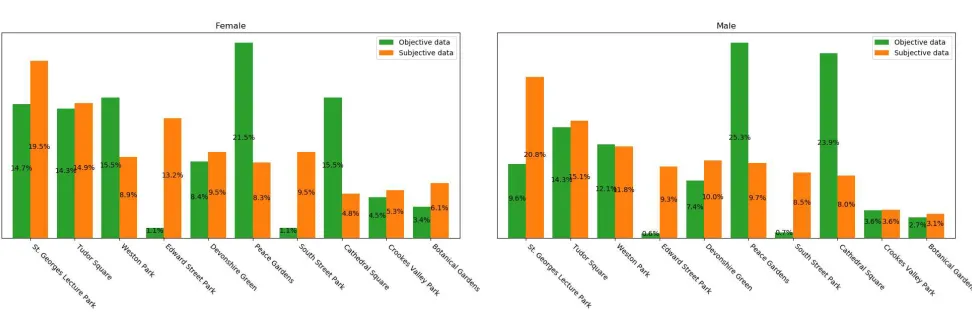
interaction based on the location points. We analyse these data and subdivide it according to demographic characteris-tics such as age and gender, so as to be able to compare the different behaviors of the users as shown in Fig. 16 and 17. These graphs are based on the top parks according to overall subjective interaction (density of recorded observations). We add the analysis of location points density in these top parks for the comparison and the results are different from Fig. 14 and 15 where the order and the data is based on the time spent. In these graphs the x-axis is ordered based on the total interaction density, so the interaction is higher in the first park on the left and then decreases in the parks to its right. The most interesting thing here is to notice how the subjective and objective data differ. In some cases, the users who interacted more with some parks in terms of time spent did not interact with the app in the same way. Checking the graphs, on the age distribution we could say that St. George Lecture Park is actually one of the parks less frequented by the old group both for the interaction with the app and for the interaction with the park itself. In this area, the young and middle-aged groups are more consistent due to the presence of the university site. Peace Gardens appears to be a park where the interaction based on location points outnumbers the interaction based on observations in all age and gender categories. This is probably due to the area being in the heart of the city, surrounded by cafes and working spaces. Because of this it is likely that a high number of people often pass by due to engaging in other activities such as hanging out with friends, going to work etc. The central position, accessibility and present features seem to trigger a high objective interac-tion. The opposite situation appears to be recorded in South Street Park where the subjective data highly outnumbers the objective data in all age categories. Also, the features of the area seem rather different to those in Peace Gardens. Furthermore, the area is considerably larger, along a street, in an area with residential buildings. Therefore, it is more likely that people are returning home, passing by the park. This could trigger a subjective interaction as people notice green features from the distance. At the same time, the interaction concerning location points is limited as the persons do not actually go into or pass through the park.
VIII. CONCLUSIONS
FIGURE 13. Endcliffe Park utilization based on the concentration of location points (green - low number, red - high number).
FIGURE 14. Age groups interactions with top 10 most visited green spaces. The percentages are computed only on the samples in these top areas. The amount of interaction decreased by going to the right.
[image:14.576.42.532.502.699.2]FIGURE 16. Age groups objective (green) and subjective (orange) interactions with top 10 most visited green spaces. The percentages are computed only on the samples in these top areas.
the behaviour of the inhabitants of Sheffield, UK. We cleaned and pre-processed the initial data set and proceeded towards a deeper analysis. The main types of data we used concern text observations, images taken by the users, as well as participants’ location points in the geo-fenced green spaces. Machine learning techniques allowed us to automatically extract the main topics of interest in the text, as well as categorization of the comments in 11 classes as described in previous research using traditional methodologies, showing how content analysis can be automated with similar results. Furthermore, it enabled us to identify features noticed by the users based on the pictures they uploaded. The output from the text and the images were compared and some similarities could be pinpointed regarding what the citizens notice as the good things in their green surroundings. The location points provided us with the time spent in various green spaces and allowed us to identify the most active users, as well as the most popular parks. In order to broaden the analysis we compared the interaction based on inputted observations with the interaction based on automatically recorded location points when in green spaces. The challenge in this type of study comes from fusing the information and finding the relationships between different variables.
FIGURE 17. Gender groups objective (green) and subjective (orange) interactions with top 10 most visited green spaces. The percentages are computed only on the samples in these top areas.
ACKNOWLEDGMENTS
The IWUN project was supported by the Natural Environ-ment Research Council, ESRC, BBSRC, AHRC & Defra [NERC grant reference number NE/N013565/1].
Contributions to app development: The app design was based on concept by Miles Richardson (MR), initial research design and smartphone app concept work was led by MR with support from David Sheffield (DS) and Kirsten McEwan (KM), before being completed by MR, DS and KM. Im-plementation of the app was undertaken by MR, KM, DS and Paul Brindley (PB) in liaison with the acknowledged developers. Data analysis and visualization performed by the Data Science Research Centre, University of Derby,
UK (www.derby.ac.uk/data-science). We would like to
ac-knowledge the support and input from the app developers, Furthermore Ltd and the Sheffield and Rotherham Wildlife Trust in promoting Shmapped to participants.
REFERENCES
[1] N. Zhong, J. Ma, R. Huang, J. Liu, Y. Yao, Y. Zhang and J. Chen, "Research challenges and perspectives on Wisdom Web of Things (W2T)", The Journal of Supercomputing, vol. 64, no. 3, pp. 862-882, 2010. [2] B. Guo, Z. Yu, X. Zhou, and D. Zhang, "Opportunistic IoT: Exploring the
social side of the internet of things", in Proceedings of the 2012 IEEE 16th International Conference on Computer Supported Cooperative Work in Design (CSCWD), 2012.
[3] A. Zanella, N. Bui, A. Castellani, L. Vangelista and M. Zorzi, "Internet of Things for Smart Cities", IEEE Internet of Things Journal, vol. 1, no. 1, pp. 22-32, 2014.
[4] J. Jin, J. Gubbi, S. Marusic and M. Palaniswami, "An Information Frame-work for Creating a Smart City Through Internet of Things", IEEE Internet of Things Journal, vol. 1, no. 2, pp. 112-121, 2014.
[5] Z. Khan, A. Anjum, K. Soomro and M. Tahir, "Towards cloud based big data analytics for smart future cities", Journal of Cloud Computing, vol. 4, no. 1, 2015.
[6] "Improving Wellbeing through Urban Nature (IWUN) | Shmapped", Iwun.uk, 2018. [Online]. Available: http://iwun.uk/shmapped/. [Accessed: 17- Dec- 2018].
[7] K. Samuelsson, M. Giusti, G. D. Peterson, A. Legeby, S. A. Brandt, and S. Barthel, "Impact of environment on peoples everyday experiences in Stockholm, Landscape and Urban Planning", vol. 171, pp. 7-17, Mar. 2018.
[8] G. MacKerron and S. Mourato, "Happiness is greater in natural environ-ments", Global Environmental Change, vol. 23, no. 5, pp. 992-1000, Oct. 2013
[9] I. Bakolis, R. Hammoud, M. Smythe, J. Gibbons, N. Davidson, S. Tognin and A. Mechelli, "Urban Mind: Using Smartphone Technologies to Inves-tigate the Impact of Nature on Mental Wellbeing in Real Time", Biological Psychiatry, vol. 83, no. 9, p. S374, 2018.
[10] S. Ruiz-Correa, D. Santani, and D. Gatica-Perez, "The Young and the City: Crowdsourcing Urban Awareness in a Developing Country", in Proceedings of the The First International Conference on IoT in Urban Space, 2014
[11] M. Richardson and D. Sheffield, "Three good things in nature: noticing nearby nature brings sustained increases in connection with nature", Psye-cology, vol. 8, no. 1, pp. 1-32, Jan. 2017.
[12] J. Maas, R. Verheij, R. de Vries, P. Spreeuwenberg and P. Groenewegen, "Green space, urbanity, and health: how strong is the relation?", Journal of Epidemiology Community Health, vol. 60, no. 7, pp. 587-592, 2006. [13] T. Bakici, E. Almirall and J. Wareham, "A Smart City Initiative: the Case
of Barcelona", Journal of the Knowledge Economy, vol. 4, no. 2, pp. 135-148, 2012.
[14] J. Lee, M. Hancock and M. Hu, "Towards an effective framework for build-ing smart cities: Lessons from Seoul and San Francisco", Technological Forecasting and Social Change, vol. 89, pp. 80-99, 2014.
[15] R. Kitchin, "Big Data, new epistemologies and paradigm shifts", Big Data Society, vol. 1, no. 1, 2014.
[16] D. Strom, "Big Data Makes Things Better", Dice Insights, 2018. [Online]. Available: https://insights.dice.com/2012/08/03/big-data-makes-things-better/. [Accessed: 17- Dec- 2018].
[17] H. Shahrokni, B. V. D. Heijde, D. Lazarevic, and N. Brandt, "Big Data GIS Analytics Towards Efficient Waste Management in Stockholm," Proceed-ings of the 2014 conference ICT for Sustainability, 2014.
[18] "Google Cloud Vision API", Google Cloud, 2018. [Online]. Available: https://cloud.google.com/vision/. [Accessed: 17- Dec- 2018].
[19] A. Joulin, E. Grave, P. Bojanowski and T. Mikolov, "Bag of Tricks for Efficient Text Classification", Arxiv.org, 2018. [Online]. Available: https://arxiv.org/abs/1607.01759. [Accessed: 17- Dec- 2018].
[20] M. Richardson, J. Hallam, and R. Lumber, "One Thousand Good Things in Nature: Aspects of Nearby Nature Associated with Improved Connection to Nature", Environmental Values, vol. 24, no. 5, pp. 603-619, Oct. 2015. [21] B. Guo, D. Zhang, Z. Wang, Z. Yu, and X. Zhou, "Opportunistic IoT:
Exploring the harmonious interaction between human and the internet of things", Journal of Network and Computer Applications, vol. 36, no. 6, pp. 1531-1539, Nov. 2013.
[22] G. Miller, "The Smartphone Psychology Manifesto", Perspectives on Psychological Science, vol. 7, no. 3, pp. 221-237, May 2012.
[23] M. Jolanda, R. Verheij, P. Groenewegen, S. Vries, and P. Spreeuwenberg., "Green space, urbanity, and health: how strong is the relation?", Journal of Epidemiology and Community Health 60, no. 7, pp. 587-592, 2006. [24] P. Anantharam, P. Barnaghi, K. Thirunarayan, and A. Sheth, "Extracting
City Traffic Events from Social Streams", ACM Transactions on Intelligent Systems and Technology, vol. 6, no. 4, pp. 1-27, Jul. 2015.
[26] Y. Fujiki, K. Kazakos, C. Puri, P. Buddharaju, I. Pavlidis, and J. Levine, "NEAT-o-Games", Computers in Entertainment, vol. 6, no. 2, p. 1, Jul. 2008.
[27] F. Calabrese, M. Colonna, P. Lovisolo, D. Parata, and C. Ratti, "Real-Time Urban Monitoring Using Cell Phones: A Case Study in Rome", IEEE Transactions on Intelligent Transportation Systems, vol. 12, no. 1, pp. 141-151, Mar. 2011.
[28] A. K. Gopalakrishna, T. Ozcelebi, J. J. Lukkien, and A. Liotta, "Evaluating machine learning algorithms for applications with humans in the loop", in 2017 IEEE 14th International Conference on Networking, Sensing and Control (ICNSC), 2017.
[29] Y. Qin, Q. Z. Sheng, N. J. G. Falkner, S. Dustdar, H. Wang, and A. V. Vasilakos, "When things matter: A survey on data-centric internet of things", Journal of Network and Computer Applications, vol. 64, pp. 137-153, Apr. 2016.
[30] P. de Meo, E. Ferrara, F. Abel, L. Aroyo, and G.-J. Houben, "Analyzing user behavior across social sharing environments", ACM Transactions on Intelligent Systems and Technology, vol. 5, no. 1, pp. 1-31, Dec. 2013. [31] K. Kalyanarangan, "Text-Clustering-API", GitHub repository, 2017.
[Online]. Available: https://github.com/vivekkalyanarangan30/Text-Clustering-API. [Accessed: 17- Dec- 2018].
[32] E. Ferrara et al., "A Pilot Study Mapping Citizens’ Interaction with Urban Nature", in 2018 IEEE 16th Intl Conf on Dependable, Autonomic and Se-cure Computing, 16th Intl Conf on Pervasive Intelligence and Computing, 4th Intl Conf on Big Data Intelligence and Computing and Cyber Science and Technology Congress(DASC/PiCom/DataCom/CyberSciTech), 2018. [33] K. Krippendorff, "Content Analysis: An Introduction to its Methodology",
Beverly Hills: SAGE Publications, Inc, 1980.
[34] R. Weber, "Basic Content Analysis", SAGE Publications, Inc, 1990.
LAURA ERHAN studied computer engineering at the Technical University "Gheorghe Asachi" in Iasi, Romania. As part of her studies she spent one year abroad with the Erasmus+ study exchange programme at the Technical University of Eind-hoven, the Netherlands. She is currently a PhD student at the University of Derby, UK, where she is collaborating with the Data Science Research Centre.
MARYLEEN NDUBUAKUis a Computing PhD candidate at the Data Science Research Centre, University of Derby UK. She received a Bachelors degree in Electrical and Electronic Engineering (EEE) at the Federal University of Technology Owerri, before obtaining her MSc in Embedded Systems from Coventry University. Her current re-search lies in the areas of Deep learning, Anomaly detection and Cloud/Edge computing. Her PhD centres on real-time detection of anomalous events in smart visual networks, which can find application in video surveillance, occupancy monitoring, and human behaviour understanding. Specifically, she is looking into how visual systems can self-learn and profile activities to distinguish special occurrences over time.
ENRICO FERRARA studied electronic engi-neering at the University of Cagliari, Italy. He worked as a deputy director in a company working in the safety sector before moving to the Univer-sity of Derby where now, as a PhD student, he is collaborating with the Data Science Research Centre.
MILES RICHARDSON studied ergonomics at Loughborough University, UK and worked as a Human Factors Engineer in the defence industry before moving to the University of Derby where he now leads the Nature Connectedness Research Group. Professor Richardson is both a Chartered Psychologist and Chartered Ergonomist applying research into nature connectedness to improve both human and nature’s well-being.
DAVID SHEFFIELD is registered as a health psychologist who studied psychology at Glasgow Caledonian University, UK. He worked as a re-searcher in three cardiology departments in the United States before returning to United Kingdom. He now works at the University of Derby as Pro-fessor of Psychology with expertise and multiple publications in pain, cardiovascular responses to stress, performing under pressure, maths anxiety and nature connectedness.
FIONA J. FERGUSON completed her under-graduate degree in Psychology from The Univer-sity of St. Andrews, before obtaining her MSc from Edinburgh University. She has an extensive research background, beginning with her work in Individual Differences and continuing on to her current roles as a researcher in the field of Compassion, Nature Connectedness and Wellbe-ing. Fiona’s interests lie in exploring and under-standing nature connection, ways to improve it and the subsequent effects on wellbeing.

![TABLE 1. Labels from training data [20].](https://thumb-us.123doks.com/thumbv2/123dok_us/1829796.138908/7.576.42.539.79.487/table-labels-from-training-data.webp)