Int. J. Electrochem. Sci., 13 (2018) 2080 – 2089, doi: 10.20964/2018.02.60
International Journal of
ELECTROCHEMICAL
SCIENCE
www.electrochemsci.org
Short Communication
Finite element analysis of PEMFC assembling based on ANSYS
Guilin Hu*, Xiaojun Wu, Yange Suo, Yuzhen Xia, Yousheng Xu, Zhiguo Zhang
School of Mechanical and Automotive Engineering, Zhejiang University of Science and Technology, Hangzhou, 310023, P. R. China
*
E-mail: [email protected]
Received: 17 October 2017 / Accepted: 5 December 2017 / Published: 28 December 2017
Proton exchange membrane fuel cells (PEMFC) are composed of end plates, flow fields, the membrane electrode assembly (MEA) and sealing components. Before assembling a fuel cell stack, obtaining the distribution of stress and deformation of PEMFC components by simulating the assembly process can enhance cell performance and reduce the risk of gas leakage, as well as decrease production costs. To provide a good reference datum for the actual assembly, a real fuel cell stack was used in research. Finite element analysis of PEMFC assembling, based on software ANSYS, was conducted to better learn the stress and deformation during assembly. The effect of varying the clamping loads during assembly was investigated for different forces (300N, 400N, 500N and 600N) and for different displacements (0.1 mm, 0.2 mm and 0.3 mm). For the single cell, a load of 400N and 0.2 mm displacement are appropriate. They provide good reference datum for real assembly process. Further, the distribution of stress and deformation in the core component MEA of single cell and 10-cell stack under different loads were obtained, providing good reference datum for the actual stack assembly. Results from stack simulation indicate that the distribution of stress and deformation in different cell is similar in trend, with slight differences.
Keywords: Proton exchange membrane fuel cell; assembly; simulation; ANSYS
1. INTRODUCTION
be optimized [2].
To determine optimum clamping pressures under different operating voltages Xing [3] used a global searching method, namely the simultaneous perturbation stochastic algorithm (SPSA) method and a three-dimensional model to investigate the effect of assembly clamping pressure on the GDL properties and thus on the performance of PEM fuel cells. Lee4 established the finite element analysis (FEA) procedures for a PEM single cell. The pressure distribution in the single cell was calculated and verified by experiment with a pressure film inserted between the bipolar plates and the MEA. Considering this as a mechanical equivalent stiffness model with numerous elastic elements (springs) in either series or parallel connection, Lin [5, 6] proposed a highly efficient assembly technique for large proton exchange membrane fuel cell (PEMFC) stacks to obtain optimal clamping load. The equivalent stiffness model results were verified by three-dimensional finite element analysis (FEA) for a single PEMFC. Based on their new model, a concept for designing the structural components of a large PEMFC stack was proposed. Mason [7] described the use of an in-situ analytical technique based on simultaneous displacement and resistance measurement of gas diffusion layers (GDLs) in polymer electrolyte fuel cells (PEFCs), when they are exposed to varying compaction pressure. By analyzing the change in thickness and ohmic resistance of GDLs under compression, important mechanical and electrical parameters were obtained. To investigate the effect of gas diffusion layer (GDL) compression on fuel cell performance, Yim [8] experimentally studied a 5-cell proton exchange membrane fuel cell (PEMFC) stack with different GDL compressions (15% and 30%). Results showed that PEMFC stacks with high GDL compression (30%) performed better than those with low GDL compression (15%) for all current ranges. This means that the decrease in contact resistance with high GDL compression has greater effect on stack performance than the increase in mass transport resistance. Taymaz [9] developed a finite element analysis (FEA) model to predict the deformation caused by assembly pressure in the single channel PEM fuel cells. The deformed geometrical model was then converted to a three-dimensional CFD fuel cell model to compute fluid flow and electrochemical reactions, so the effect of assembly pressure on fuel cell performance was predicted. Zhou [10] used a micro-scale numerical model to predict the contact resistance between bipolar plates (BPP) and GDL in PEM fuel cells. In another study, Zhou [11] developed a finite element based structural and mass-transfer model. The mechanical deformation, mass transfer resistance, and electrical contact resistance caused by assembly pressure were all calculated. Zhou [12, 13] developed a new model to observe stack mechanical behavior under different assembly pressures, temperatures, and humidity. Subsequently, by using the deformed geometrical model and updated material properties, gas flow, diffusion, ion transport, and chemical reactions were all calculated. In this paper, a FEA model has been developed to study stress and deformation for both single fuel cell and 10-cell stack under different values of force load and displacement in the actual assembly process.
2. METHODOLOGY
[image:3.596.232.362.179.354.2]
Solidworks as shown in Fig.2. The obtained geometrical model was transferred to the software ANSYS Workbench, and the finite element analysis of the fuel cell stack assembly process was conducted. Like the actual assembly process, two methods based on two known loads were employed. Different clamping forces (set by the tightening torque of clamping bolts) and displacements were simulated in this paper.
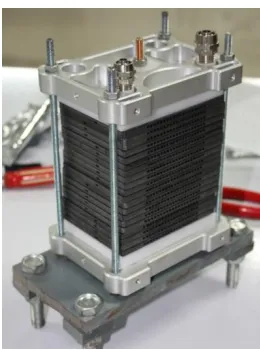
Figure 1. 10-cell stack on the lab bench
Figure 2. PEMFC assembly diagram
3. RESULTS AND DISCUSSION
[image:3.596.125.479.414.533.2][image:4.596.89.510.558.738.2]
the other components. The gaskets have the smallest elastic modulus, thus they will be the first to be compressed during assembly. Next, the MEA will experience some compression to ensure good electric contact between the channel shoulders and the gas diffusion layers.
Table 1. Dimensions and material properties of PEMFC components
Components Materials Young’s
Modulus/Pa
Poisson’s
Ratio Dimension/mm
End Plates Stainless steel 1.97e11 0.3 121×96×15
Bipolar plate Carbon 2.2e9 0.394 101×76×22
MEA Flexible
materials
2.1e7 0.1 101×76×0.3
Gasket PTFE 1.19e6 0.48 97×22×0.6
Bolts Stainless steel 1.97e11 0.3 5 mm diameter
3.1 Effect of load forces
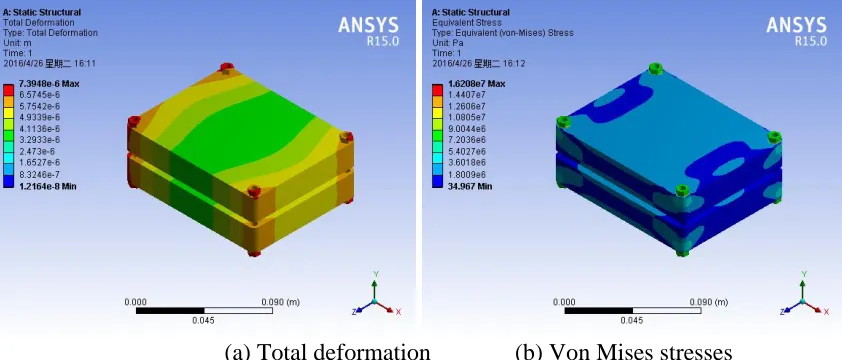
For this simulation, the loading forces are known: 300N, 400N, 500N and 600N respectively. The distributions of total deformation, Von Mises stress and normal stress in the Y-direction of MEA for the 300 N are shown in Fig.3. Fig 3c clearly shows the channel effect of the MEA stress, implying good contact between the MEA and the flow field plates [14]; the deformation around the bolts is higher than at other sites, the deformation at the centre part is relatively small. The symmetrical structure has symmetrical stress contours. The large deformation at the centre is in compliance with reference [15], i.e. the centre of the end plate bent because the load forces act at the four corners. So assembly by four-corner pressuring requires stronger or thicker end plates. More bolts would provide more uniform stress and deformation [16].
(c) Normal stresses in Y-direction of MEA
Figure 3. The distributions of total deformation, Von Mises stresses and normal stresses in the Y-direction of MEA for a load force of 300 N
This assembly by four-corner pressuring is suitable for single cells or small stacks [17]. In general, for larger stacks, four more bolts, located at the middle of the four edges, is desirable. To avoid serious stress concentrations and possible cell breakage, stacks of other shapes may require even more bolts [18].
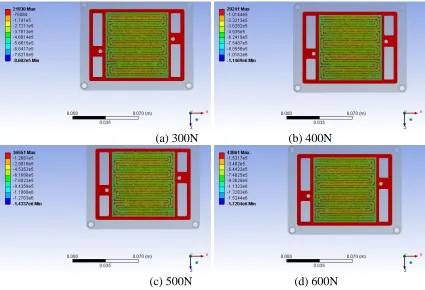
Fig.4 illustrates the distribution of normal stresses in the Y-direction of MEA under force loads of 300N, 400 N, 500N and 600N. The same distribution trend can be seen in the figures. The channel effect can be seen clearly, which implies good contact between MEA and the shoulders of the current collector. The stresses rise as the load forces increase. The stresses under the channel shoulders have direction opposite to that under the channel part. When the contact part is compressed, the channel part will protrude into the channel.
(a) 300N (b) 400N
[image:5.596.193.406.69.210.2](c) 500N (d) 600N
[image:5.596.86.511.453.743.2]
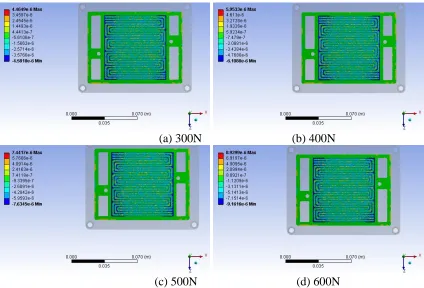
Fig.5 illustrates the distribution of deformation in the Y-direction of MEA under force loads of 300N, 400 N, 500N and 600N. It can be seen that the MEA under the shoulder of the current collector have negative value deformation because this zone was compressed during assembly. However, the MEA under the channel will have positive value deformation because the clamping force will make this zone bulge and protrude into the channel. This result is similar to the simulation result for the single channel [19]. The deformation at the centre part is smaller than in other places, because the bending of centre part that causes the deformation around periphery is higher than that at the centre part. This is consistent to figure and also makes necessary stronger end plates, or the large bending at the centre will cause high electrical resistance between the MEA and the bipolar plate at the centre.
(a) 300N (b) 400N
(c) 500N (d) 600N
Figure 5. Effect of force loads on directional deformation in the Y-direction of MEA
3.2 Effect of displacements
[image:6.596.87.511.249.537.2]
shoulders of the current collector have negative value deformation because this zone is compressed during assembly. However, the MEA under the channel has positive value deformation because the clamping force made this zone bulge. This result is similar to the simulation result for the cell with single channel [19]. Moreover, the directional deformation rises as displacement increases. For a displacement of 0.1 mm, the maximum deformation of MEA is about 0.052mm or 17.3% of the original dimension; for a displacement of 0.2 mm, the maximum deformation of MEA is about 0.105mm or 35% of the original dimension; for a displacement of 0.3 mm, the maximum deformation of MEA is about 0.156mm or 52% of the original dimension. According to the experimental study by Wang [20], a displacement about 0.2mm is the most suitable, and is recommended by this study. Compared to Fig.5, the deformation of MEA is more uniform, because this kind of load pressurizes the cell face uniformly.
(a) 0.1mm (b) 0.2mm
[image:7.596.89.507.283.569.2](c) 0.3mm
Figure 6. The distribution of directional deformation in the Y-direction under different displacements of 0.1 mm, 0.2 mm and 0.3mm respectively
3.3 10-cell stack
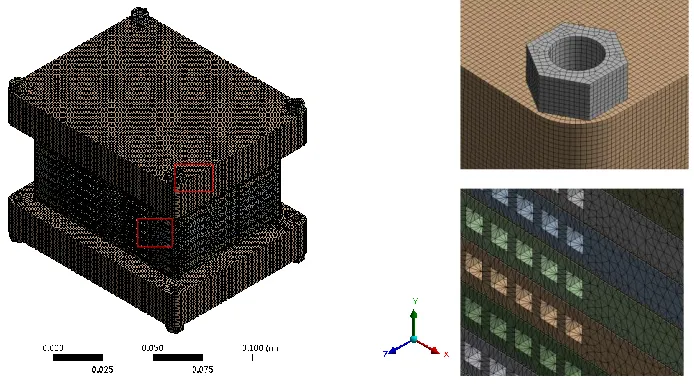
Figure 7. The mesh of the 10-cell stack structure
[image:8.596.132.479.73.266.2]Fig.8 shows the Von Mises stress contours of the stack. It can be seen that stress in the bipolar plate is very small, and that the highest stress is located around the bolts. The centre part also has high stress because the cell of the stack is pressured by the end plate.
Figure 8. The distribution of Von Mises stress for the 10-cell stack
[image:8.596.194.404.376.505.2] [image:8.596.149.450.555.736.2]
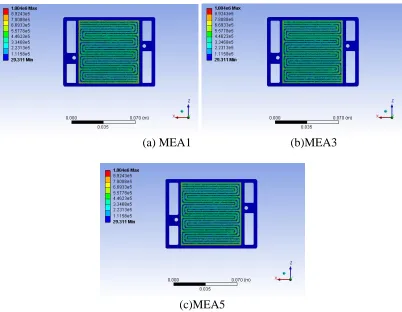
(a) MEA1 (b)MEA3
[image:9.596.96.498.67.379.2](c)MEA5
Figure 10. The distribution of Von Mises stresses for MEA1(top),3,5
Because strain in the MEA will determine cell performance [21], the strain of every cell MEA is studied in this paper. Fig.9 illustrates strain contours for every MEA. In order to clarify the pattern of stress distributions, stress contours of the MEA1 (top), 3, 5 are displayed in Fig.10. Also seen easily is the channel effect on all MEA, implying good contact between the MEA and flow field plates. The stress distributions are very similar.
The simulation results were used to guide lab 10-cell stack assembly, optimized cell performance was obtained. The detailed cell performance experimental study will be discussed in another paper.
4. CONCLUSIONS
providing a good reference for the actual stack assembling. Results indicate that the distribution of stress and deformation in different cells are similar.
ACKNOWLEDGEMENTS
This work was partly sponsored by the Zhejiang Provincial Natural Science Foundation of China (Q16B030003), Academic Exchange Project of Zhejiang Provincial Natural Science Foundation of China (S17A020001) and China Scholarship Council foundation (201708330014). Authors would like to thank Mr. Brian Grove Mc Lernon for English revision.
References
1. D.H. Ahmed, H.J. Sung, J. Bae, Int. J. Hydrogen Energy, 33 (14) (2008) 3786.
2. A. Bates, S. Mukherjee, S. Hwang, S.C. Lee, O. Kwon, G.H. Choi, S. Park, Int. J. Hydrogen Energy, 38 (15) (2013) 6481.
3. X.Q. Xing, K.W. Lum, H.J. Poh, Y.L. Wu, J. Power Sources, 195 (2010) 62. 4. W.K. Lee, C.H. Ho, J.W.V Zee, M. Murthy, J. Power Sources, 84 (1999) 45. 5. P. Lin, P. Zhou, C.W. Wu, J. Power Source, 194 (2009) 381.
6. P. Lin, P. Zhou, C.W. Wu, J. Power Source, 195 (2010) 1383.
7. T.J. Mason, J. Millichamp, T. P. Neville, A. El-kharouf, B.G. Pollet, D.J.L. Brett, J. Power Sources, 219 (2012) 52.
8. S.D. Yim, B.J. Kim, Y.J. Sohn, Y.G. Yoon, G.G. Park, W.Y. Lee, C.S. Kim, Y.C. Kim, Curr. Appl. Phys, 10 (2010) S59.
9. I. Taymaz, M. Benli, Energy, 35 (2010) 2134.
10. Y. Zhou, G. Lin, A.J. Shih, S.J. Hu, J. Power Sources, 163 (2007) 777.
11. Y. Zhou, G. Lin, A.J. Shih, S.J. Hu, J. Fuel Cell Sci. Technol., 6(4) (2009)2291. 12. Y. Zhou, G. Lin, A.J. Shih, S.J. Hu, J. Power Sources, 192 (2009) 544.
13. P. Zhou, C.W. Wu, G.J. Ma, J. Power Sources, 163 (2006) 874.
14. V. Radhakrishnan, P. Haridoss, Int. J. Hydrogen Energy, 35 (20) (2010) 11107. 15. J. Ge, A. Higier, H.T. Liu, J. Power Sources, 159 (2006) 922.
16. Wen C Y, Lin Y S, Lu C H, J. Power Sources, 192 (2009) 475.
17. I. Gatto, F. Urbani, G. Giacoppo, O. Barbera, E. Passalacqua, Int. J. Hydrogen Energy, 36 (20) (2011) 13043.
18. P. Chi, S. Chan, F. Weng, A. Su, P. Sui, N. Djilali, Int. J. Hydrogen Energy, 35 (7) (2010) 2936. 19. P. Chippar, O. Kyeongmin, K. Kang, H. Ju, Int. J. Hydrogen Energy, 37 (7) (2012) 6326.
20. X. Wang, Y. Song, B. Zhang, J. Power Sources, 179 (2008) 305.
21. A. Bose, P. Babburi, R. Kumar, D. Myers, J. Mawdsley, J. Milhuff, J. Power Sources, 243 (0) (2013) 964.