Int. J. Electrochem. Sci., 13 (2018) 1062 – 1073, doi: 10.20964/2018.01.86
International Journal of
ELECTROCHEMICAL
SCIENCE
www.electrochemsci.orgElectrochemical Noise Analysis of Corrosion Behavior of
Stainless Steel 304 Exposed in NaCl and FeCl
3solutions.
A. Mandujano-Ruíz1,*, J. Morales-Hernández1 , F. Castañeda-Saldivar1, H. Herrera-Hernández2, J.M. Juárez- García3
1
Centro de Investigación y Desarrollo Tecnológico en Electroquímica (CIDETEQ), Parque Tecnológico Querétaro s/n, Sanfadila Pedro Escobedo, Querétaro, C.P. 76703, México.
2
Universidad Autónoma del Estado de México, IIN-Lab. de Electroquímica Aplicada y Corrosión de Materiales Industriales, Blvd. Universitario s/n, Atizapán de Zaragoza, Estado de México 54500, México.
3
Centro Nacional de Metrología (CENAM), Km 10 carretera los Cués, El Márquez, Querétaro, C.P. 76703, México
*
E-mail: [email protected]
Received: 27 September 2017 / Accepted: 7 November 2017 / Published: 16 December 2017
Electrical parameters such as charge of the event (q), characteristic frequency (fn) and impedance (Zn)
obtained from shot-noise theory have been proposed as indicators of the initiation of pitting corrosion, and have played an important role in the construction of corrosion patterns which are a good approximation to examine the evolution of corrosion type in metals and its alloys. Therefore, in this research paper, Electrochemical Noise (EN) signals (potential and current noise data) have been collected from AISI 304 stainless steel exposed to chloride solution to evaluate the pitting corrosion behavior. The electrochemical tests were carried out at standard condition during 24 hours of exposure in two chlorine solutions (NaCl and FeCl3). Noise data analysis was mathematical treated by wavelet
transform in order to identify the low frequencies that lead the calculation of q, fn, and Zn to plot the
corrosion behavior and this was correlated with the Energy Distribution Plots (EDP) and metallographic images. The results of all the time series evaluated reveals a concordance in scale of EDP with the initiation and the growth of pitting.
Keywords: Electrochemical noise, Pitting corrosion, Wavelet Transform, Energy Distribution Plot, 304SS.
1. INTRODUCTION
identified as a novel technique for corrosion monitoring. The main advantage of EN against other electrochemical techniques like Electrochemical Impedance Spectroscopy (EIS) or Linear Polarization Resistance (LPR), is the facility to obtain information of the system without an external perturbation [2-4]. Nowadays, EN signals have contributed to the study of several phenomena such as nucleation, meta-stable pit [5] and its growth [6], crevice and general corrosion, formation of passive films or oxide layers [7, 8], inhibition mechanism [9], generation and propagation of cracks under stress at different temperatures [10-16], among others. Once the EN data are recorded, the next step is the selection of an appropriate mathematical method to obtain enough information from the signal and, get the best interpretation of the phenomenon. Compilation of methodologies for the processing of EN signals involves three fundamental aspects: i) the analysis of the Temporal Domain that consider the statistical treatment and theories like shot noise; ii) the analysis of the Frequency Domain (Discrete Fourier Transform, DFT) and, iii) the combination of both domains Time-Frequency (Wavelet Transform, WT); being the last one of great interest for its advantage of separating a group of frequencies and knowing its occurrence time [11, 17-19]. Each of these methodologies provides energetic parameters that allow to classify the high frequency signals related with the passivation process or uniform corrosion state; while the low frequency are related with pitting corrosion mechanism; thus allowing the monitoring of the corrosion evolution in the metal [20, 21].
Energetic parameters can be enhanced by the use of predominance diagrams, which describe the corrosion type and the rate at which it occurs. Examples of these plots are shown in the research work of Al-Mazedi and Cottis [21, 22], who compared several parameters such as the skew in potential and current signals, location index (IL), coefficient of variation (CV), charge of the event (q), the frequency of the event (fn), and the noise resistance (Rn). The last three are the most representative to
discriminate the corrosion types (uniform, localized and inhibition) of a carbon steel in CO2/NaCl/Thioacetamide at different concentrations. Subsequently Cottis [23] followed this study
after, incorporating an aluminum alloy exposed to different media, whose predominance diagrams combined parameters of the shot noise theory (q, fn, and Zn), resulting good indicators of the corrosion
type. In recent studies, Jian Li [24] conducted a research about the effect of temperature on the sensitivity of pitting corrosion in stainless steel 304, demonstrating that the implementation of these diagrams is very useful in monitoring this phenomenon.
In this context, the present work shows the corrosion behavior for a stainless steel 304 exposed in two chlorinated media (FeCl3 and NaCl) where localized corrosion has been previously
reported. Denoting that the parameters for the construction of the predominance diagrams were obtained from the shot noise theory and, incorporating an analysis of the signals with the wavelet transform to compare the frequencies in which the onset is presented and evolution of the corrosion mechanism.
2. EXPERIMENTAL DETAILS
2.1 Preparation of test specimen.
[image:3.596.102.495.181.510.2]
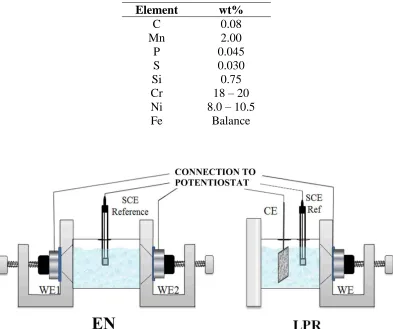
each specimen was subjected to polish with SiC paper through the numbers 80, 240, 320, 400 and 600 grits until mirror finishing surface with diamond paste of 1 µm. Finally, the specimens were rinsed with distilled water, degreasing with acetone and drying with hot air. The composition of this steel is shown in Table 2.
Table 2. Composition of 304SS
Element wt%
C 0.08
Mn 2.00
P 0.045
S 0.030
Si 0.75
Cr 18 – 20
Ni 8.0 – 10.5
Fe Balance
Figure 1. Electrochemical cell arrangement for electrochemical evaluation.
An electrochemical cell for flat specimens was used for Electrochemical Noise Test, the exposition area for working electrodes was 1 cm2. The arrangement of the cell consists in two identical samples (WE1 and WE2) of 304SS placed as working electrodes in order to register the current noise (ECN) and, a saturated calomel electrode (SCE) as reference was used to monitoring the potential noise (EPN). At the same time, another arrangement was disposed in order to carry out polarization resistance technique (LPR), to obtain the Stern-Geary coefficient (B) and the corrosion current (Icorr).
For this, a typical configuration of three electrodes was set up: 304SS as working electrode WE, platinum mesh as counter electrode (CE) and SCE as reference. A representation of both arrangement on the cell for EN and LPR experiments are shown in Figure 1. To evaluate the development of pitting, two different solutions were used in this research: FeCl3 (0.2 M) and typical NaCl (0.6 M), both of
2.2 Experimental Conditions and Signal Data Treatment
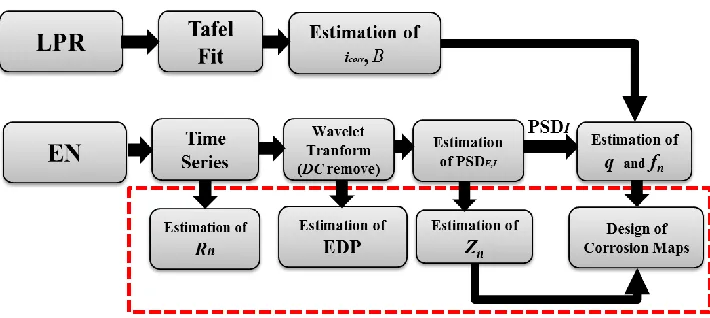
Linear Polarization Resistance (LPR) measurements and Electrochemical Noise (EN) data were achieved in a potentiostat/galvanostat of brand BioLogic® with the use of Ec-Lab software, allowing the configuration of both techniques to be running simultaneously. In the LPR setup, open circuit potential (OCP) was monitored until the system reaches dynamic equilibrium (steady-state condition); after that, a range of ± 25 V was applied for polarization at scan rate of 1 mV/s; this cycle was repeated for 24 hours. In other potentiostat channel, EN measurements were also carried out with the ZRA and with a frequency sampling (fs) of 2 Hz; duration of each time series was 512 s. From EN data, each
time series in current and potential were analyzed by appliying of Discrete Wavelet Transform (DWT) method in Matlab®. The type of wavelet selected was the orthogonal Daubechies grade 4 with 8 levels of resolution, in order to discriminate all the detail coefficients “d1…n” included the approximation
coefficient “s8” which content the trend DC in order to remove it from the noise signal. After that, the
new signal without trend was processed to obtain the power spectral density (PSD) for both potential and current, allowing to calculate together with the Icorr and B, the shot noise parameters such as q, fn
and Zn in the low frequency domain from the PSD to the final construction of the corrosion diagrams.
[image:4.596.122.477.422.581.2]Parallel to the wavelet decomposition, the coefficients were used to calculate the EDP diagrams. The steps discussed above are illustrated in Figure 2.
Figure 2. Summary of the methodology used for EN analysis.
3. RESULTS AND DISCUSSION
According with the methodology, Stern-Geary coefficient is the first parameter obtained. The behavior of B along of 24 hours is shown in Figure 3, where the value for both solution (FeCl3 or
constantly changing to another energy state due to ions charge transfer onto metal interface which modifies the slopes values of ba (anodic) and bc (cathodic).
0 2 4 6 8 10 12 14 16 18 20 22 24 0.002
0.003 0.004 0.005
Time (hr) BFeC
l
3
( V *d
[image:5.596.134.464.124.339.2]ec -1 ) 0.0010 0.0015 0.0020 0.0025 0.0030 0.0035 B NaCl ( V*de c -1 )
Figure 3. Evolution of B coefficient for NaCl and FeCl3 during 24 hours of exposure.
0 2 4 6 8 10 12 14 16 18 20 22 24 26 102
103 104 105 106
107 Rn
NaCl Rn FeCl3 Rp FeCl3 Rp NaCl Re sistanc e (
)
Time (hr)Figure 4. Comparison of Rn and Rp for SS304 in NaCl and FeCl3.
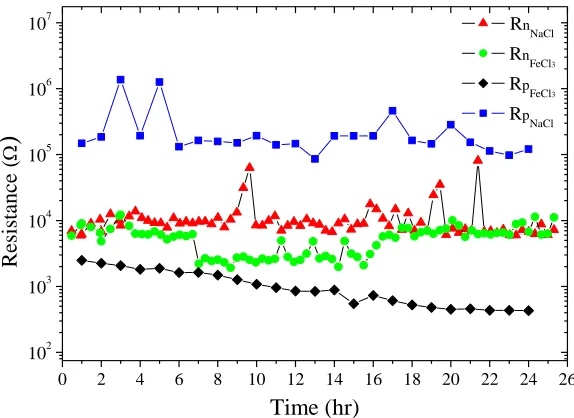
Calculation of B and icorr from Tafel fit allows to determine Rp for corrosion rate estimation. Rp
is compared with Rn (obtained from noise signals) in Figure 4, where the trending of NaCl for Rn and
Rp are above of FeCl3, indicating that SS304 exposed in NaCl is more resistive than FeCl3, whose
resistance tends to decrease with respect the exposition time. This behavior was expected due to the presence of oxidizer Fe3+ ion that increases the corrosive activity of FeCl3 medium and consequently
[image:5.596.155.442.399.608.2]
Figure 5. Time series for SS304 in FeCl3: A)1 hr, B) 12 hr, C) 24 hr and NaCl: D)1 hr, E) 12 hr, F) 24
hr.
Time Series in potential and current, corresponding with 1, 12 and 24 hours are shown in Figure 5. All the data have been treated with wavelet transform to remove DC trend. In Figure 5 A), Time Series of FeCl3 shows a great transient at 450 seconds, related with a decrease in the potential,
WE2 working electrode. Similar localized corrosion process for FeCl3 was reported in reference [25]
where the transients form are similar, however, the values in amplitude change because these have a different magnitude around of 1.0 x 10⁻¹ mA, as a consequent to the FeCl3 concentration differences;
being lower (0.05 M) in the reference [25]. So that the activity of the ions has a big effect in the magnitude of the current noise. Time series corresponding with 12 and 24 hours in FeCl3 Figure 5B)
and C) and E), F) for NaCl develop a group of transients of short time duration (< 2 seconds); this behavior correspond with the metastable pitting process.
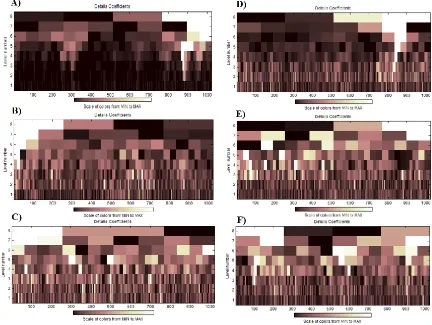
In order to determine the time and the frequency of each transient, the signal decomposition by wavelet transform is presented using the two-dimensional diagram; this kind of representation shows the total of points recorded in time (axis “x”) and the frequency of scale (axis “y”). Each rectangle contains the wavelet coefficient correlated with the original signal, and the quantity in value is represented with a color in gray scale indicating from a minimum to a maximum (black to white). In this context, the two-dimensional diagram for signal noise in current of each time series from figure 5 are shown in Figure 6.
In this representation, most of the energy in the 1 hour for FeCl3 (A) and NaCl (B) are
concentrated in scales d6, d7 and d8 and according with the shape in the transcient observed in the time
series A) in Figure 5. According to Shahidi and collaborator [26] the time scale and frequency correspond with localized corrosion, produced at frequency below of 0.0625 Hz, however, with the 12 and 24 hours was observed a change in the distribution of energy from both solution since the crystals d3, d4 and d5 contains a small part of the energy, this fraction correspond to high frequencies (0.0625
Hz ~ 0.5 Hz) that are reported to uniform corrosion. In this part exist a controversy because the shape of time series indicate that the transients are characteristic for metastable pitting but the number of transients generated suggest that several zones are active on the metal surface suffering oxidation and which is relating with general corrosion, therefore it´s necessary to obtain an average of the energy on each scale (EDP) that will allow to know which mechanism has more weight in these chlorine means.
The EDP of SS304 for both solution is illustrated in Figure 7 where the case for FeCl3, the first
hour shows a maximum of the relative energy ubicated in the d8 following by d7 crystal, this is related
to the largest time scale which correspond with the transient from the time series in Figure 5A). The duration of this transient was more than 32 seconds, but as the time progress, at 12’th hour the behavior of the energy change to d1 crystal with a low persistence in d8 and d7. The predominant
mechanism in small scale was related to uniform corrosion due to the quantity of transients even if each one is related with a metastable pitting; finally, at 24 hour only d1 predominates. At first hour in
Figure 7 B), NaCl exhibit the same behavior as FeCl3 however, at 12 hour there is a competition
between the d1 and d8 crystals, this may be related with pits formation than increase the velocity of the
general mechanisms. At 24 hour the tendency of the relative energy only persists in d1 crystal for both
[image:8.596.54.543.471.671.2]
Figure 6. Two-Dimensional Representation of the coefficients of electrochemical noise current signal for SS304 in FeCl3: A)1 hr, B) 12 hr, C) 24 hr; and NaCl: D)1 hr, E) 12 hr, and F) 24 hr.
Figure 7. EDP Representation of electrochemical noise current signal for 304 in A) FeCl3 and B)NaCl.
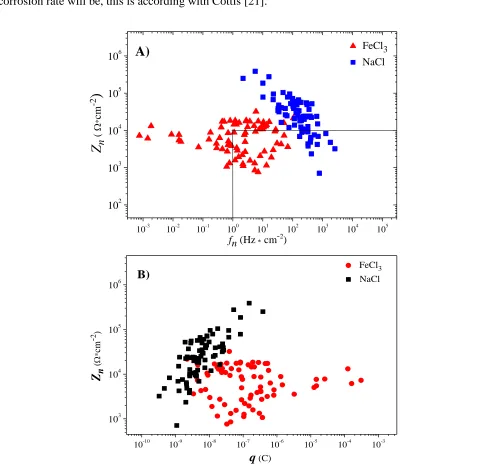
Two representation of corrosion behavior in Figure 8, were built using the parameters of shot noise theory. Here the impedance of noise Zn was plotted in axis “y” while q, and fn were plotted in
axis “x”. In plot A) the maximum characteristic frequency for NaCl is reached arround 1x10³
rate of the phenomenon but not to the frequency that produces a transient as demonstrated in the wavelet decomposition, that´s why to a greater degree of occurrence of the transients, the greater corrosion rate will be, this is according with Cottis [21].
10-3 10-2 10-1 100 101 102 103 104 105
102 103 104 105 106 FeCl3 NaCl
Z
n ( * cm -2)
fn (Hz cm-2)
A)
10-10 10-9 10-8 10-7 10-6 10-5 10-4 10-3 103 104 105 106 Zn ( * cm -2 ) FeCl3 NaCl
q (C) B)
[image:9.596.52.546.114.586.2]
Figure 8. Corrosion behavior plots of SS304. A) Zn vs fn and B) Zn vs q
Hence, those points that coincide with a lower fn correspond to local process while the increase
of fn the corrosion mechanism will be generalized (uniform). In the case for NaCl shows that several
and 1 x 10⁻⁴ , this points are related with the first transients formed at the start of the exposition. Finally the behavior of Zn is correlated with the behavior of resistance (Figure 4) for both solutions.
Figure 9. Metallographic of SS304 exposed in FeCl3; A) 1hr, B)12 hr, C)24 hr and NaCl; D) 1hr, E)12
hr, F)24 hr.
Metallographic evidence of the corrosion mechanism is shown in Figure 9, the optical metallographic was taken according with the times selected for this research-paper. After the first hour figure A) and D) shows the formation of pits in both solution, observed more pitting density in FeCl3
[image:10.596.107.523.123.595.2]
several mechanisms can be overlapping in the formation of a transient in EN signals. After 12 hours, several pits are formed homogenously in both solution B) and E) with a change in color around the pits, corresponding with the general corrosion process. At 24 hours C) and F) was observed the pits grow in number and size (max in radius >40μm), existing a coexistence with the two phenomenon, pitting and general corrosion.
4. CONCLUSIONS
The parameters of shot noise theory are reported for SS304 in two chloride solutions (NaCl and FeCl3) in this experimentation. The behavior of the event charge q and the characteristic frequency fn
have demonstrated being good parameters to identify the start of the pitting process, and even, can differentiate the degree of aggressiveness and corrosion rate between the two solutions.
The impedance of noise Zn, was in correspondence with the magnitude range of in Rp and Rn in
order to prove the viability of the EN with respect the traditional techniques.
Corrosion behavior using the methodology proposed, identified two mechanisms (pitting and general corrosion) that are competing in both solutions in function of exposition time, however, it´s evident that pitting was constantly re passivating according with the data in time series and visual inspection. The values of the frequencies found during the wavelet decomposition together with the energy distribution plots, demonstrated that the predominant corrosion type after 24 h was generalized for both chloride solutions. EDP can function like a fingerprint of the predominant corrosion types.
ACKNOWLEDGEMENTS
The authors thanks to the Center of Research and Technological Development in Electrochemistry, S.C. (CIDETEQ) who supported this research with the scholarship conceded by the National Commission on Science and Technology (CONACYT). Also, thanks to the Autonomous University of the Mexican State (UAEM) for the research project conducted in CU UAEM Valle de Mexico (Laboratory of Electrochemical and Corrosion of industrial materials).
References
1. V. A. Tyagai, N. B. Lukyanchikova, Russ. J. Electrochem., 3 (1967) 316-322. 2. V. A. Tyagai, Russ. J. Electrochem., 10 (1974) 3-24.
3. C. A. Loto, Int. J. Electrochem Sci., 7 (2012) 9248-9270. 4. A. Legat, V. Dolecek, Corros. Sci., 51 (1995) 295-300.
5. G. S. Frankel, L. Stockert, F. Hunkeler, H. Boehni, NACE, 7 (1987) 429-438. 6. T. Zhang, D. Wang, Y. Shao, G. Meg, F. Wang, Corros. Sci., 58 (2012) 202-210. 7. R. M. Souto, G. T. Burstein, Mater. Sci., (1998) 799-806.
8. U. Bertocci, J. Kruger, Surf. Sci., 101 (1980) 608-618.
9. Y. J. Tan, S. Bailey, B. Kinsella, Corros. Sci., 38 (1996) 1681-1695. 10.B. Li, J. Wang, X. Wang, X. Yue, Int. J. Electrochem. Sci., 11 (2015) 1-13.
11.A. Aballe, M. Bethencourt, F. J. B. Pedemonte, M. M. Bárcenas, Electrochim. Acta, 46 (1999) 4805-4816.
13.M. Bethencourt, F. J. B. Pedemonte, M. M. Bárcenas, Rev. Metal., 35 (1999) 384-391. 14.S. Ritter, H. P. Seifert, Werkst. Korros., 64 (2013) 683-690.
15.M. Breimesser, S. Ritter, H. P. Seifert, T. Suter, S. Virtanem, Corros. Sci., 63 (2012) 129-139. 16.M. Leban, A. Legat, V. Dolecek, V. Kuhar, Mater. Sci., (1998) p. 157-162.
17.R.A. Cottis, M. A. Al- Ansari, G. Bagley, A Pettiti, Mater. Sci., (1998) 741-754.
18.D. H. Xia, S. Song, J. Wang, J. Shi, H. Bi, Z. Gao, Electrochem. Commun., 15 (2012) 88-92. 19.D. H. Xia, S. Z. Song, Y. Behnamian, Corros. Eng. Sci. Tech., (2015)1-18.
20.R. A. Cottis, Electrochem. Soc. Proc., 22 (2001) 254-263.
21.H.A. Mazeedi, R.A. Cottis, Electrochim. Acta, 49 (2004) 2787-2793. 22.H. A. Mazeedi, R. A. Cottis, NACE, (2004) 1-10.
23.R. A. Cottis, J. M. S. Amaya, F. J. B. Pedemonte, Corros Sci., 47 (2005) 3280-3299. 24.L. Jian, Z. Huanjun, W. Ke, W. Xuehui, Int. J. Electrochem. Sci., 10 (2015) 931-937. 25.G. Suresh, K. Mudali, Corros. Sci., 70 (2014) 238-293.
26.M. Shahidi, S. M. Hosseini, H. A. Jafari, Electrochim. Acta, 56 (2011) 9986-9997.