on a linear channel model
Abdolhosein Moinian Lina Fagoonee Bahram Honary Lancaster University
Department of Communication Systems Lancaster LA1 4YR, United Kingdom E-mail: [email protected]
Abstract. A symbol detection scheme based on the Viterbi algorithm that simultaneously processes subsets of 2-D data in the presence of Gaussian noise was recently proposed for binary 2-D optical storage 共TwoDOS兲. In the case of multilevel TwoDOS, a straightforward full-fledged maximum likelihood symbol detector, or even the previous Viterbi-based algorithm, is not an ideal solution due to complexity restric-tions. We propose a suboptimum low complexity symbol detector, which still performs within the accepted performance bound for optical storage. We describe the procedures involved in designing and developing a practical symbol detection scheme for multilevel TwoDOS by analyzing the signal values generated by a linear channel model in the presence of Gaussian noise. Our proposed detection scheme exploits the properties of the 2-D data format on the disk, and is flexible enough to accommo-date performance and complexity restrictions for optical storage applications. ©2005 Society of Photo-Optical Instrumentation Engineers.
关DOI: 10.1117/1.2087647兴
Subject terms: detection; optical storage; detector.
Paper 040915R received Dec. 1, 2004; revised manuscript received Mar. 17, 2005; accepted for publication Apr. 5, 2005; published online Oct. 18, 2005.
1 Introduction
A binary 2-D optical storage1 共TwoDOS兲 disk has been developed to increase capacity and data rate with factors of up to 2 and 10, respectively, over “blu-ray disk”共BD, for-merly known as DVR兲 technology2 by developing a new technique of storing data in a 2-D format. Using multilevel techniques over binary TwoDOS, an even higher increase in capacity and data rate can be realized. TwoDOS is based on a so-called broad spiral, along which information is written as a limited number of parallel data rows stacked on each other and arranged in a coherent 2-D format, with no spacing in between the rows. A guard band consisting of one row of known land symbols is located between every two successive revolutions of the broad spiral. The horizon-tal parallel data rows in the broad spiral are arranged in a honeycomb format using hexagonal lattices. The motiva-tion behind the hexagonal structure1 is that it provides a 15% higher packing rate than the ordinary square lattice format.3,4The lattice parameteraHis the distance between the centers of two neighboring lattice cells.
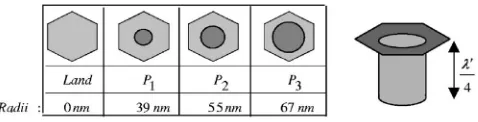
Multilevel TwoDOS is characterized by M level sym-bols, consisting of 1 land symbol, which is the flat reflect-ing surface, andM− 1 pit symbols, whereM⬎2. Symbols are represented by 0 , 1 , . . .M− 1, where 0 represents a land symbol, 1 is the pit symbol with the smallest pit area, and the remaining symbols are arranged in ascending order with
M− 1 representing the pit symbol with the largest area. The pit symbols are mastered as pit holes, each with a unique pit radius, centered within the hexagonal cell that is
avail-able for each symbol. All pits have a fixed phase depth⌽. The reflected light traveling to the bottom of a pit and back out produces a phase depth of⌽= 2共2d/
⬘
兲 with respect to light reflected from the all-land area. ⬘
is the wave-length of the laser light inside the cover layer. For simplic-ity, the phase depth is chosen to be⌽=, which results ind=
⬘
/ 4.In this work, we consider multilevel modulation with four symbols: one land and three pits, P1, P2, and P3, as illustrated in Fig. 1共a兲. The pit radii are chosen such that their areas are linear in the ratio 1:2:3, and the maximum pit area covers 50% of the total hexagonal cell area to avoid signal folding.5We consider 11 parallel rows in the broad spiral and a lattice parameter aH= 182 nm. The readout channel is simulated in the form of a linear channel model, which has a 2-D low-pass filter characteristic and is based on the Braat-Hopkin’s formula.6,7This model has been ex-tended to a 2-D function for binary6 and multilevel TwoDOS.8 The readout channel is characterized by inter symbol interference 共ISI兲 and Gaussian noise. The signal-processing path from photodetector signals to detected symbols comprises a cascade of signal processing blocks similar to that proposed for binary TwoDOS.9
The work is structured as follows. Section 2 describes the linear channel model. In Sec. 3, signal patterns gener-ated by the channel model are described, the summation-grouping method is presented as an efficient way of group-ing identical types of signal values to simplify the process of symbol detection, and we summarize results of a statis-tical analysis of the signal values to determine thresholds for the initialization of our symbol detection scheme. The proposed low complexity symbol detection scheme is
sented in Sec. 4. The scheme is validated by simulation results in Sec. 5, and we show that we achieve the perfor-mance expected for optical storage applications.10,11 Con-clusions of this study are given in Sec. 6.
2 Linear Channel Model
The linear channel model is simple from a signal process-ing point of view, because it is less complex in comparison with nonlinear signal processing models such as the vector diffraction model12or the scalar diffraction model.13 How-ever, the linear model does not take into account nonlinear effects such as pit asymmetry. We make the following valid assumptions: 1. linear ISI has a relatively higher influence than nonlinear contributions, and 2. a precompensation it-eration process7 located in the write channel is able to re-move the effect of nonlinear ISI.
Traditionally, in 1-D optical storage 共CD, DVD, and BD兲, readout channels are often simulated by a linear model,14 which is characterized by its modulation transfer function共MTF兲as derived in the Braat-Hopkin’s formula.6 For the purpose of TwoDOS, the formalism is extended to the 2-D character,5,8as expressed in Eq.共1兲. The MTF has a low-pass behavior with a hard cutoff frequency beyond which no information is transferred and is given by vc = 2NA/. Parameter is the wavelength of the laser beam andNAis the numerical aperture of the objective lens in the optical pick-up unit. These parameters are chosen to be the same as for BD specifications,2 i.e., = 405 nm and NA
= 0.85. Parametervis the spatial frequency of the informa-tion on the disk and is the azimuth in the 2-D spatial frequency plane. The 2-D MTF is shown in Fig. 2, wherevc is normalized to 1. The amplitude of the 2-D MTF function decreases monotonically from dc to the cutoff frequency and is circularly symmetric around the amplitude axis, which is similar to a 2-D cone with radius corresponding to thevc.
H2D共v,兲
=
冢
2
再
arccos冉
v vc冊
− v vc
冋
1 −
冉
v vc冊
2
册
1/2冎
v艋vc
0 v⬎vc
冣
共1兲 0艋艋2.
In a 2-D lattice, each symbolSis uniquely identified by its position j in shell i. The symbol valueSi,j is assigned the value 0, 1, 2, and 3 forland, P1,P2, andP3, respectively. These symbol valuesSi,j are modulated to bipolar values, using generic Eq.共2兲, as input to the linear channel model for any value ofM艌2, which is equivalent to at least one pit.
Si,jb =M− 1 − 2Si,j. 共2兲
ForM= 4, we assume the areas of pit symbols are lin-early related in the ratio 1:2:3, and the amplitude of the signal waveform diffracted from a pit is linearly dependent on the area of the pit. The highestSi,jb value is associated with the land case, where almost 共taking residual ISI into account兲all light is reflected from the plane of information on the disk. Each pit symbol is assigned a value indicative of its relative pit area.
The symbol-synchronous signal waveform Ii,j is ob-tained as the linear convolution of the bipolar symbol value
Si,jb and the impulse response function共IRF兲of the channel, denoted by wi, also referred to as “tap values.” The tap values are computed as the Fourier transform of the MTF13 given by Eq.共1兲. Each shell is assigned one tap value be-cause all symbols in that shell have the same distance from the center due to the symmetry of the hexagonal lattice. The calculation Ii,j, is shown in Eq. 共3兲, where Ns is the total number of shells that lie inside the laser spot;Ni de-notes the number of cells in thei’th shell.
Ii,j=
兺
i=0 Ns再
wi⫻兺
j=1 NiSi,j b
冎
. 共3兲
In Table 1, the normalized tap values共with respect to the central tap value兲 and their distances from the center as a factor ofaHare shown. As expected, the first shell has the maximum tap value. However, unlike the linear trend in the MTF, the tap values do not decrease monotonously as the distance, which is a factor of lattice parameter aH = 182 nm, from the center increases. This phenomenon is explained by the airy characteristic15 of the Fourier trans-form of the MTF.
3 Signal Patterns
3.1 Readout Data Patterns
During readout, each laser spot is centered on one cell but may also cover a number of neighboring cells due to the relatively small size of the cell with respect to the laser spot. This implies that when the spot scans a symbol, part of the reflected light is formed by diffraction of the light
Fig. 1 Four-level TwoDOS symbols within a hexagonal cell and relative pit radii:共a兲surface view and共b兲section view.
[image:2.612.304.545.58.285.2] [image:2.612.43.282.60.121.2]from neighbor cells. This is the cause of ISI in TwoDOS. By increasing the data density, i.e., choosing smaller aH, more cells lie within the laser spot, which in turn results in a higher ISI.
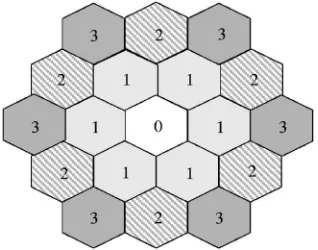
The distance of the neighbors from the central cell af-fects the contribution of ISI from each neighbor. These neighbors can be grouped in shells, where each shell con-sists of a number of cells all with an identical distance from the central cell. As illustrated in Fig. 3, symbols in a shell are indexed with respect to their distance from the center labeled 0; nearest neighbors indexed 1 belong to the first shell, symbols in the second shell are indexed with 2, and so on. The central symbol and its six nearest neighbors in the first shell form a cluster.
3.2 Signal Levels
Tap values are a measure of ISI contribution from each shell surrounding the central symbol. As shown in Table 1, symbols in the first shell are the dominant source of ISI, being closest to the central symbol. The signal values for the proposed medium, using the model just described, are
identified by a plot of signal values for the complete set of all possible clusters. The total number of cluster permuta-tionsNTis 47or 16,384.
The indexing for signal values is based on the number and position of pits in the first shell. The normalized signal values for the 16,384 permutations are shown in Fig. 4. Indexing is given as a function of the cluster indices共CN兲:
CN= 46·S0,0+
兺
j=1 6关S1,j· 4共j−1兲兴. 共4兲 There are four distinct sections: cluster numbers 1 to 4096 represent clusters with a common central land symbol; and cluster numbers 4097 to 8193 represent clusters with a common central symbol P1, etc. In each section, indexing starts with the cluster with the least pit area共all-land clus-ter兲and increases with pit area until the largest pit area with sevenP3’s in the cluster is reached.
3.3 Summation Grouping
The area of neighboring pits determines the amount of lin-ear interference. As established before, the first shell is con-sidered to be the dominant source of ISI. By choosing the radii of the pits, such that their respective areas become linearly related, for a fixed central symbol, all clusters with the same overall pit area in the first shell will have almost similar signal values, so they can be grouped together. The mean of signal values of each group is referred to as a signal level.
Definition 1.LetNp3,Np2, andNp1 denote the number of pitsP3,P2, andP1, respectively, in the first shell. Group
GS0,0,jis asummation group, where all clusters with symbol
S0,0in the center are related as follows:
3 ·Np3+ 2 .Np2+ 1 ·Np1=j for 0艋j⬍19. 共5兲 The 16,384 clusters can be grouped according to Definition 1, yielding 19 signal levels per section, as shown in Fig. 5. The indexing in each section starts with the smallest pit area in the first shell 共j= 0; six lands兲 and ends with the largest pit area in the first shell 共j= 18; six P3’s兲. For
ex-0 0.00 1.00000
1 1.00 0.27005
2 1.73 −0.00159
3 2.00 −0.00323
4 2.65 0.01068
5 3.00 0.00672
6 3.46 −0.00356
7 3.60 −0.00086
8 4.00 0.00267
Fig. 3 Distribution of hexagonal cells in shells around the central symbol.
[image:3.612.304.544.61.241.2] [image:3.612.41.281.81.282.2] [image:3.612.82.241.591.716.2]ample, three members ofG0,3withS0,0= 0 could have in the first shell: three adjacent P1 and three land symbols, three
P1 symbols each separated with a land symbol, or one P3 symbol and five land symbols.
3.4 Probability Distribution
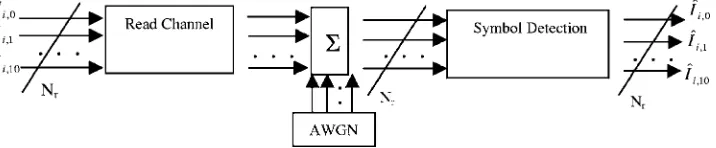
In general each signal value varies due to the ISI from the outer shells 共second shell, third shell, etc.兲 and additive white Gaussian noise共AWGN兲, which is introduced by the optical channel, as shown in the system model in Fig. 6. In the presence of AWGN with SNR= 25 db, and simulating ISI contributions from two outer shells, the overall prob-ability distribution for four-level TwoDOS is shown in Fig. 7. Three threshold levels, T1, T2, and T3, are used in the symbol detection algorithm to initialize symbol values, e.g., the most likely symbol for the normalized signal values between 0 and 0.3 island, and in the case of normalized signal values between 0.3 and 0.5, the most likely symbol isP1, etc.
4 Symbol Detection
To determine a suitable symbol detection scheme for the multilevel TwoDOS linear channel model, we address the complexity and performance tradeoffs. Considering a broad spiral withNrrows for the four-level TwoDOS, a straight-forward full-fledged Viterbi symbol detector requires 4共k−1兲Nrnumber of states, wherekis the number of symbols in the tangential direction per state in the Viterbi detector. As an example, for the model that we considered in this work 共one central tap and six nearest neighbor taps兲, we have that k= 3. Thus, when using a meta-spiral with Nr
= 11, there will be 422 states in the Viterbi trellis. This is clearly impractical from a hardware point of view. To re-duce the complexity of the maximum likelihood detection scheme, Viterbi-based algorithms that simultaneously pro-cess multiple rows from a set of 2-D data have been proposed,16,17 and the complex problem of performing symbol detection over a meta-spiral is broken down into a number of bit detectors, each processing along a set of adjacent tracks. Similar work was developed for binary TwoDOS as a stripe wise Viterbi detector共SWD兲.18 How-ever the complexity of the SWD for multilevel TwoDOS has prompted us to suggest a less complex scheme that exploits the properties of the multilevel 2-D readout chan-nel.
The proposed detection method compares the channel readout with the signal levels obtained by summation grouping of the linear model output. If two clusters with different central symbol values have similar signal values, there will be a difference between the sum of their nearest neighbors. In other words, the central symbol value can be detected based on its signal value and estimating the sum of its nearest neighbors to determine the closest cluster match, which is addressed later. An example was illustrated in Fig. 5 for the normalized signal value of 0.57, which could cor-respond to clusters from groupsG0,14,G1,9,G2,5, andG3,0.
4.1 Sliding Window Patterns and Corresponding Detection Algorithms
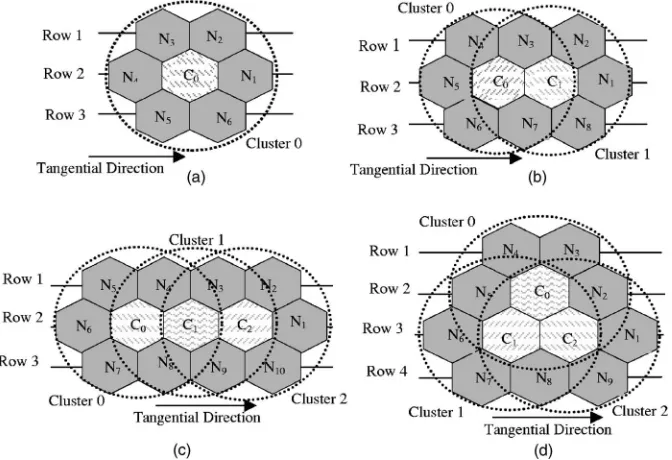
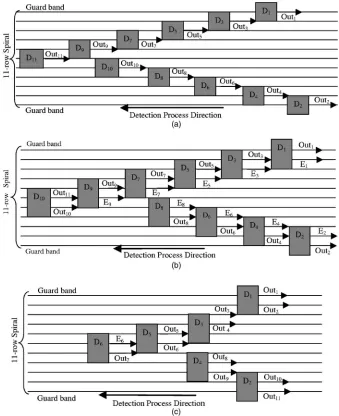
The sliding window pattern consists of a limited number of adjacent cells grouped to include a number of central sym-bols surrounded by their nearest neighbors, as shown in Fig. 8. In the detection scheme, the central symbol共s兲 is
Fig. 5 Signal levels after summation grouping, showing four pos-sible clusters with the same signal level of 0.57.
Fig. 6 The block diagram of the overall system.
[image:4.612.306.545.60.216.2] [image:4.612.45.282.61.232.2] [image:4.612.117.475.651.725.2]共are兲updated according to the sum of their nearest neigh-bors. Four different window patterns are proposed. In Fig. 8共a兲, patternAconsists of a cluster; in Fig. 8共b兲, pattern B
consists of two central symbols surrounded by eight nearest neighbors; in pattern C, as shown in Fig. 8共c兲, there are three central symbols and ten nearest neighbors, whereas patternD, as shown in Fig. 8共d兲, consists of three central symbols and nine nearest neighbors. For patternsA,B, and
C, symbol detection can be performed by shifting the slid-ing window pattern along three adjacent data rows in the tangential direction and updating the central symbol val-ue共s兲via the detection algorithm, which is explained in the next section. Pattern D is spread over four rows, and the symbols in the two middle rows are updated.
We refer to the block performing symbol detection for a number of rows within the sliding window pattern as a detector. WithNr= 11, as shown in Fig. 9共a兲, ten detectors
D1,D2, . . .D10, using one of the patternsA,B, orC, operate on the broad spiral from the outer rows toward the middle row of the spiral. The input to each detector consists of the signal values on three adjacent rows. The output sequence consists of an updated estimate for the symbol values in the middle row, i.e., row 2.Outirepresents the output for each detector Di. The two outer detectors D1 and D2 use the known symbols in the guard band, and together with the other two input rows per detector, provide an updated esti-mate for their output rowsOut1andOut2respectively.Out1 andOut2are used as extrinsic information for the next set of detectors,D3 andD4, to provide the next set of output rows,Out3andOut4. The procedure is repeated for the rest of the detectors.
The detection algorithm for patternDis slightly differ-ent because the pattern is spread over four rows. Each de-tector Di receives symbol values from four rows as input and provides the estimated information for the two middle rows, rows 2 and 3, as an output sequence. Two different configurations are illustrated in Figs. 9共b兲 and 9共c兲. The
first configuration uses ten detectors, which are shifted by one row toward the middle of the spiral. As a result, only one of the outputs of each detector provides the final esti-mated output per iteration, i.e.,Eifrom detectorDiis over-written by Outi+2 of the next detector, Di+2, as shown in Fig. 9共b兲. In the second configuration, detectors are shifted by two rows toward the middle of the broad spiral, and both outputs are considered as the final estimated output per it-eration, as in Fig. 9共c兲. In the last detector, because of the odd number of rows,Out6overwritesE6. The combination of the detectors forms a V-shaped detection algorithm
共VDA兲along the broad spiral.
4.2 Symbol Detection
As the iterative nature of the symbol detection algorithm suggests, each VDA can operate one after the other along the direction of the broad spiral, and each of them forms an iteration of the total symbol detection process.
Prior to the first iteration, all cells are initialized with the highest probable symbol value by using threshold detec-tion, based on the probability of each central symbol as explained in Sec. 3. Four reference values,RfS0,0, are de-fined per cell. For each central symbol S0,0, RfS0,0 is the sum of the nearest neighbors in clusters of the relevant summation groups. Using the example of Fig. 5, based on the normalized signal value of 0.57, the reference levels are
Rf0= 14, Rf1= 9, Rf2= 5, and Rf3= 0. If no summation group was available for a certain symbol, the detector re-turns an out-of-range flag such as −1.
For pattern type A, each of the 11 detectors updates its central symbol and shifts one cell along the detection pro-cess. To update the central symbol, four distancesd0l,d1l,d2l, andd3l are calculated as in Eq.共7兲. At thel’th iteration,SC0 is the sum of the six nearest neighbors共N1. . .N6兲, andC0is
[image:5.612.126.462.62.292.2]the central cell symbol value. The central symbol is up-dated with the symbol value, which results in the smallest
dC
0 l
.
dC0 l
=共SC0−RfC0兲2 forC0= 0,1,2,3. 共6兲 For pattern type B, considering all different combinations of C0 and C1, two sets of distances are calculated,
dcluster 0l 共C0,C1兲 and dcluster 1l 共C0,C1兲 for 0艋C0,C1艋3, where each set consists of 16 distances due to all possible combinations ofC0andC1.
dcluster 0l 共C0,C1兲=共SC0−RfC0兲2 for 0艋C0,C1艋3, 共7兲
dcluster 1
l 共
C0,C1兲=共SC1−RfC1兲2 for 0艋C0,C1艋3. 共8兲
SC0is the sum of the symbol values of the nearest neighbors incluster0共N3. . .N7andC1兲.SC1is the sum of the symbol
values of the nearest neighbors incluster 1 共N1. . .N3, N7,
N8, andC0兲.SC0andSC1are both dependent on the symbol values ofC0andC1. Central symbol valuesC0 andC1 are updated by the respective DminB 共C0,C1兲, as shown in Eq.
共9兲:
DminB 共C0,C1兲= min关dcluster 1
l 共
C0,C1兲
+dcluster 0l 共C0,C1兲兴 for 0艋C0,C1艋3. 共9兲 After each central symbol update, the window shifts one or two cells in the tangential direction, and the detector up-dates the symbols of the entire row. In this work, the results for one shift are presented.
In the case of pattern typesCandD, three central sym-bol values, C0, C1, and C2 are updated. Each symbol is respectively located in the center ofcluster0,cluster1, and
cluster 2, respectively, as shown in Figs. 8共c兲 and 8共d兲. Therefore, three sets of distances, dcluster 0l 共C0,C1,C2兲,
[image:6.612.122.461.60.476.2]cluster 0 0 0
共10兲
dcluster 1l 共C0,C1,C2兲=共SC1−RfC1兲2 for 0艋C0,C1,C2艋3,
共11兲
dcluster 2l 共C0,C1,C2兲=共SC2−RfC2兲2 for 0艋C0,C1,C2艋3.
共12兲
SC0, SC1, andSC2 are the sum of the symbol values of the nearest neighbors incluster0, cluster1, andcluster2, re-spectively, and they are all dependant on the symbol values ofC0,C1, and C2, respectively. Central symbol valuesC0,
C1, andC2are updated by the respectiveDminC,D共C0,C1,C2兲, as shown in Eq.共13兲:
DminC,D共C0,C1,C2兲= min关dcluster 1
l 共
C0,C1,C2兲 +dcluster 0l 共C0,C1,C2兲 +dcluster 2l 共C0,C1,C2兲兴
for 0艋C0,C1,C2艋3. 共13兲 After the central symbol update, the sliding window shifts one cell in the direction of the detection process, and the updating process is repeated.
5 Simulation Results
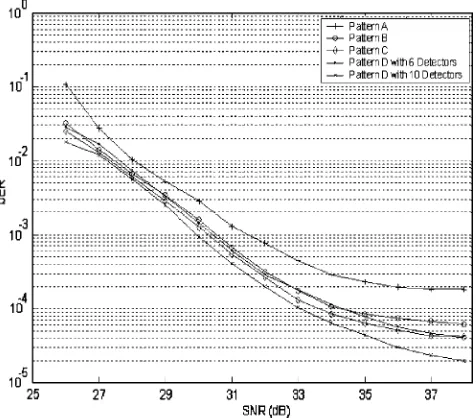
Typically, the limit of the error correction code in optical storage applications is about 4⫻10−3 byte error rate
共BER兲, as in the BD disk.19 For random errors with inde-pendent symbol error events in a byte, the BER corre-sponds to a bit error rate共bER兲of 5⫻10−4. This is because an error correction decoder is assumed to correct the re-maining errors at the output of the symbol detector.
In Fig. 10, the relative performance of the four types of sliding window patterns in the presence of AWGN is shown. Preliminary results from the experimental TwoDOS device for binary TwoDOS suggest an operation point with a signal-to-noise ratio 共SNR兲 of 32 dB. At this operation point, patternsA,B,C, andD共with ten detectors兲, provide bERs of 7.6⫻10−4, 3.1⫻10−4, 2.7⫻10−4, and 2⫻10−4, re-spectively, using seven iterations for the detection process. The relative performance of the first three configurations is indicative of the number of extrinsic symbol probabilities being considered, where pattern A with only six extrinsic symbols has the worst performance, and patternChas ten extrinsic symbols. Owing to its 2-D sliding window con-figuration, where the distance between extrinsic and central symbols is smaller, pattern D outperforms pattern C, al-though it has only nine extrinsic symbols. Pattern Dwith ten detectors outperforms the same pattern with six detec-tors, because more extrinsic information is generated by VDAs shifting by one row as opposed to two rows for the latter case. Any of these four patterns can be used
depend-ing on the processdepend-ing complexity and memory tradeoffs with respect to performance.
[image:7.612.307.545.62.271.2]In Fig. 11, the performances for up to seven iterations over AWGN of SNR= 32 dB are represented. After five it-erations, the performance curve saturates to an error floor, and further detection iterations do not significantly improve the performance. Based on the MTF characteristics, the ISI contribution to the signal values measured at the central symbol is most significant from cells in the first shell. Re-ferring to Fig. 4, some signal values correspond to contri-butions from up to all four central symbol values. Hence, during the detection process, it eventually becomes impos-sible to distinguish between symbol values, where their dis-tances based on the symbol detection scheme are very close. This mainly contributes to the saturation of the per-formance curve.
Fig. 10 bER performance for all window patterns共seven iterations兲.
[image:7.612.307.545.534.725.2]6 Conclusions
We address the complexity restrictions imposed on symbol detection for multilevel TwoDOS using readout data gener-ated by a linear channel model. We describe in detail the steps involved in developing a low complexity symbol de-tection scheme with acceptable performance for multilevel TwoDOS. The readout channel is simulated using a simple 2-D linear channel model based on the Braat-Hopkin’s for-mula. The resulting signal levels, after the process of sum-mation grouping to identify clusters with same overall pit area, are exploited to construct a symbol detection scheme that satisfies the optical storage performance requirements with relatively much lower complexity than a maximum-likelihood Viterbi-based algorithm. The symbol detection scheme is iterative, and we present four variations of the iterative algorithm based on how adjacent 共vertically and horizontally兲clusters exchange extrinsic information via a sliding windows operation. Results comparing the four con-figurations are presented in the presence of Gaussian noise. We also observe that performance improves with an in-creasing number of iterations, up to a certain point where the performance improvement between iterations is insig-nificant. The detector can be accompanied by a robust error correction scheme that will eliminate any remaining detec-tion errors at the output of the symbol detector.
Acknowledgments
This work was a part of a “TwoDOS” project, funded by the European Commission with project number IST-2001-34168. All project members are acknowledged for their valuable contribution to this work.
References
1. W. M. J. Coene, “Two dimensional optical storage,”Opt. Data Stor-age Conf. (ODS) Tech. Digest,Proc. SPIE5069, pp. 90–92 共May 2003兲.
2. B. Stek, R. Otte, T. Jansen, and D. Modrie, “Advanced signal pro-cessing for the blu-ray disc system,”Tech. Digest, ISOM/ODS,IEEE Electronic Library, pp. 263–265共2002兲.
3. W. Weeks and R. E. Blahut, “The capacity and coding gain of certain checkerboard codes,”IEEE Trans. Inf. Theory44, 1193–1203共1998兲. 4. T. Kato, S. Taira, T. Maeda, Y. Katayama, and T. Nishiya, “Two-dimensional run length-limited code and partial response maximum likelihood system with multitrack recording,”Intl. Symp. Opt. Mem. Opt. Data Storage, Tech. Digest,IEEE Electronic Library, pp. 51–53 共2002兲.
5. A. H. J. Immink, W. M. J. Coene, A. M. van der Lee, C. Busch, A. P. Hekstra, J. W. M. Bergmans, J. Riani, S. J. L. v. Beneden, and T. Conway, “Signal processing and coding for two-dimensional optical storage,”GLOBECOM’037, 3904–3908共Dec. 2003兲.
6. J. Braat, “Read-out of optical discs,” inPrinciples of Optical Disc Systems, pp. 7–87, Adam Hilger Ltd, Bristol共1985兲.
7. H. Hieslmair, J. Stinebaugh, T. Wong, and M. O’Neill, “34 GB multilevel-enabled rewritable system using blue laser and high-NA optics,”Joint Intl. Symp. Opt. Mem. Opt. Data Storage Tech. Dig.,
IEEE Electronic Library, pp. 7–9,共2002兲.
8. A. Moinian, L. Fagoonee, B. Honary, and W. M. J. Coene, “Linear channel model for multilevel two dimensional optical storage,” in
Proc. 7th Intl. Symp. Commun. Theory Applications, published by HW Communications Limited, pp. 352–356共2003兲.
9. L. Fagoonee, A. Van Der Lee, A. Moinian, B. Honary, and W. Coene, “Experimental characterization for the binary two-dimensional opti-cal storage channel,” presented at IEEE Intl. Conf. Commun.共ICC4兲, Paris, France, 20–24 June 2004.
10. K. Kiyono, T. Hashizume, and M. Horie, “Application of multi-level recording with growth-dominant material to CD and blue DVR gen-erations,”Joint Intl. Symp. Opt. Mem. Opt. Data Storage Tech. Di-gest,IEEE Electronic Library, pp. 66–68共2002兲.
11. H. Hieslmair, J. Stinebaugh, T. Wong, M. O’Neill, M. Kuijper, and G. Langereis, “34GB multilevel-enabled rewritable system using blue laser and high-numeric aperture optics,”Jpn. J. Appl. Phys., Part 1
42共2B兲, 1074–1075共Feb. 2003兲.
12. J. Pasman, “Vector theory of diffraction,” inPrinciples of Optical Disc Systems, Chap. 3, pp. 88–124, E. R. Pike, Adam Hilger, Bristol, UK共1985兲.
13. W. M. J. Coene, “Nonlinear signal-processing model for scalar dif-fraction in optical recording,” Appl. Opt. 42共32兲, pp. 6525–6535 共Nov. 2003兲.
14. S. G. Stan, “The CD-ROM drive: A brief system description,” Chap. 2, Kluwer, Boston共1998兲.
15. E. Hetch,Optics, Addison-Wesley Publishing, Reading, MA共1987兲. 16. J. F. Heanue, K. Gurkan, and L. Hesselink, “Signal detection for page-access optical memories with intersymbol interference,”Appl. Opt.35共14兲, 2431–2438共May 1996兲.
17. C. L. Miller, B. R. Hunt, M. A. Neifeild, and M. W. Marcellin, “Binary image reconstruction via 2-D Viterbi search,”Proc. Intl. Conf. Image Process.1, 181–184共1997兲.
18. A. P. Hekstra, W. M. J. Coene, and A. H. J. Immink, “Refinements of multitrack Viterbi bit-detection,” Accepted in publication: IEEE Trans. Magn., SPS-30, 2005.
19. T. Narahara, S. Kobayashi, M. Hattori, Y. Shimpuku, G. van den Enden, J. Kahlman, M. van Dijk, and R. van Woudenberg, “Optical disc system for digital video recording,”Jpn. J. Appl. Phys., Part 1
39共2B兲, 912–919共2000兲.
Abdolhosein Moinianreceived his BSc in electrical engineering from Sharif University of Technology共Iran兲, and MSc on mobile and personal radio communications from Lancaster University United Kingdom共UK兲 in 2000 and 2002, respectively. He is doing his PhD on signal processing and coding for optical storage, and has been a research associate at Lancaster University since 2002. His research interests include signal processing, error control coding, channel estimation and modeling, and wireless communications.
Lina Fagooneereceived her BEng共hons兲 in electronic communications engineering and PhD in multifunctional turbo receiver design based on partial unit memory codes from Lancaster University in 1999 and 2003, respectively. She was a research as-sistant from 1999, and was then offered a research associate共2002兲position at Lan-caster University to work on signal process-ing and codprocess-ing for optical storage. She cur-rently works as a lecturer in the Department of Communication Systems at Lancaster University. Her general re-search interests include error control coding, channel estimation and modeling, signal processing optical/magnetic storage, and wireless communications. She has published more than a dozen papers in channel estimation and modeling for 2-D optical storage, turbo and woven turbo codes based on partial unit memory codes, and signal processing in radio communication channels. She is a member of the IEE and IEEE, and is a student liaison officer of the IEEE chap-ter for information theory for the UK and Republic of Ireland.