Int. J. Electrochem. Sci., 8 (2013) 8502 - 8512
International Journal of
ELECTROCHEMICAL
SCIENCE
www.electrochemsci.org
Enhanced Low Temperature Performance of LiFePO
4Cathode
with Electrolyte Modification
Borong Wu 1, Yonghuan Ren 1, Daobin Mu1,*, Cunzhong Zhang1, Xiaojiang Liu2, Feng Wu1
1
Beijing key laboratory of Environment Science and Engineering, School of Chemical Engineering and Environment, Beijing Institute of Technology, Beijing 100081, China.
2
Institute of Electric Engineering, China Academy of Engineering Physics, Mianyang 621900, China.
*
E-mail: [email protected]
Received: 20 April 2013 / Accepted: 11 May 2013 / Published: 1 June 2013
Electrolyte conductivity and solid electrolyte interphase (SEI) film are two key factors that affect the low temperature performance of LiFePO4 battery. In this work, the enhancement of conductivity is
realized through optimizing the proportion of solvents by mass triangle model. SEI modification is achieved by adding film-forming agent of Li2CO3 in the high conductivity electrolyte of LiPF6
-EC/PC/EMC (0.14/0.18/0.68). For LiFePO4 electrode, 51.5% of its room temperature capacity is
delivered at -30○C with the addition of 4% Li2CO3 in the electrolyte. As XPS measurement verified,
the Li2CO3 precipitates on the electrode surface hinder electron transfer more efficiently and suppress
electrolyte reaction further. Moreover, lithium ion migration within this phase is speeded up with the help of Li vacancies in Li2CO3.
Keywords: electrolyte modification, lithium carbonate, mass triangle model, lithium iron phosphate, low temperature
1. INTRODUCTION
The phospho-olivine LiFePO4 material is currently under extensive studies due to its merits of
long life, excellent thermal stability and high specific capacity of 170 mAh g−1. Despite these features, the electrochemical performance of LiFePO4 cathode is found to be less impressive at high
charge/discharge rate and low temperature. The drawbacks are caused by the intrinsically poor ionic and electronic conductivities of LiFePO4 with a unique olivine structure as Amin and Ouyang et al
[1~3] pointed out. Therefore enhancing mass transport of Li+ is crucial to improve the capability of this material, especially at high rate and low temperature. The approaches to modify LiFePO4 cathode
other is electrolyte optimization. The most used methods for material modification are carbon coating [4,5], doping [6], nanocrystallization [7,8] and preferential growth of crystals [9]. Electrolyte optimization is concerned recently for its facile process and commercialization. It’s reported that modifying solid electrolyte interphase (SEI) through electrolyte composition change is a way to improve the low temperature performance of LiFePO4 electrode [10]. As temperature drops down, the
migrations of lithium ions across the electrolyte and the interphase on active material are all increasingly hindered. Herein, the study on electrolyte conductivity and SEI film to ease the migration are of quite importance for LiFePO4 performance improvement at low temperature.
Ethylene carbonate (EC)/ propylene carbonate (PC)/ ethyl methyl carbonate (EMC) were adopted as solvents according to the merits of each carbonate: high dielectric constant of EC (89.6), low melting point (-48.8 °C) of PC and superior viscosity (0.65 mPa s-1) of EMC. But there should be a compromise in the proportion of each solvent to obtain a high conductivity electrolyte. Mass triangle model was introduced to optimize the conductivity of lithium hexafluorophosphate (LiPF6
)-EC/PC/EMC (x/y/z, wt%) [11]. SEI film was modified with the addition of vinylene carbonate (VC) and Li2CO3 which are well known film forming additives for Li-ion battery [12,13]. Charge/discharge
tests and cyclic voltammetry(CV) were conducted to examine the electrochemical performance of LiFePO4 electrode in the electrolyte of EC/PC/EMC with VC or Li2CO3 additive . A big improvement
is expected to fulfill on the LiFePO4 electrode performance at low temperature so that its application
could be extended to a wide temperature range.
2. EXPERIMENTAL
LiFePO4 material was obtained from Reshine New Materials Co., Ltd., China and used without
further modification. Its particle was in a size of 200-400 nm, having a carbon coating in a thickness around 5 nm. The electrode was prepared by spreading slurry of LiFePO4 powder (80wt%), graphite
(10wt%) and polyvinylidene fluoride (PVDF, 10wt%, dissolved in 1-methyl-2-pyrrolidinone) onto an aluminum foil. It was dried at 80 °C for 20 h under vacuum prior to assembly. CR2025 coin cells were fabricated with lithium sheet as the counter electrode in an Ar-filled glove box. Ternary carbonate electrolytes with different EC/PC/EMC proportions were perpared in the glove box. The proportion of the solvent in each ternary electrolyte “No.1” to “No.10” was: (0.11, 0.59, 0.30), (0.12, 0.38, 0.50), (0.14, 0.18, 0.68), (0.25, 0.11, 0.64), (0.38, 0.12, 0.50), (0.39, 0.27, 0.34), (0.38, 0.39, 0.23), (0.24, 0.54, 0.22), (0.30, 0.30, 0.40), (0.25, 0.25, 0.50), respectively. The ratio values were determined according to the principle of conductivity forecast [14] by mass triangle modelling. 1wt% VC (Xianghe kunlun chemical products Co., LTD, China) or 4wt% Li2CO3 (99.9%, Aladdin Chemistry
Co. Ltd, China) was used as electrolyte additive. Li2CO3 was hardly dissolved in the solvent, the
modified electrolyte was used in the form of a homogeneous suspension.
Charge-discharge measurement was performed on CT2001A Land tester(Wuhan Jinnuo
Electronics Co., Ltd.). After charged at 34 mA g-1 under room temperature, coin cells were preserved
impedance spectroscopy (EIS) (100 Hz to 0.1 MHz, 5 mV perturbation) method. It’s calculated by equation κ=K/R. Here, R represents the impedance value tested through EIS. K is the conductivity coefficient of the conductivity meter. κ is conductivity. Exchange current density was calculated from j0=10(-a/b), a and b are the intercept and the slope of tafel curve, respectively. A polarization potential of
100 mV was applied on LiFePO4 electrode which had been charged for 5 h under 17 mA g-1 to ~3.425
V and left for 10 h to obtain a steady potential without any change in 100 s, i.e. 50% SOC(state of charge), to exert tafel plot test at 0.1 mV s-1. CV, EIS and tafel plot test were performed using a CHI660c electrochemical station (Shanghai Chenhua Co. Ltd). A constant tempearture chamber (Wuxi Suoyate Testing Equipment Co., Ltd., China) was used to maintain the desired temperature with an error of ±0.5 ○C.
After electrochemically cycled in various electrolytes for 10 times to delithiation state at room temperature, LiFePO4 electrodes were disassembled from the coin cells and dried in vacuum before
XPS or XRD tests. No solvent washing was adopted to keep the Li2CO3 precipitates on the electrode
surface from washing away. XPS measurement was conducted on a PHI QUANTERA-II SXM system (Japan / Uivac-PHI, INC), using a monochromatised MgKα radiation source. The calibration of the peak position was made by recording XPS spectra of the graphite peak at 248.3 eV as the reference for the final adjustment of the energy scale. XRD test was carried out using X-ray diffractometer with a Cu Kα radiation source at a scan rate of 8○min-1, with 2θ from 10○ to 80○. The wavelength of the Cu Kα radiation used was 0.15406 nm. HOMO and LUMO energies of the matters on the surface were calculated with B3LYP density functional theory method in conjunction with the 6-31+G (d,p) basis set using Gaussian 09 package.
3. RESULTS AND DISCUSSION
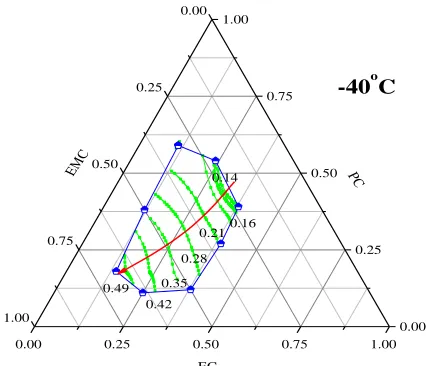
The conductivities of electrolytes “No.1” to “No.10” were tested from 20 ○
C to -40 ○C. The relationship between conductivity logarithm and temperature reciprocal is depicted in Fig.1. As shown in the curve, the conductivity of electrolyte “No.3” is the highest among the ten electrolytes, especially at -20 ○C and -40 ○C. But, the value is just limited in the ten samples. Mass triangle model was adopted to find out the highest conductivity through forcasting the conductivity of EC/PC/EMC system. The modelling was proceeded in a fixed area (shown in Fig.2) as the forcasting region because the electrolyte inside the region can guarantee the proper performance for electrode [14]. The changing tendency of conductivity as a function of solvent proportion at -40 ○C is clearly seen in the forcasting region, which grows with EC decresing and EMC increasing. The highest value reaches about 0.49 mS cm-1 in the lower left part of the forecasting region where the composition of electrolyte “No.3” is conincidently located. Therefore, No.3 (1 mol L-1 LiPF6-EC/PC/EMC = 0.14/0.18/0.68) is verified to
0.0033 0.0036 0.0039 0.0042 -4.0
-3.5 -3.0 -2.5 -2.0
-40oC -20oC
0oC
lo
g
(
S
c
m
-1 )
1/T (oC) 1
2
3
4
5
6
7
8
9
10
[image:4.596.157.412.91.284.2]20oC
Figure 1. The relationships between conductivity logarithm and temperature reciprocal for electrolytes from “No.1” to “No.10”.
0.00 0.25 0.50 0.75 1.00
0.00
0.25
0.50
0.75
1.00
0.00 0.25 0.50 0.75 1.00
-40oC
0.14
0.16 0.21
0.28
0.35
0.42
PC
EM
C
EC 0.49
Figure 2. Calculated result at -40 °C according to mass triangle model (mS cm-1). (the arrow indicates the increasing direction of conductivity).
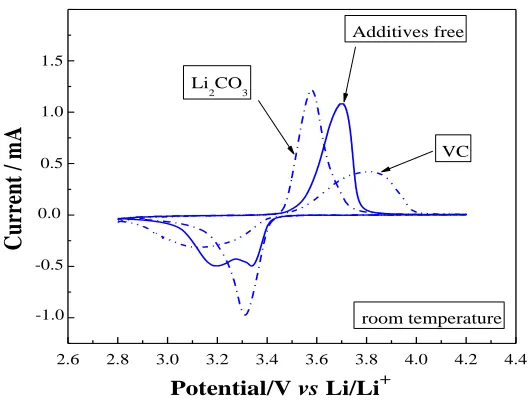
Under room temperature, cyclic voltammograms of the LiFePO4 electrodes in 1 mol L-1 LiPF6
-EC/PC/EMC (0.14/0.18/0.68) (No.3) without and with additive (VC or Li2CO3) are displayed in Fig.3.
Compared with the additive free condition, the polarization of lithiation/delithiation is increased by the addition of VC in the electrolyte. The peak intensities become much lower, too. As a well known film-forming additive, VC doesn’t behave well as reported upon some else cathodes [15, 16]. This result is consistent with the work of Ouatani [17] who also found VC did not make positive effect on LiFePO4
electrode. In contrast to the VC-added case, Li2CO3 addition plays an active role according to the
[image:4.596.176.389.360.543.2]
2.6 2.8 3.0 3.2 3.4 3.6 3.8 4.0 4.2 4.4
room temperature
-1.0 -0.5 1.5
1.0
0.5
0.0
VC Additives free
Li
2CO3
C
u
rr
en
t
/ m
A
[image:5.596.159.424.93.294.2]Potential/V vs Li/Li+
Figure 3. CV of LiFePO4 electrode in 1mol L-1 LiPF6/EC/PC/EMC (No.3) without and with additive
(VC or Li2CO3) at a sweep rate of 0.1 mV s-1 (the 2nd cycle, at room temperature)
[image:5.596.172.408.533.713.2]Similarly, the weakened polarization phenomena also happen at low temperature, as shown in Fig.4. When Li2CO3 is added in the low temperature electrolyte, the reductive peak is shifted from 2.9
V to 3.0 V and the oxidative peak from 3.9 V to 3.8 V compared to the additive free condition. The potential difference of lithiation/delithiation is reduced by 200 mV in the presence of Li2CO3.
Reversely, a negative effect appears with the addition of VC, as indicated in Fig.4. Much lower peak intensities and larger potential difference between delithiation (4.2 V) and lithiation (2.7 V) peaks are generated. Li2CO3 performs apparently superior to VC as electrolyte additive in this work. So, further
efforts are done on the electrolyte modification with Li2CO3-additive to examine its contribution on the
low temperature performance of LiFePO4 electrode.
2.4 2.8 3.2 3.6 4.0 4.4 4.8 additive free
VC Li
2CO3
0.6
-0.4 0.4
-0.2 0.2
0.0
C
u
rr
en
t
/ m
A
Potential / V vs Li/Li+ 0.2 mV s-1
2.6-4.8 V -20 oC
Figure 4. Cyclic voltammograms of LiFePO4 electrode in 1 mol L-1 LiPF6/EC/PC/EMC (No.3)
The discharge ability of the electrode in Li2CO3 added/free electrolytes was examined at low
temperatures. The electrodes were first charged to 4.2 V at room temperature prior to the testing. Under -20 ○C, the capacity increase is observable in the presence of Li2CO3, with a small increment
(Fig.5(a)). At -30 ○C in Fig.5(b), the discharge capacity of the electrode is only 47.2 mAh g-1 in the base electrolytewhen the discharge potential falls down to 2.5 V. However, the specific capacity of the electrode rises by 63.6% to 77.2 mAh g-1 in the addition of Li2CO3, i.e., 51.5% of its room temperature
capacity (150 mAh g-1) is delivered at -30 ○C. The potential difference between the two discharge curves is finally enlarged to 610 mV at the point showing in Fig5(b) (2.5 V and 3.11 V for the 0% and 4% Li2CO3 cases, respectively). It is indicated that the polarization of the electrode reaction is lowered
with the addition of Li2CO3. Clearly, the electrolyte additive of Li2CO3 can modify the electrochemical
performance of LiFePO4 electrode at low temperature.
0 10 20 30 40 50 60 70 80 90 100 110 2.4
2.6 2.8 3.0 3.2 3.4
3.6 Discharge to 2.5V at -20 oC
P
ot
en
ti
al
/
V
vs
L
i/
L
i
+
Capacity / mAh g-1
0% Li2CO3 4% Li2CO3
a
0 10 20 30 40 50 60 70 80 2.4
2.6 2.8 3.0 3.2 3.4 3.6
0% Li
2CO3
4% Li
2CO3
b
610mV
(2.50V)
77.2mAh g-1
Discharge to 2.5V at -30oC
P
ot
en
ti
al
/
V
vs
L
i/
L
i
+
Capacity / mAh g-1
47.2mAh g-1
[image:6.596.115.472.288.413.2](3.11V)
Figure 5. Discharge curves of LiFePO4 in the electrolytes with 0% and 4% Li2CO3 at -20 ○C (a) and
-30 ○C (b). (17 mA g-1, cutoff potential: 2.5 V)
Charge transfer resistance (Rct) is believed to be essential factor that associates with the low
temperature performance of LIB. Small Rct corresponds to big exchange current density (j0) according
to the equation j0=RTF −1
Rct −1
. In this paper, the j0 of LiFePO4 electrode reaction was applied to judge
the Rct under the condition with Li2CO3 addition at various temperatures. As shown in Table 1, the
exchange current densities are almost the same for the three electrolytes at room temperature, but the difference is enlarged as the temperature drops down. Especially at -40 ○C, the value in the presence of 4% Li2CO3 is 2.6 and 7.3 times as high as that of the additive free electrolyte and the conventional
electrolyte (LiPF6-EC/DMC(1/1)) (CE). The much lower value of j0 for CE can be related to the
electrolyte crystallization happened at -40 ○C. The crystallization severely hinders the mobility of Li+ through the electrolyte, causing a dramatic drop of electrolyte conductivity, which also affects the charge transfer rate at the electrolyte/electrode interphase. The application of EC/PC/EMC (0.14/0.18/0.68) solvent system avoids the crystallization and obtains a high j0 value of 3.69×10⁻⁷ A
cm-2. Furthermore, the value is enhanced from 3.69×10⁻⁷ A cm-2 to 9.68×10⁻⁷ A cm-2 with the addition of Li2CO3. So the impedance for the charge to transfer is decreased and the electrochemical reactivity
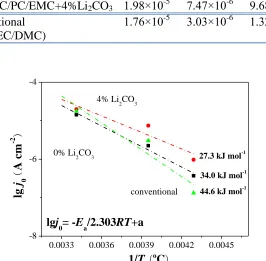
of the electrode is increased in the presence of Li2CO3 at low temperature. Activation energy (Ea) for
from the Arrhenius equation lg(j0)= f(T−1) (Fig.6). However, for the electrolyte containing 4% Li2CO3,
the slope for the lg(j0)= f(T−1) line gives the Ea of ca. 27.3 kJ mol−1 which is smaller than its Li2CO3
-free counterpart with the value of 34.0 kJ mol−1.This result implies that the Li2CO3 additive can lower
reaction barrier in the interphase between electrolyte and electrode. The improved performance of LiFePO4 is ascribed to the weakened polarization and the small activation energy for the charge
transfer process.
Table1. Exchange current densities of LiFePO4 electrode in various electrolytes (A cm-2)
electrolytes 20 °C -20 °C -40 °C
LiPF6/EC/PC/EMC+0%
Li2CO3
1.42×10⁻⁵ 2.25×10⁻⁶ 3.69×10⁻⁷
LiPF6/EC/PC/EMC+4%Li2CO3 1.98×10⁻⁵ 7.47×10⁻⁶ 9.68×10⁻⁷
Conventional (LiPF6/EC/DMC)
1.76×10⁻⁵ 3.03×10⁻⁶ 1.32×10⁻⁷
0.0033 0.0036 0.0039 0.0042 0.0045 -8
-6 -4
44.6 kJ mol-1 27.3 kJ mol-1
34.0 kJ mol-1
lgj0= -Ea/2.303RT+a
conventional 0% Li2CO3
4% Li
2CO3
lg
j 0
(
A
c
m
-2 )
1/T(o
C)
Figure 6. Arrhenius plots for exchange current density (j0) obtained from measurement results in
Table.1
Little morphology difference can be found in the scanning electron microscopy (SEM) images of the LiFePO4 electrode cycled in the electrolyte with/without Li2CO3. The component on LiFePO4
electrode was investigated by XPS further. Fig.7 reveals various species on the cathode surface in both 0% and 4% Li2CO3 addition cases. Intensities of C-O bond (286.4 eV) and C=O bond (289.8 eV)
decrease with the addition of Li2CO3, as C1s spectra implied. The result is also consistent with the C-O
and C=O peaks at 533.5 eV and 531.5 eV in O1s spectra. Additionally, O1s spectra show a strong peak of CO2- at 532.4 eV. The major peaks in F1s spectra represent LiF(685.0 eV) and PVDF(687.6 eV) for
the Li2CO3-free case. However, C-F2 peak at 688.2 eV dominates the spectra in the Li2CO3-added case,
[image:7.596.170.436.263.524.2]
P2p spectra contains the peaks of LixPOyFz (134.2 eV), OPF3(135.6 eV), LixPFy(137 eV). The peak
intensity of OPF3 is higher in the 4% Li2CO3 case. Tasaki et al [22] also detected the existence of OPF3
through 19F-NMR method. OPF3 may come from the decomposition of LiPF6 and the product of
reactions among Li2CO3, RCO2Li and PF5 according to equations (1) to (4).
LiPF6+H2O→LiF+OPF3+2HF (1)
PF5+H2O→OPF3+2HF (2)
Li2CO3 +PF5→OPF3+ 2LiF+ CO2 (3)
RCO2Li+ PF5→RCOF+ LiF +OPF3 (4)
140 138 136 134 132 130 128 0
1500 3000
OPF3
LixPFy
LixPOyFz P2p Binding energy/eV 0 1500 3000 OPF3 P2p
LixPFy LixPOyFz
0 800 1600 2400 C1s C-O C=O C-C
292 290 288 286 284 282 0 800 1600 2400 C=O C1s C-C PVDF C-O Binding energy/eV 0 % L i2 CO 3
692 690 688 686 684 682 0 4000 8000 12000 PVDF LiF F1s Binding energy/eV 0 4000 8000 12000 F1s C-F2 LiF PVDF
536 534 532 530 528
0 4000 8000 12000 C=O Binding energy/eV C-O O1s 0 4000 8000 12000
CO2
-O1s
C-O C=O 4
% L i2 CO 3 Inten sit y / a .u . Inten sit y / a .u .
140 138 136 134 132 130 128 0
1500 3000
OPF3
LixPFy
LixPOyFz P2p Binding energy/eV 0 1500 3000 OPF3 P2p
LixPFy LixPOyFz
0 800 1600 2400 C1s C-O C=O C-C
292 290 288 286 284 282 0 800 1600 2400 C=O C1s C-C PVDF C-O Binding energy/eV 0 % L i2 CO 3
692 690 688 686 684 682 0 4000 8000 12000 PVDF LiF F1s Binding energy/eV 0 4000 8000 12000 F1s C-F2 LiF PVDF
536 534 532 530 528
0 4000 8000 12000 C=O Binding energy/eV C-O O1s 0 4000 8000 12000
CO2
-O1s
C-O C=O 4
[image:8.596.107.495.245.432.2]% L i2 CO 3 Inten sit y / a .u . Inten sit y / a .u .
Figure 7. XPS spectra for delithiated LiFePO4 electrode after cycled in the electrolyte containing 4%
(top) and 0% (bottom) Li2CO3.
The species containing C-O and C=O bonds are ascribed to the decomposition product of alkyl carbonate solvents during the insertion/extraction of lithium ion. However, the contents of these matters decrease upon adding 4% Li2CO3 based on their low intensities in the XPS spectra, which
confirm that decomposition of the alkyl carbonate solvents is suppressed. Li2CO3 was reported to be
less conductive for electrons because of its wide forbidden band gap [23]. Reasonably, it is supposed that the low intensity of C-O and C=O may be caused by the formation of Li2CO3-contained interphase
which is of better prohibitive to electronic conduction on the LiFePO4 surface to suppress solvents
decomposition.
As a Lewis acid, PF5 displays a strong acidity as indicated by a very low LUMO energy level
in Table 2. In the presence of Li2CO3, PF5 is more likely to react with Li2CO3 rather than RCO2Li
since the HOMO energy of Li2CO3 (-0.24051 Hatree) is closer to the LUMO energy of PF5 (–0.04904
Hatree). Thereby, RCO2Li is less consumed and remains much in the case of Li2CO3 addition. The
existence of RCO2Li can also be verified by the high intensity of the peak CO2- at 532.4 eV in O1s
Table 2. HOMO and LUMO energies of the species on the electrode surface
chemicals HOMO(Ha) LUMO(Ha)
PF5 -0.43941 -0.04904
Li2CO3 -0.24051 -0.03660
RCO2Li CH3CO2Li -0.26120 -0.03762
CH3CH2CO2Li -0.26122 -0.03743
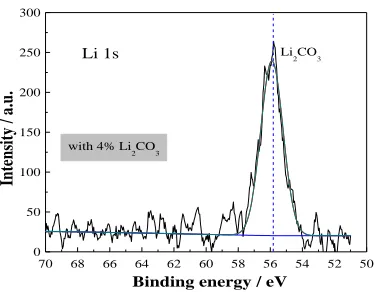
XPS Li1s spectra in Fig.8 indicate that Li2CO3 is detectable on the surface of LiFePO4
electrode cycled in the electrolyte with Li2CO3 additive. XRD test was also conducted on the LiFePO4
electrode which had the same charge/discharge history with the one in XPS analysis. Li2CO3 is found
[image:9.596.200.387.325.471.2]according to the peaks of (111) and (2 02) at 30.0○ and 30.5○ in the Li2CO3-added case, as seen in
Fig.9.
70 68 66 64 62 60 58 56 54 52 50
0 50 100 150 200 250 300
In
te
n
si
ty
/
a
.u
.
with 4% Li
2CO3
Li
2CO3 Li 1s
[image:9.596.200.389.524.685.2]Binding energy / eV
Figure 8. Li1s XPS spectra of LiFePO4 electrode cycled in the electrolyte with 4% Li2CO3.
10 20 30 40 50 60 70 80
Pristine LiFePO4
cycledLiFePO
4, no Li2CO3additive
cycledLiFePO
4, with Li2CO3 additive
* *
(1
1
1
)
In
te
n
si
ty
(a
rb
.
u
n
it
)
(2
0
2
)
2θ(degree)
Li2CO3pattern (PDF:65-6329)
10 20 30 40 50 60 70 80
Pristine LiFePO4
cycledLiFePO
4, no Li2CO3additive
cycledLiFePO
4, with Li2CO3 additive
* *
(1
1
1
)
In
te
n
si
ty
(a
rb
.
u
n
it
)
(2
0
2
)
2θ(degree)
Li2CO3pattern (PDF:65-6329)
Figure 9. The XRD pattern of pristine LiFePO4 and the electrode (delithiated state) cycled in the
Actually, some white precipitates were clearly visible on the cathode surface as well when the coin cell was disassembled in the experiment. The energy barrier for single lithium ion diffusion in Li2CO3 is close to (or even somewhat lower than) that of its diffusion in bulk graphite according to
DFT calculation [23]. Li2CO3 is thought a superior medium for Li+ migration since the diffusion is
very fast in Li2CO3 with the help of Li vacancies. So, lithium ion migration through the interphase is
facilitated generating a decreased electrode polarization at low temperature as tested above (Fig.5). The modified SEI film hinders electron transport and facilitates lithium ion migration, leading to less electrolyte decomposition and faster lithiation/delithiation reactivity. As a result, the low temperature performance of LiFePO4 electrode is improved with the SEI film modification together
with the electrolyte conductivity enhancement. Li2CO3 is hence a potential electrolyte additive for
LiFePO4 battery to widen its application.
4. CONCLUSIONS
An optimized solvent proportion of EC/PC/EMC (0.14, 0.18, 0.68) is obtained for a low temperature electrolyte (1 mol L-1 LiPF6) with high conductivity by mass trangle modelling. The
discharge capacity of 77.2 mAh g-1 for LiFePO4 electrode is achieved at -30 ○C with 4% Li2CO3
additive in the electrolyte of LiPF6-EC/PC/EMC (0.14, 0.18, 0.68). Li2CO3-contained interphase is
formed on the LiFePO4 electrode cycled in the electrolyte with Li2CO3. The modified SEI film
effectively hinders the electron transport due to the wide forbidden band gap of Li2CO3, and facilitates
lithium ion migration with the help of Li vacancies in Li2CO3. Electrolyte decomposition reaction is
also suppressed by the Li2CO3-contained interphase. Consequently, the electrochemical performance
of LiFePO4 electrode is improved with the weak polarization and the low activation energy for the
charge transfer process in the presence of Li2CO3 which is considered a most positive component in
the SEI film and a potential electrolyte additive.
ACKNOWLEDGEMENTS
This project was financially supported by the National 973 Program (Grant No. 2009CB220100) and the National 863Program (2013AA050903) of China, the National Natural Science Foundation of China (3100021501101) and Ministry of Science and Technology (MOST) of China, US-China Collaboration on cutting-edge technology development of electric vehicle (2010DFA72760).
References
1. R. Amin, P. Balaya and J. Maier, Electrochem. Solid-State Lett. 10 (2007) A13.
2. 2. C.Y. Ouyang, S.Q. Shi, Z.X. Wang, X.J. Huang and L.Q. Chen, Phys. Rev. B, 69 (2004) 1. 3. C.Y. Ouyang, S.Q. Shi, Z.X. Wang, H. Li, X.J. Huang and L.Q. Chen, J. Phys. Condens. Matter.,
16 (2004) 2265.
4. A. Yamada, S.C. Chung and K. Hinokuma, J. Electrochem. Soc., 148 (2001) A224. 5. H.C. Shin, W.I. Cho and H. Jang, Electrochim. Acta, 52 (2006) 1472.
7. A.S. Aricò, P. Bruce, B. Scrosati, J.M. Tarascon and W.V. Schalkwijk, Nat. Mater., 4 (2005) 366. 8. S. Ferrari, R.L. Lavall, D. Capsoni, E. Quartarone, A. Magistris, P. Mustarelli and P. Canton, J.
Phys. Chem. C, 114 (2010) 12598.
9. M.S. Islam, D.J. Driscoll, C.A.J. Fisher and P.R. Slater, Chem. Mater., 17 (2005) 5085.
10.D.P. Abraham, J.R. Heaton, S.H. Kang, D.W. Dees and A.N.J. Jansen, J. Electrochem. Soc., 155 (2008) A41.
11.J.Y. Huang, B.T. Yu, F.S. Li and W.H. Qiu, Int. J. Miner. Metall. Mater., 16 (2009) 463. 12.Y.X. Wang and P.B. Balbuena, J. Phys. Chem. B, 106 (2002) 4486.
13.D. Aurbach, Y. Ein-Eli, B. Markovsky, A. Zaban, S. Luski, Y. Carmeli and H. Yamin, J. Electrochem. Soc., 142 (1995) 2873.
14.Y.H. Ren, B.R. Wu, D.B. Mu, C.W. Yang, C.Z. Zhang and F. Wu, Chem. Res. Chin. Univ., 29 (2013) 116.
15.K. Sato, L.W. Zhao, S. Okada and J. Yamaki, J. Power Sources, 196 (2011) 5617.
16.X.R. Zhang, R. Kostecki, T.J. Richardson, J.K. Pugh and P.N. Ross, J. Electrochem. Soc., 148 (2001) A1341.
17.L.El Ouatani, R. Dedryvère, C. Siret, P. Biensan and D. Gonbeau, J. Electrochem. Soc., 156 (2009) A468.
18.A.J. Gmitter, I. Plitz and G.G. Amatucci, J. Electrochem. Soc., 159 (2012) A370. 19.K. Xu, Chem. Rev., 104 (2004) 4303.
20.Y.K. Sun, J.M. Han, S.T. Myung, S.W. Lee and K. Amine, Electrochem. Commun., 8 (2006) 821. 21.D. Aurbach, B. Markovsky, A. Rodkin, E. Levi, Y.S. Cohen, H.J. Kim and M. Schmidt,
Electrochim. Acta, 47 (2002) 4291.