Int. J. Electrochem. Sci., 7 (2012) 5122 - 5132
International Journal of
ELECTROCHEMICAL
SCIENCE
www.electrochemsci.orgStudy on Heparin Determination Using Cathodic Stripping
Voltammetry
Robert Piech*, Beata Paczosa-Bator, Katarzyna Goleń
Faculty of Materials Science and Ceramics, AGH University of Science and Technology, 30-059 Krakow, al. Mickiewicza 30, Poland
*
E-mail: [email protected]
Received: 26 February 2012 / Accepted: 21 May 2012 / Published: 1 June 2012
The new method based on simple electrolytes applied for the determination of heparin traces using differential pulse cathodic stripping voltammetry (DP CSV) is presented. The effects of various factors such as: preconcentration potential and time, pulse height, step potential and supporting electrolyte composition are optimized. For the HMDE with the surface area of 1.45 mm2 the detection limit for the preconcentration time of 120 s is 1.1 µg·l-1
(borate buffer + NaCl) and 1.7 µg·l-1 (HCl + NaCl). The repeatability of the method at the concentration level of the analyte as low as 100 μg/l expressed as RSD is 1.6% (borate buffer + NaCl) and 1.1% (HCl + NaCl), n = 5. The proposed method was successfully applied and validated by studying the recovery of heparin from spiked drug samples.
Keywords: Heparin; Drugs; Trace Analysis; Cathodic Stripping Voltammetry
1. INTRODUCTION
Heparin is a member of the glycosaminoglycan (GAG) family. It is a polydisperse mixture of sulfonated linear polysaccharides consisting of 1–4 linked and variously modified uronic acid and D-glucosamine repeating disaccharide subunits [1]. In medicine heparin is often used as anticoagulant and antithrombotic agent used in surgical procedures and therapeutically to prevent blood coagulation [2]. Thus a sensitive method of determining heparin is necessary for studying presence of heparin in various medical drugs.
green [21], on its interaction with neutral red [22], on its interaction with light green [23], on interaction with crystal violet [24], or voltammetry with rotating glassy carbon electrode coated with a plasticized PVC membrane [25,26] was also applied to the determination of heparin.
In this work differential pulse cathodic stripping voltammetry (DP CSV) is applied for the trace heparin determination. The presentation of the optimized methodology of the voltammetric determination of heparin in simple electrolytes is the main purpose of this paper.
2. EXPERIMENTAL
2.1 Measuring apparatus and software
A multipurpose Electrochemical Analyzer M161 with the electrode stand M164 (both MTM-ANKO, Poland) were used for all voltammetric measurements. The classical three-electrode quartz cell, volume 20 ml, consisting of hanging mercury drop electrode, as the working electrode, a double junction reference electrode Ag/AgCl/KCl (3M) with replaceable outer junction (3 M KCl) and a platinum wire as an auxiliary electrode. Stirring was performed using a magnetic bar rotating at approximately 500 rpm. All experiments were carried out at room temperature. The MTM-ANKO EAGRAPH software enabled electrochemical measurements, data acquisition and advanced processing of the results.
2.2 Chemicals and glassware
All reagents used were of analytical grade: HCl (Merck, Suprapur), mercury GR for polarography (Merck), borate buffer (0.1 M, pH 9.1) was prepared from Di-sodium tetraborate decahydrate (POCh, Poland) and sodium hydroxide (Merck, Suprapur), 10 mg·ml-1 standard stock solution of heparin was prepared by dissolving the heparin sodium salt from bovine intestinal mucosa (Fluka). Solutions with lower heparin concentrations were made daily by appropriate dilution of the stock solution, Prior to use, glassware was cleaned by immersion in a 1:10 aqueous solution of HNO3, followed by copious rinsing in distilled water.
2.3 Standard procedure of measurements
experimental parameters were as follows: step potential, 5 mV; pulse potential, 50 mV; time step potential, 20 ms (10 ms waiting + 10 ms sampling time). The measurements were carried out from deaeratedsolutions.
2.4 Sample preparation Heparin gel
For DP CSV heparin determination in gel samples a 1 g of the sample was taken directly into volumetric flask (10 ml) and filled up to the mark with double distilled water. Next diluted sample was taken into voltammetric vessel and determination was carried out.
Heparin injective
For DP CSV heparin determination in heparin injective drug a 0.1 g of the sample was taken directly into volumetric flask (10 ml) and filled up to the mark with double distilled water. Next diluted sample was taken into voltammetric vessel and determination was carried out.
3. RESULTS AND DISCUSSION
3.1 Composition of Supporting Electrolyte
[image:3.596.114.453.410.677.2]
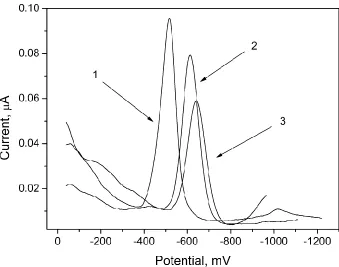
Cathodic stripping voltammetric techniques are appropriate for measuring traces of heparin. As the supporting electrolyte following solutions were examined: ammonium buffer, borate buffer, K2CO3, NaCl, HCl, and mixture (borate buffer with NaCl and HCl with NaCl). Voltammograms obtained for selected supporting electrolytes are presented in Fig.1.
For further study the mixture of borate buffer + NaCl and HCl + NaCl was chosen.
3.2 Influence of supporting electrolyte concentration on heparin peak
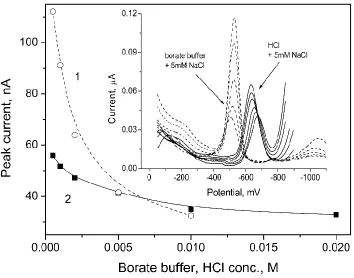
In Figure 2, the dependence of peak current on borate buffer + 0.005 M NaCl and HCl + 0.005 M NaCl concentration is presented.
Figure 2. Dependence of the peak current on supporting electrolyte concentration: (1) – borate buffer + 5 mM NaCl, (2) – HCl + 5 mM NaCl for 1 mg·l-1 heparin and obtained voltammograms. All other conditions as in Figure 1.
For a 0.0005 M borate buffer (+ 5 mM NaCl) the observed heparin peak current was 112 nA and decreased with more borate buffer concentration, e.g. for 0.01 M borate buffer concentration the heparin peak current was 32 nA. For further measurements, the concentration of 0.001 M (pH 9.1) was chosen as optimal for peak height (~90 nA), buffer capacity and solution conductivity.
[image:4.596.109.463.278.556.2]
peak height (~50 nA), molarities of electrolyte (the same as for borate buffer) and solution conductivity.
The heparin peak potential, changed to negative values for higher HCl concentrations. For example, for an HCl of 0.0005 M the peak potential was 630 mV and for an HCl of 0.02 M the peak potential was 675 mV, it may be caused by electrostatic forces between heparin and HCl (for borate buffer practically no peak potential changes was observed). The peak half width of the heparin signals were 72 mV (for alkaline conditions) and 94 mV (for acidic conditions). The obtained precision for n=5 was 1.6% for alkaline conditions and 1.1% for acidic conditions. The parameters of the linear growth of peak current vs. surface of working electrode with heparin concentration 1mg·l-1
for borate buffer are: slope, 59.1 ± 0.4 [nA·mm2], intercept 2.6 ± 1.4 [nA] and correlation coefficient r = 0.999 and for HCl are: slope, 32.7 ± 0.3 [nA·mm2], intercept 2.2 ± 1.3 [nA] and correlation coefficient r = 0.999. For further study, the 1.45 mm2 surface area was applied.
3.3 Influence of DPV technique parameters on heparin peak
The important parameters of the DPV technique are pulse potential (ΔE), step potential (Es), waiting time (tw) and sampling time (ts). Consequently, these parameters were investigated. The best results were obtained for a pulse potential of 50 mV (the peak current for borate buffer was ~90 nA and for HCl was ~50 nA). Higher pulse amplitude (>50 mV) caused major distortion of the peak. For negative pulse amplitude respectively peak currents were similar but higher background currents were observed. For further work, the pulse amplitude of 50 mV was applied.
Changes of the step potential cause influence on peak current. The best results were obtained for the step potential of 5 mV.
The waiting and sampling time changes cause the major influence on the peak current. The best results were obtained for waiting time and sampling time of 10 ms, and this was the value chosen for further work.
3.4 Influence of preconcentration potential and time on heparin peak
Influence of preconcentration potential and time are always important factors on the sensitivity and detection limit of the method. Optimal preconcentration potential for heparin determination in 0.001 M borate buffer + 0.005 M NaCl is in the range from 175 mV to 50 mV and for the determination in 0.001 M HCl + 0.005 M NaCl is in the range from 100 mV to 250 mV (Fig. 3). For preconcentration potentials lower and higher than mentioned ranges, the heparin peak decreased. For further work, a 20 mV preconcentration potential was applied for both supporting electrolytes.
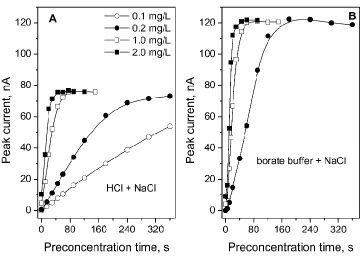
The changes in magnitude of the heparin peak current vs. preconcentration time are presented in Figure 4.
~120 nA and for HCl ~75 nA. The effect is caused by the covered surface of the working electrode by heparin (Fig.5).
Figure 3. Dependence of the peak current on preconcentration potential in the range from 175 to –475 mV for 1 mg·l-1 heparin in (1) – 0.001 M borate buffer + 0.005 M NaCl (pH 9.1), (2) – 0.001 M HCl + 0.005 M NaCl (pH 3.0). All other conditions as in Figure 1.
[image:6.596.147.433.130.355.2] [image:6.596.117.478.440.696.2]
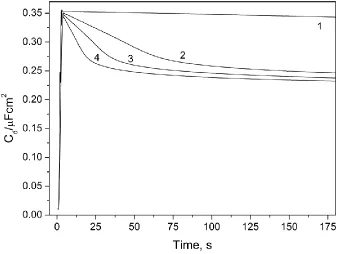
Figure 5. Cd-t curves for different concentrations of heparin: (1) – 0 mg·l-1; (2) – 0.5 mg·l-1; (3) – 1 mg·l-1; (4) – 2 mg·l-1 in 0.001 M borate buffer and 0.005 M NaCl (pH 9.1). AC impedance technique: signal amplitude 10 mV peak-to-peak, frequency 0.05 kHz. The electrode polarization potential –20 mV, stirring rate 500 rpm.
The method is based on the measurements of the capacity Cd of the double layer in relation to time [27]. The measurement of capacity was carried out in the potential of maximum adsorption of heparin (–0.02 V). The differential capacity for various heparin concentration riches its minimum in the moment of maximum coverage of the working electrode and the time of coverage is released to the time preconcentration (upper limit of the peak current).
3.5 Interferences
[image:7.596.114.453.74.328.2]
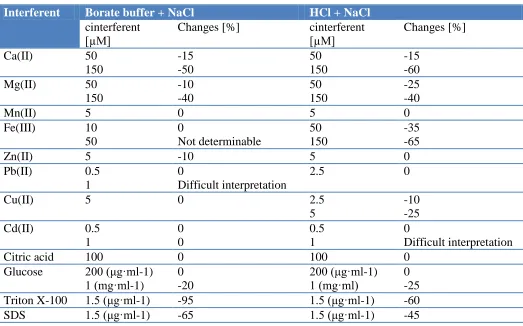
Table 1. The influence of foreign substances on the determination of 1.0 mg·l-1 heparin
Interferent Borate buffer + NaCl HCl + NaCl
cinterferent [µM]
Changes [%] cinterferent [µM]
Changes [%]
Ca(II) 50
150 -15 -50 50 150 -15 -60
Mg(II) 50
150 -10 -40 50 150 -25 -40
Mn(II) 5 0 5 0
Fe(III) 10
50 0 Not determinable 50 150 -35 -65
Zn(II) 5 -10 5 0
Pb(II) 0.5
1
0
Difficult interpretation
2.5 0
Cu(II) 5 0 2.5
5
-10 -25
Cd(II) 0.5
1 0 0 0.5 1 0 Difficult interpretation
Citric acid 100 0 100 0
Glucose 200 (μg·ml-1) 1 (mg·ml-1) 0 -20 200 (μg·ml-1) 1 (mg·ml) 0 -25
Triton X-100 1.5 (μg·ml-1) -95 1.5 (μg·ml-1) -60
SDS 1.5 (μg·ml-1) -65 1.5 (μg·ml-1) -45
3.6 Analytical performance
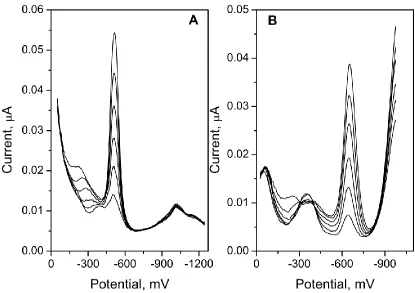
The DP CSV calibration voltammograms of heparin for borate buffer and HCl are presented in Figure 6. For a short preconcentration time (30 s) the obtained detection limit, for borate buffer is 4.2 µg·l-1
and for HCl is 4.9 µg·l-1. A longer preconcentration time results in a better detection limit. For example, for a preconcentration time of 120 s the detection limit is 1.1 µg·l-1 and 1.7 µg·l-1 respectively. The slopes for regression lines (for preconcentration time 30; 60; 120 s) are [nA·µg·l-1
]: 0.085 ± 0.002; 0.163 ± 0.003; 0.322 ± 0.004 (borate buffer) and 0.055 ± 0.0005; 0.114 ± 0.001; 0.220 ± 0.002 (HCl), the correlation coefficients: 0.998; 0.999; 0.998 (borate buffer) and no worse than 0.999 (HCl) respectively. The proposed method have better detection limit in simple base electrolyte with recent published voltammetric results e.g. 0.13 mg·l-1 [29], 0.08 mg·l-1 [30], and 0.44 mg·l-1 [31].
What interesting, the linear range of the method can be calculate for every preconcentration time. Assume that current intensity depends on preconcentration time in a linear way; the limit of linear response can be determine from Fig. 4. The maximum value of the peak current for which the linear increase of heparin signal was observed is equal to 110 nA for borate buffer and 65 nA for HCl. The equation obtained for borate buffer is as follow: y=0.00266(±0.00005)x + 0.00261(±0.00314), for simplify we can assume that a=0:
[image:9.596.90.505.71.364.2]
Figure 6. DPCSV calibration voltammograms obtained for 100; 200; 300; 400; 500; 600 µg·l-1 heparin and preconcentration time of 30 s in (A) 0.001 M borate buffer + 0.005 M NaCl, (B) 0.005 M HCl + 0.005 M NaCl. All other conditions as in Figure 1.
Table 2. Results of heparin determination in the medical gels and heparin injective samples.
[image:9.596.98.496.472.649.2]Heparin added [I.U.]*
Heparin found x s (recovery, %) [I.U.]*; {borate buffer}
Medical gel 1 Medical gel 2 Heparin injective 3
0 247.9 22 1070 ± 93 4938 ± 178
{4903 ± 224} 130 393 28
(104)
- -
260 538.4 37 (106)
1317 111 (99)
-
520 - 1638 135
(103)
5567 191 (102) {5369 219} (99) *
1 mg heparin = 130 I.U. [28] 1
– product declared 250 I.U. g-1 2
– product declared 1000 I.U. g-1 3
– product declared 5000 I.U. ml-1
65=0.00182*tacc[s]*cheparin[µg·l-1 ]
The medical samples, spiked with heparin were analyzed according to the described procedure. Determinations of heparin were performed using the standard addition method. Results from heparin determination are presented in Table 2.The recovery of heparin ranged from 99106%. The analytical usefulness, of the presented method for the determination of heparin in medical samples was confirmed. In the case of borate buffer not all samples could be examined.
4. CONCLUSIONS
The presented DP CSV method for the electrochemical determination of heparin based on simple supporting electrolytes and hanging mercury drop electrode, allows to determine heparin at trace level, in concentrations as low as 1.1 µg·l-1 (borate buffer + NaCl) and 1.7 µg·l-1 (HCl + NaCl) for a preconcentration time of 120 s. The reproducibility of the method is good, i.e. when measured as RSD is 1.6% (borate buffer) and 1.1% (HCl). Acceptable recovery (99–106%) shows that the proposed method can be used for the determination of heparin in medical products.
ACKNOWLEDGMENTS
This work was supported by The National Centre for Research and Development (NCBiR) within a framework of LIDER program (No. LIDER/31/7/L-2/10/NCBiR/2011).
References
1. D. L. Rabenstein, Nat. Prod. Rep., 19 (2002) 312
2. B. G. Katzung, Basic and clinical pharmacology, McGraw-Hill/Appleton and Lange (1992) 3. Q. C. Jiao, Q. Liu, Anal. Lett., 31 (1998) 1311
4. I. Nemcova, P. Rychlovsky, M. Havelcova, M. Brabcova, Anal. Chim. Acta, 401 (1999) 223 5. S. Z. Zhang, F. L. Zhao, N. Li, K. A. Li, S. Y. Tong, Spectrochim. Acta, 58 (2002) 2613 6. X. J. Zhu, X. L. Wang, C. Q. Jiang, Anal. Biochem., 341 (2005) 299
7. S. P. Liu, H. Q. Luo, N. B. Li, Z. F. Liu, W. X. Zheng, Anal. Chem., 73 (2001) 3907 8. H. Q. Luo, S. P. Liu, Z. F. Liu, Q. Liu, N. B. Li, Anal. Chim. Acta, 449 (2001) 261 9. H. Q. Luo, S. P. Liu, N. B. Li, Z. F. Liu, Anal. Chim. Acta, 468 (2002) 275
10.H. Toyoda, T. Nagashima, R. Hirata, T. Toida, T. Imanari, J. Chrom. B., 704 (1997) 19 11.S. A. Amdofo, H. M. Wang, R. J. Linhardt, Anal. Biochem., 199 (1991) 249
12.X. M. Zhou, J. W. Liu, M. E. Zhang, S. J. Chen, Talanta, 46 (1998) 757 13.M. Peter, V. Iva, H. Emil, J. Pharmaceut. Biomed. Anal., 36 (2004) 441
14.T. J. Cheng, T. M. Lin, T. H. Wu, H. C. Chang, Anal. Chim. Acta, 432 (2001) 101 15.T. J. Cheng, T. M. Lin, H. C. Chang, Anal. Chim. Acta, 462 (2002) 261
16.S. C. Ma, V. C. Yang, M. E. Meyerhoff, Anal. Chem., 64 (1992) 694
17.S. C. Ma, V. C. Yang, B. Fu, M. E. Meyerhoff, Anal. Chem., 65 (1993) 2078
18.N. Ramamurthy, N. Baliga, J. A. Wahr, U. Schaller, V. C. Yang, M. E. Meyerhoff, Clin. Chem., 44 (1998) 606
20.J. H. Yun, I. S. Han, L. C. Chang, N. Ramamurthy, M. E. Meyerhoff, V. C. Yang, Pharm. Sci. Technol. Today, 2 (1999) 102
21.X. Niu, W. Zhang, N. Zhao, W. Sun, Bull. Chem. Soc. Ethiop., 22(2) (2008) 165 22.W. Sun, K. Jiao, J. Y. Han, L. D. Lu, Anal. Lett., 38 (2005) 1137
23.W. Sun, Y. Q. Ding, Q. X. Wang, K. Jiao, Electroanalysis, 18 (2006) 1114 24.W. Sun, Y. Q. Ding, K. Jiao, J. Anal. Chem., 61 (2006) 359
25.Z. Samec, A. Trojanek, J. Langmaier, E. Samcova, Electrochem. Commun., 5 (2003) 867 26.J. Langmaier, J. Olsak, E. Samcova, Z. Samec, A. Trojanek, Electroanalysis, 18 (2006) 115 27.B. Baś, M. Jakubowska, Anal. Chim. Acta, 592 (2007) 218
28.B. Mulloy, E. Gray, T.W. Barrowcliffe, Thrombosis and Haemostasis, 84 (2000) 1052 29.X. Niu, W. Sun, N. Zhao, Indian J. Chem. Technol., 15 (2008) 476
30.N. Hui, W. Sun, Y. Q. Ding, N. Zhao, K. Jiao, J. Chin. Chem. Soc., 56 (2009) 271 31.X. Y. Peng, H. Q. Luo, N. B. Li, Microchim. Acta, 156 (2007) 297