Cataloguing data can be found at the end of this publication.
Luxembourg: Office for Official Publications of the European Communities, 2003 ISBN 92-894-5689-2
© European Communities, 2003
Reproduction is authorised provided the source is acknowledged.
Printed in Belgium
in Europe. These were met by innovative solutions and sufficient budgetary resources to provide immediate relief.
At the Union level, in 2002 the euro made its successful entrance into European households. This was the culmination of a process which had begun with the introduction of the euro for non-cash transactions in January 1999 and which had required unprecedented and extensive for-ward planning and wide information coverage.
The year ended with the Copenhagen European Council, a historic moment in the Union’s evo-lution. During 2002 the enlargement financial framework was negotiated and in December agreement was reached on a formula for enlarging the EU to 10 new Member States, so marking the end of the post-war division of Europe. The question of agricultural support was resolved by a rural development package for 2004–06 specifically adapted to the requirements of the new States. Budgetary transfers ensure that all new Member States will be in a net beneficiary posi-tion when participating fully in all transfers in and out of the EC budget from 1 May 2004. New ‘road-maps’ indicate the main steps Bulgaria and Romania need to take in order to reach their target of accession in 2007. Commitments of EUR 125 million were made available to Turkey to help with its pre-accession efforts. Efforts to prepare the EU institutions’ administration for enlargement, especially the language services, began to significantly impact on the budget.
The financial reform in the EU institutions took a giant step with the decision on the new Finan-cial Regulation for the Community budget. This is a very important event for the management of the EU budget and one of the major legislative proposals of the Prodi Commission. It was adopted in record time. In June the Council, having reached agreement with the European Par-liament and taking into account the views expressed by the Court of Auditors, unanimously adopted the new Financial Regulation. The new version simplifies rules, presents clearly the principles of the EU budget and identifies the policy focus of the budget (Activity-Based Bud-geting). This way of presenting the budget aims to simplify decision-making on political priori-ties and their operational consequences in terms of human and financial resources. This new presentation will be applied formally for the first time to the 2004 budget, although it has been used informally now for several years. The Financial Regulation lays down provisions for the use of appropriations and control and audit systems so that financial management is geared to results and performance. At the same time the Financial Regulation sets the frame for the ongo-ing modernisation of the accountongo-ing system, towards a fully fledged accrual accountongo-ing in 2005.
Another reform sector was opened in July 2002, when the Commission launched its mid-term review of the common agricultural policy (CAP). The proposals aimed at more efficient use of
taxpayers’ money propose inter alia the decoupling of the link between subsidies and
produc-tion.The implications for the farming community, consumers, taxpayers, rural development, as well as the EU’s position in the WTO farm trade negotiations, have been hotly debated since then.
coun-get funding was provided for reconstruction and support to the new authorities in Afghanistan and for humanitarian aid in the region. The Community continued to lead on humanitarian sup-port: its initial budget of EUR 442 million was increased during 2002. This extra funding was needed for food crises in two regions — southern Africa and the Horn of Africa — and for help-ing to alleviate the ongohelp-ing crisis in the Middle East.
Overall, for 2002, the Commission was entrusted with a budget of some EUR 99 billion in order to carry out the tasks defined by the legislative and budgetary authorities. Those funds were used during the year to bring forward European integration, to maximise impact on the Euro-pean Union Member States and its neighbours in the coming years and to meet unexpected chal-lenges.
The financial year 2002 has seen a nearly full take-up of appropriations available for entering into new legal commitments and new projects (EUR 98.6 billion). Payments on the other hand, were far lower. They initially amounted to EUR 95.6 billion, up by 2 % against 2001, corre-sponding to 1.03 % of EU GNP. The final closing of the accounts for the budget year 2002 revealed a surplus of EUR 7.413 billion, given back to the Member States in 2003 in the form of reductions in their contributions to the budget. The highest underspend occurred in the Structur-al Funds, where amounts budgeted are based on forecasts submitted by the Member States. The surplus recorded in agriculture, administrative expenditure and the reserves represents real savings.
The year 2002 also opened the way for the future of the Union by setting up the Convention on the future of Europe which began its formal work to draft a new constitutional treaty in March. The quality of its deliberations since then has rather confounded its earlier sceptics. A prelimi-nary draft of a treaty establishing a constitution for an enlarged Europe is being drawn up. The Commission submitted contributions also on the questions of the Union’s own resources, on simplifying the budgetary procedure in this process and anchoring in the constitution the instru-ment of the multiannual financial framework so as to ensure that for the future expenditure will develop in an orderly manner and give the Union the means to attain its objectives.
Michaele SCHREYER
The Commission is responsible for implementing the budget in compliance with the rules and for ensuring that Community funds are used efficiently. The directorates-general and services in the Commission are responsible for implementing Community programmes in their respective areas and for managing the appropriations earmarked to finance them, usually through and with the Member States.
How has the Commission used these Community resources in 2002?
The purpose of this Financial Report is to set out how the funds have been allocated in the many programmes and projects which the EU taxpayer has supported during the year.
The Report first reviews the economic context in which the budget was implemented in 2002. The procedure leading to the approval of the budget is summarised, and the sources of revenue to finance the budget are identified. A detailed presentation of how those resources have been used follows. Examples demonstrate, in practical terms, what has been achieved with EU tax-payers’ money.
The ‘theme’ of the 2002 Report is the way in which EU funds and the Commission services work together to enhance the EU citizen’s security. This takes many forms — civil protection; road, air and maritime safety; consumer health; our environment — but shows the added-value to be achieved by tackling such issues at the Community level.
Page
1. The economic situation of the European Union in 2002 9
2. Financial perspective (2000–06) 10
3. Establishing the 2002 budget 13
4. Budget revenue in 2002 18
5. Budget implementation in 2002 22
6. The new financial regulation 31
7. How EU funds and the European Commission work to enhance
the security of the EU citizen 32
8. Policy areas and activities by activity-based budgeting 59
— Economic and financial affairs 60
— Enterprise 62
— Competition 64
— Employment and social affairs 66
— Agriculture and rural development 68
— Energy and transport 71
— Environment 74
— Indirect research 76
— Information society 79
— Direct research 81
— Fisheries 83
— Internal market 85
— Regional policy 87
— Taxation and customs union 90
— Education and culture 92
— Press and communication 96
— Health and consumer protection 98
— Justice and home affairs 101
— External relations 103
— Trade 106
— Development and relations with ACP countries 108
— Enlargement 110
— Humanitarian aid 112
Page
9. OLAF and the fight against fraud 116
10. Borrowing and lending activities 117
11. Treasury report 122
Annexes
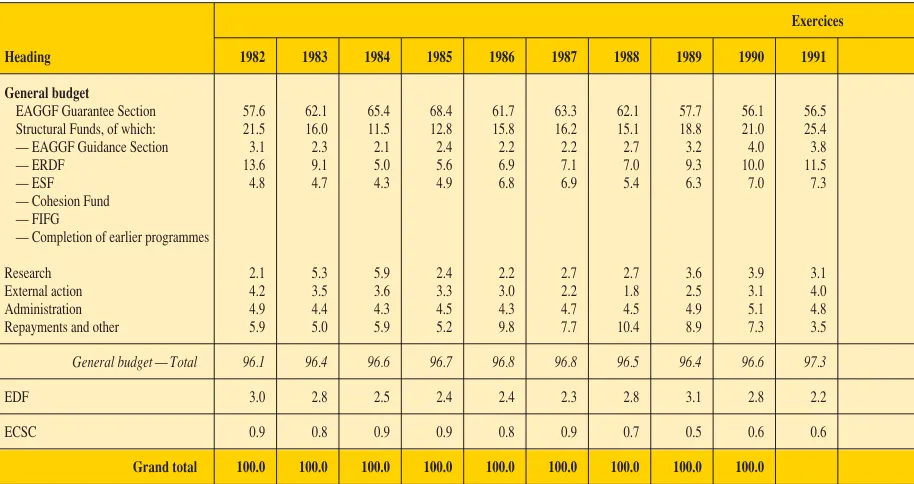
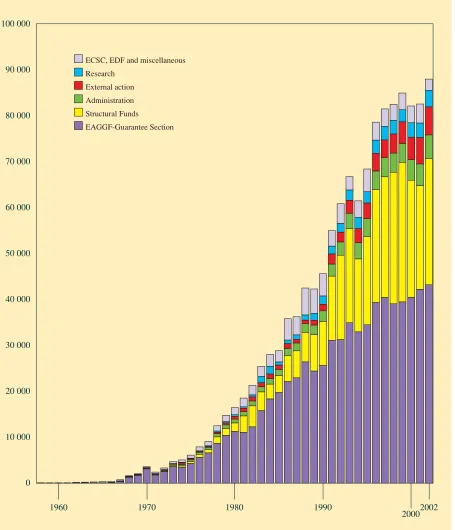
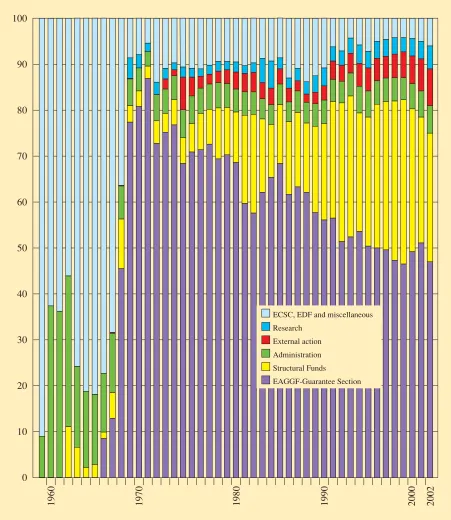
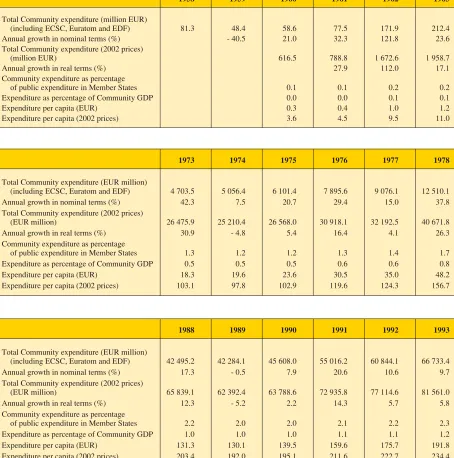
— Evolution of the budget of the European Union 1958–2002 125
— Extract from the consolidated accounts of the European Union (provisional) 139
Agencies 219
The recovery in the euro area and the EU started in the first quarter of 2002, but has failed to accelerate. GDP in the euro area in-creased by 0.3% quarter-on-quarter in the third, the same growth rate as in the second, while according to advanced indicators the growth rate for the fourth quarter may be of similar size. The composition of domestic de-mand growth shifted from public to private spending. While investment was weak, pri-vate consumption was supported by lower in-flation in the second and third quarters. In the Autumn 2002 forecast, the average growth rate was estimated to be 0.8 % in 2002.
Private consumption growth jumped from 0.3 % in the second quarter to 0.5 % in the third but may have weakened slightly in the fourth quarter, after having been weak until the first quarter — it was close to zero for three quar-ters in a row. Stubborn inflation has eroded the purchasing power of households, but after a decline in inflation in the second quarter purchasing power was strengthened. Invest-ment has fallen by an average rate of 0.7 % during each of the six quarters up to second quarter 2002. In the third quarter it finally broke the declining pattern with 0.1 % growth. Pressure on profits and the existence of sufficient capacity limit the vigour of its expansion.
During the first half of 2002, developments in headline Harmonised Index of Consumer Prices inflation in the euro area mostly re-flected the unwinding of temporary shocks. Headline inflation slowed to 1.8 % y-o-y in June, from 2.7 % in January. However, since August, reflecting unfavourable base effects and rises in energy prices, headline inflation is again above 2 % (2.3 % in December). By contrast, core inflation (headline excluding unprocessed food and energy) has shown re-markable resilience at 2.3 to 2.6 % since the beginning of 2002. The reason for the
re-silience in core inflation is mainly high ser-vices inflation, as all other core inflation com-ponents have been on a downward trend for most of 2002.
Despite the pronounced slowdown, employ-ment creation is estimated to continue, albeit at a weak pace. The rise of the unemployment rate, currently standing at 8.4 %, is likely to remain limited. However, in several Member States the unemployment rate continues to in-crease rather sharply. The other side of the rel-atively resilient labour market is that produc-tivity gains are expected to remain low for another year. As a consequence, unit labour costs are expected to increase. To some extent this is a normal cyclical reaction as employ-ment lags the activity slowdown, but never-theless it puts additional strains on corporate profitability and weighs on the resumption of investment.
Mainly due to adverse cyclical developments, the general government deficit for the euro area as a whole widens to 2.3 % of GDP in 2002. In 2002, apart from the deterioration in the economic situation, other elements con-tributed to the widening of the deficit. The worse outcome for 2001 provided for a lower starting position, but there were also overruns.
In 2002 global equity prices recorded their third consecutive year of annual losses. Weak-er optimism about near-tWeak-erm growth prospects and geopolitical tensions continue to depress stock markets.
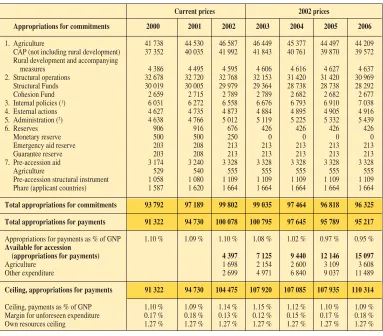
The Community budget since 1988 has been defined within a multi-annual financial frame-work — the financial perspective (FP) — in order to ensure tighter budgetary discipline and to improve the functioning of the bud-getary procedure and interinstitutional cooper-ation.
The current financial perspective was agreed at the European Council in Berlin in March 1999 for seven years (2000–06). It is the third financial programming period after those of 1988–92 and 1993–99. Its definition and im-plementing provisions are further detailed in the interinstitutional agreement (IIA) of 6 May 1999 on budgetary discipline and improvement of the budgetary procedure.
Structure of the financial
perspective
The financial framework consists of seven headings — some of them broken down into sub-headings — with an annual ceiling for commitment appropriations set for each head-ing. The sum of all seven headings’ ceilings results in the global ceiling of appropriations for commitments. A corresponding estimate is then established for the annual ceiling of ap-propriations for payments.
As regards enlargement-related expenditure:
A new Heading 7 was created to cover the
three pre-accession instruments: the agri-cultural instrument (Sapard), the structural instrument (ISPA) and the enhanced Phare programme for applicant countries;
A new Heading 8 was created in order to
cover accession spending, starting from year 2002 (it does not therefore appear in the table 1 below which concerns the fi-nancial perspective for EU-15;
A margin has been left available under the
own resources ceiling in payment appro-priations in order to finance
accession-re-lated expenditure when new Member States join the Union. This margin adds up to the amounts already left available for accession in Heading 8 as from 2002. For 2002, the margin for unforeseen expendi-ture under the own resources ceiling stands at 0.13 % of GNP.
Implementation of the
financial perspective (FP)
Technical adjustment
Following the provisions of the IIA, the Com-mission proceeds at the beginning of each budgetary procedure to the technical adjust-ment of the FP in order to take into account inflation and the evolution of GNP growth. This is required due to the financial perspec-tive framework being originally expressed in constant prices (1999 prices), and therefore needs to be adjusted to the most recent eco-nomic environment before the establishment of the preliminary draft budget for the follow-ing year.
The technical adjustment exercise is differen-tiated by heading. A fixed rate of 2 % per year is used as a deflator for:
— amounts entered under Heading 1 (Agri-culture);
— amounts entered under sub-heading ‘Struc-tural Funds’ of Heading 2;
— agriculture and structural operations in
‘Available for accession’ (Heading 8).
Adjustment to take account of
implementation
Another crucial exercise is the adjustment of the financial perspective to take account of implementation. This task is governed by the necessity to ensure an orderly progression of appropriations for payments in relation to the appropriations for commitments. Indeed, the FP is established on the basis of an estimate of the ratio between appropriations for commit-ments and appropriations for paycommit-ments. An error in this estimate would cause an imbal-ance between the two ceilings, for example lower commitments than expected would cre-ate a corresponding backlog in payments that would have to be made up later.
On 13 March 2001, the Commission adopted a proposal on the adjustment to take account of implementation, which would apply as from 2002. It led to the decision to raise the annual ceiling for commitment appropriations in the ‘Structural Funds’ sub-heading of Heading 2. As foreseen in the IIA, a delay in the adoption of programmes occurred in 2001 and EUR 6 152 million of the allocation could not be committed. This amount was therefore transferred to subsequent years by increasing the corresponding expenditure ceilings.
Transfers added to the annual
ceilings of the Structural Funds
sub-heading of Heading 2
(million EUR — 2001 prices) 2002 2003 2004 2005 2006
870 1 178 1 642 1 396 1 067
European Union Solidarity Fund
Following the disastrous floods that occurred in central Europe during the summer 2002, the Commission proposed the creation of a European Union Solidarity Fund in order to
provide relief in the face of such events. On 7 November 2002, the European Parliament, the Council and the Commission signed an in-terinstitutional agreement in order to create the European Union Solidarity Fund. The re-lated regulation was also proposed by the Commission to specify the conditions of mo-bilisation for the fund. This fund is endowed with a maximum annual amount of EUR 1 billion and can be mobilised above the financial perspective ceilings concerned.
Flexibility instrument
The flexibility instrument is a new feature of the 1999 interinstitutional agreement. It offers the possibility to cover the financing of clear-ly identified expenditure for a given financial year, which cannot be met within the ceilings available under one or more headings. Its an-nual ceiling amounts to EUR 200 million and its mobilisation is decided jointly by the two arms of the budgetary authority on the basis of a Commission proposal.
TABLE 1
Financial perspective (EU-15) — adjusted to 2002 prices
(million EUR)
Current prices 2002 prices
Appropriations for commitments 2000 2001 2002 2003 2004 2005 2006
1. Agriculture 41 738 44 530 46 587 46 449 45 377 44 497 44 209 CAP (not including rural development) 37 352 40 035 41 992 41 843 40 761 39 870 39 572 Rural development and accompanying
measures 4 386 4 495 4 595 4 606 4 616 4 627 4 637 2. Structural operations 32 678 32 720 32 768 32 153 31 420 31 420 30 969 Structural Funds 30 019 30 005 29 979 29 364 28 738 28 738 28 292 Cohesion Fund 2 659 2 715 2 789 2 789 2 682 2 682 2 677 3. Internal policies (1) 6 031 6 272 6 558 6 676 6 793 6 910 7 038
4. External actions 4 627 4 735 4 873 4 884 4 895 4 905 4 916 5. Administration (2) 4 638 4 766 5 012 5 119 5 225 5 332 5 439
6. Reserves 906 916 676 426 426 426 426
Monetary reserve 500 500 250 0 0 0 0
Emergency aid reserve 203 208 213 213 213 213 213
Guarantee reserve 203 208 213 213 213 213 213
7. Pre-accession aid 3 174 3 240 3 328 3 328 3 328 3 328 3 328
Agriculture 529 540 555 555 555 555 555
Pre-accession structural instrument 1 058 1 080 1 109 1 109 1 109 1 109 1 109 Phare (applicant countries) 1 587 1 620 1 664 1 664 1 664 1 664 1 664
Total appropriations for commitments 93 792 97 189 99 802 99 035 97 464 96 818 96 325
Total appropriations for payments 91 322 94 730 100 078 100 795 97 645 95 789 95 217
Appropriations for payments as % of GNP 1.10 % 1.09 % 1.10 % 1.08 % 1.02 % 0.97 % 0.95 %
Available for accession
(appropriations for payments) 4 397 7 125 9 440 12 146 15 097
Agriculture 1 698 2 154 2 600 3 109 3 608
Other expenditure 2 699 4 971 6 840 9 037 11 489
Ceiling, appropriations for payments 91 322 94 730 104 475 107 920 107 085 107 935 110 314
Ceiling, payments as % of GNP 1.10 % 1.09 % 1.14 % 1.15 % 1.12 % 1.10 % 1.09 % Margin for unforeseen expenditure 0.17 % 0.18 % 0.13 % 0.12 % 0.15 % 0.17 % 0.18 % Own resources ceiling 1.27 % 1.27 % 1.27 % 1.27 % 1.27 % 1.27 % 1.27 %
(1) In accordance with Article 2 of Decision No182/1999/EC of the European Parliament and of the Council and Article 2 of Council
Decision1999/64/Euratom (OJ L and p. 34), €11 510 million at current prices is available for research over the period 2000-02. (2) The expenditure on pensions included under the ceiling for this heading is calculated net of staff contributions to the pension
1. Strategic planning and
programming
The Commission has decided to organise its activities on the basis of clear strategic objec-tives, which must be reflected in the use of its resources. The first strategic planning and programming cycle covered the year 2002. This decision guided the process of drafting the budget and planning the Commission's work. In addition, the activities set out in the decision will be the subject of strategic evalu-ations, so that in subsequent cycles the Com-mission will be able to adjust the resources and methods chosen to implement the priori-ties in the light of their impact and effective-ness.
The Commission identified six main priority objectives for 2002: the euro, sustainable de-velopment, development cooperation, the Mediterranean, enlargement and new gover-nance. Some of these measures needed a shift in resource allocations, but in many cases, pri-ority measures did not require any extra and could be implemented on the basis of existing resources.
Strategic planning is a continuous exercise which forms part of the broader framework of the strategic guidelines for 2000-05. Several of the programmes and activities coming under the 2002 priorities will extend over a number of years: the enlargement process, for example, will be completed only over the medium term, since some countries will need more time to become members, and other ap-plicants may come along in the meantime.
Other objectives of a more permanent nature continue to mobilise a significant share of the Commission's resources, without necessarily being reflected in annual priorities, such as the implementation of the Structural Funds, the reform of the common agricultural policy, monitoring of compliance with the rules on freedom of movement, the creation of an area of freedom, security and justice,
improve-ments to the legislative framework, or reform of the Commission itself. These activities by their very nature will remain crucial for the future in maintaining Europe's current level of integration.
2. Evolution of the 2002
budget
On 8 May 2001, the Commission adopted the preliminary draft budget for 2002. This pro-posed an increase of 3.5 % in commitment ap-propriations compared with 2001. The pro-posed increase in payment appropriations was 4.8 %. These figures compare with an esti-mated 3.8 % increase of Member States’ gov-ernment expenditure plans for 2002. The 2002 preliminary draft budget, excluding letters of amendment, thus amounted to 1.06 % of EU GNP, less than the 2001 budget at 1.08 % and remained EUR 2.5 billion below the 'Berlin ceiling'.
The draft budget established by the Council at first reading on 20 July 2001 came to EUR 99.010 billion in appropriations for commit-ments and EUR 95.600 billion in appropria-tions for payments. Compared with the 2001 budget, including supplementary and amend-ing budgets, these figures represented an in-crease of 2.1 % in commitments and 2 % in payments.
After Parliament's first reading on 25 October, the draft budget came to EUR 99.634 billion in commitments and EUR 98.737 billion in payments.
pay-ments was 1.03 % of Community GNP, EUR 4.59 billion below the ceiling of the financial perspective, making this budget historically low.
The appropriations for Heading 1 (Agricul-ture) came to EUR 44.255 billion, of which EUR 39.66 billion was for compulsory market expenditure (0.3 % higher than in 2001, and EUR 2.332 billion below the ceiling of the fi-nancial perspective) and EUR 4.495 billion for rural development and accompanying measures.
The appropriations for Heading 2 (Structural operations) were set at EUR 33.838 billion in commitments and EUR 32.129 billion in pay-ments, mainly for the Structural Funds: this was EUR 200 million above the ceiling of the financial perspective, due to the restructuring of the Spanish and Portuguese fishing fleets (EUR 170 million) and the regions bordering on the candidate countries (EUR 30 million), financed by drawing on the flexibility instru-ment. The remainder of the heading, covering the Cohesion Fund, was within the ceiling.
The appropriations for Heading 3 (Internal policies) came to EUR 6.558 billion in com-mitments and EUR 6.157 billion in payments, leaving a symbolic margin of EUR 0.2 million below the ceiling and representing a 5.2 % in-crease over 2001. This heading contains a number of priorities which are shared by the institutions, namely eLearning, immigration and asylum, agencies for food safety and
mar-itime safety, and a pilot project for small and medium-sized businesses affected by enlarge-ment. Education, vocational training and youth, the internal market and the area of se-curity and justice were also given a substan-tial increase in appropriations. For its final year, the fifth research framework programme received an allocation of EUR 4.055 billion (3.4 % up on 2001).
The commitment appropriations for 'External action’ (Heading 4) came to EUR 4.803 bil-lion, 2.5 % down on 2001, while payment ap-propriations were 6.7 % higher reflecting the emphasis placed on implementing projects which had already been committed. EUR 165 million was provided for the Afghan crisis. The appropriations for humanitarian aid were lower than in 2001; the appropriations for the Mediterranean countries were slightly re-duced; those for Latin America were slightly increased and those for the Tacis programme were kept at the same level.
The commitment appropriations for 'Pre-ac-cession aid’ (Heading 7) came to EUR 3.328 billion, the ceiling of the financial perspec-tive, while payment appropriations in this heading totalled EUR 2.595 billion, 23.5 % higher than in 2001, in order to make up the backlog in implementing these measures.
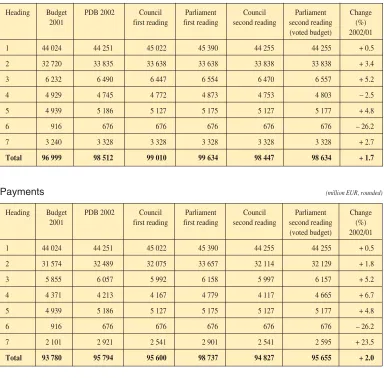
3. Overview of the various stages
of the 2002 budgetary procedure
TABLE 2
Commitments (million EUR, rounded)
Heading Budget PDB 2002 Council Parliament Council Parliament Change 2001 first reading first reading second reading second reading (%)
(voted budget) 2002/01
1 44 024 44 251 45 022 45 390 44 255 44 255 + 0.5
2 32 720 33 835 33 638 33 638 33 838 33 838 + 3.4
3 6 232 6 490 6 447 6 554 6 470 6 557 + 5.2
4 4 929 4 745 4 772 4 873 4 753 4 803 – 2.5
5 4 939 5 186 5 127 5 175 5 127 5 177 + 4.8
6 916 676 676 676 676 676 – 26.2
7 3 240 3 328 3 328 3 328 3 328 3 328 + 2.7
Total 96 999 98 512 99 010 99 634 98 447 98 634 + 1.7
Payments (million EUR, rounded)
Heading Budget PDB 2002 Council Parliament Council Parliament Change 2001 first reading first reading second reading second reading (%)
(voted budget) 2002/01
1 44 024 44 251 45 022 45 390 44 255 44 255 + 0.5
2 31 574 32 489 32 075 33 657 32 114 32 129 + 1.8
3 5 855 6 057 5 992 6 158 5 997 6 157 + 5.2
4 4 371 4 213 4 167 4 779 4 117 4 665 + 6.7
5 4 939 5 186 5 127 5 175 5 127 5 177 + 4.8
6 916 676 676 676 676 676 – 26.2
7 2 101 2 921 2 541 2 901 2 541 2 595 + 23.5
Total 93 780 95 794 95 600 98 737 94 827 95 655 + 2.0
4. Budgetary adjustments
Appropriations carried forward
from 2001 to 2002
From budget year 2001, unused appropria-tions of EUR 309 million for commitments and EUR 394 million for payments were car-ried forward to 2002.
Amongst these were EUR 175 million under 'Structural actions', EUR 172 million relating
to the Structural Funds’ programming proce-dure in respect of cases where the program-ming documents for 2000-06 were approved too late to permit commitments in 2001. The carry-forward was necessary to fully cover the Member States’ programme allocations.
For 'External action', EUR 115 million of un-used commitment appropriations was carried forward, notably EUR 63 million following the late adoption of a transfer to macro-finan-cial assistance to the Former Yugoslav Repub-lic of Macedonia (FYROM). EUR 226 mil-lion in payment appropriations was carried forward, spread across the heading but in the main for 'Other cooperation measures’ and 'Cooperation with the Balkan countries'.
5. Supplementary and
amending budgets
Supplementary and amending budget No
1/2002: was adopted by Parliament on 28
February. Following the interinstitutional agreement on the financing of the Convention on the future of the European Union, it con-tained the new lines and transfers of appropri-ations necessary for the three institutions (Commission, Council and Parliament) to pay their contributions.
Supplementary and amending budget No 2/2002:was adopted on 30 May. Its purpose was to recalculate the revenue side of the bud-get in accordance with the new own resources decision and enter as revenue an estimate of the positive balance resulting from implemen-tation of the 2001 budget.
Supplementary and amending budget No 3/2002: was adopted on 3 July. Its purpose was to update the estimate of own resources and the collection costs for the Member States and to enter the definitive amount of the bal-ance of the 2001 budget. In its resolution Par-liament noted that the final surplus for the 2001 financial year was EUR 15 billion and restated its concern at the build-up of out-standing payments.
Supplementary and amending budget No
4/2002: was adopted on 26 September. The
main purpose was to draw on the margin re-maining under the ceiling of Heading 4
(Ex-ternal action) of the financial perspective for reconstruction aid to Afghanistan. It also cre-ated two new lines to accommodate the ap-propriations for the European Union's Solidar-ity Fund to cover disaster relief in the Member States and the countries which have applied for accession.
Supplementary and amending budget No
5/2002: was adopted on 21 November. Its
purpose was to use the European Union's Sol-idarity Fund for mobilising EUR 599 million for heading 3 (Internal policies) and EUR 129 million for Heading 7 (Pre-accession aid) fol-lowing the floods in Germany, Austria and the Czech Republic in August and in France in September.
Supplementary and amending budget No 6/2002:was adopted on 5 December. The pur-pose was to bring forward to 2002 around EUR 77 million of administrative expendi-ture, thus leaving a margin for manoeuvre to finance the expenditure needed in 2003 to prepare the institutions administratively for enlargement.
6. Transfers in 2002
In 2002, a total of 56 transfers were approved. Transfers of commitment appropriations, ex-cluding transfers from the reserve, totalled EUR 2.031 billion, the equivalent of 2.0 % of the final budget, and payment appropriations EUR 3.275 billion, i.e. 3.4 % of the final bud-get. The breakdown between headings was amended by:
a net increase (from Heading 6, 'Reserves)
in external actions of EUR 174 million in commitment appropriations and EUR 33 million in payments;
under 'Internal policies’ by an increase of EUR 599 million in payment appropria-tions;
and under 'Pre-accession aid’ by a decrease of EUR 69 million in payment appropria-tions.
The budget of the European Union is financed from the following sources:
• traditional own resources (custom duties,
agricultural duties and sugar levies);
• the VAT-based resource;
• the GNI-based resource;
• other revenue (including the balance from the previous year).
As from the financial year 2002 the new Council decision (2000/597/EC, Euratom) on the system of the European Communities’ own resources applies. The new Council deci-sion entered into force, after ratification by all Member States, on 1 March 2002 with retroactive effect as from 1 January 2002 (and from 1 January 2001 as regards the collection costs of traditional own resources and the rules for the calculation of the UK correction).
The application of the new decision entails the following changes compared with the pre-vious own resources decision in force (94/728/EC, Euratom):
the percentage of traditional own resources (TOR) retained by Member States to cover their collection costs increases from 10 to 25 %;
the maximum rate of call of the VAT
re-source is reduced from 1.00 to 0.75 % (and to 0.50 % as from 2004);
a modified calculation method applies to
the UK correction, implying, inter alia, the neutralisation of the windfall gains of the United Kingdom that result from the in-crease in the percentage of traditional own resources retained by Member States;
the share of Germany, the Netherlands,
Austria and Sweden in the financing of the UK correction is reduced to one quarter of its normal value (whereas earlier only the share of Germany was reduced — to two thirds of its normal value);
the European system of accounts 1995
(ESA 95) replaces the previous version ESA 79 also in the budgetary and own re-sources area, consequently the concept of gross national product (GNP) is replaced by the concept of gross national income (GNI).
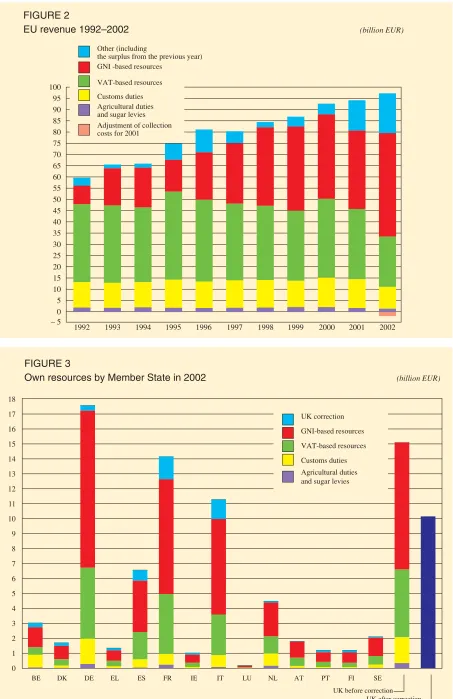
The breakdown of the 2002 total revenue of EUR 95.4 billion into the different revenue sources is shown in Figure 1.
Traditional own resources
The EU's traditional own resources are made up of customs duties, agricultural duties and sugar levies. They are established by the Member States, which keep 25 % to cover their collection costs.
Customs duties are levied on imports of non-agricultural products from third countries, at rates based on the common customs tariff. These rates are often subject to reductions as a result of agreements in the framework of the World Trade Organisation (WTO), previously the General Agreement on Tariffs and Trade (GATT), and specific agreements granting preferential tariffs to certain trading partners or products. In 2002, this revenue amounted to EUR 9 701.2 million (after deduction of 25 % in collection costs), which corresponds to a decrease of 31.9 % compared with the previous year.
Agricultural duties are charged on imports of agricultural products from third countries. In 2002, this revenue amounted to EUR 886.4 million, which corresponds to a decrease of 21.8 % compared with the previous year.
repre-sents a decrease of 22.7 % compared with the previous year.
Furthermore, following the entry into force of the new own resources decision (see above), the amount of collection costs for 2001 corre-sponding to the additional 15 percentage points retained by Member States has been adjusted retroactively. This adjustment amounts to EUR 2 023 million, which de-creased Member States’ own resources pay-ments accordingly in 2002.
VAT-based own resources
The VAT-based own resources are calculated by applying a uniform rate to the harmonised national VAT bases, which are determined in accordance with Community rules. Further-more, Member States’ VAT bases are capped at 50 % of their GNI. In 2002, five Member States (Greece, Spain, Ireland, Luxembourg and Portugal) benefited from this limit.
The uniform rate is obtained by deducting the so-called frozen rate from the maximum rate of call of VAT. The frozen rate is derived from and proportional to the amount of the UK cor-rection (see below).
In accordance with the own resources deci-sion in force (2000/597/EC, Euratom), the maximum rate is set at 0.75 % of the har-monised capped VAT bases in 2002. The uni-form rate of VAT amounted to 0.5251 % (rounded figure).
Payments during a given year derive from the forecasts for the capped VAT bases entered in the budget for that year and the negative or positive adjustments for previous years that result from the difference between the out-turn and the latest budgetary forecast for these bases.
In 2002, the VAT resource amounted to EUR 22 388.2 million. This included net negative
adjustments (i.e. a global reimbursement to the Member States) for previous years to-talling EUR 150.8 million, the budget fore-casts having overestimated the growth of the national VAT bases.
GNI-based own resources
A new source of revenue based on GNP was first introduced in 1988 to balance budget rev-enue and expenditure, i.e. to finance the part of the budget not covered by other revenue. It consists of a uniform rate applied to the sum of all Member States’ GNI (as from 2002 the concept of GNP has been replaced by that of GNI) established in accordance with Commu-nity rules. The rate is fixed during the bud-getary procedure. The amount of the GNI re-source needed depends on the difference between total expenditure and the sum of all other revenue.
In 2002, the uniform rate of call of this addi-tional resource amounted to 0.5096 % (round-ed figure) of total EU GNI. In total, the GNI resource amounted to EUR 45 947.6 million (including reserves). This included net posi-tive adjustments (i.e. global additional pay-ments called in from the Member States) for previous years totalling EUR 97.3 million, the budget forecasts having underestimated eco-nomic growth.
The correction in favour of
the United Kingdom
The UK correction was introduced to correct the imbalance between the United Kingdom's share in the payments to the Community bud-get and its share in Community expenditure in the Member States. This imbalance is calcu-lated according to precise rules and the United Kingdom is reimbursed for 66 % of the differ-ence.
share in Community GNI. However, certain Member States enjoy a reduction in their fi-nancing share, the cost of which is assumed by the remaining Member States. For correc-tions relating to the years previous to 2001 only Germany benefited from a reduction, by one third, of its normal financing share. As from the 2001 correction, the share of Ger-many, the Netherlands, Austria and Sweden has been reduced to one quarter of its normal value.
The correction for a certain year ’n’ is fi-nanced in the following year.
A first provisional estimate of the correction for year ’n’ is budgeted in year ’n’ + 1. If deemed necessary this estimate can be updat-ed in an amending budget before the budget-ing of the result of the final calculation of the correction and its financing in year ’n’ + 4.
The total amount of the UK correction bud-geted in 2002 amounted to EUR 5 092.2 mil-lion and was due to two elements:
the amount of the 2001 correction
(EUR 5 027.0 million);
the difference between the result of the
final calculation of the 1998 correction and the amount previously budgeted in 1999 (EUR 65.2 million).
Other revenue
The general budget is also financed by other revenue, including, inter alia, the balance from the previous exercise, tax and other de-ductions from staff remunerations, bank inter-est, contributions from non-member countries to certain Community programmes (e.g. in the research area), repayments of unused Com-munity financial assistance and interest on late payments.
In 2002 other revenue amounted to EUR 17 736.4 million, of which EUR 15 002.5 mil-lion corresponded to the surplus carried over from 2001.
FIGURE 1
EU revenue 2002
Agricultural duties and sugar levies Customs duties
VAT-based resources GNI-based resources
Other (including the surplus from the previous exercise) 23.5 %
8.3 %
1.3 % 18.6 %
0 5
– 5 10 15 20 25 30 35 40 45 50 55 60 65 70 75 80 85 90 95 100
1992 1993 1994 1995 1996 1997 1998 1999 2000 2001 2002 VAT-based resources
Customs duties Agricultural duties and sugar levies Adjustment of collection costs for 2001
0 1 2 3 4 5 6 7 8 9 10 11 12 13 14 15 16 17 18
FIGURE 3
Own resources by Member State in 2002 (billion EUR)
UK correction GNI-based resources VAT-based resources Customs duties Agricultural duties and sugar levies
BE DK DE EL ES FR IE IT LU NL AT PT FI SE UK before correction
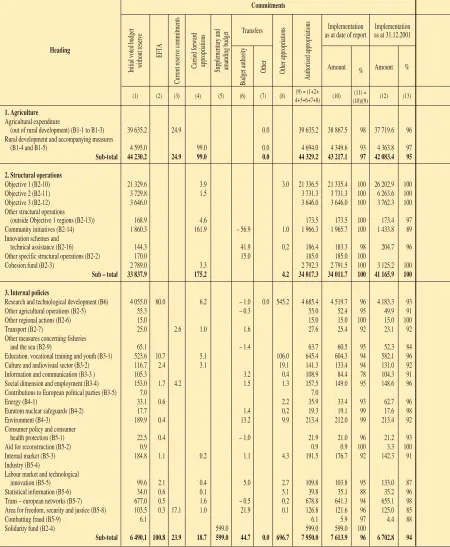
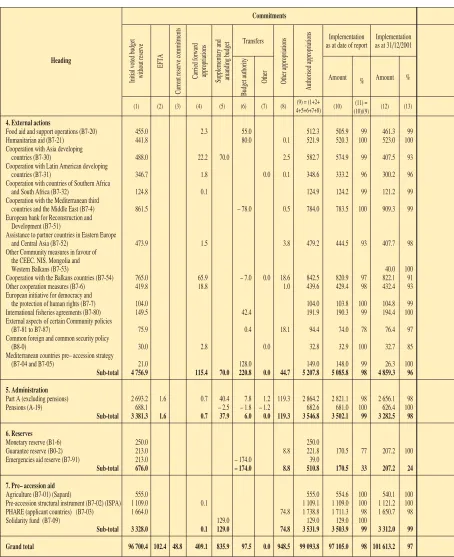
[image:22.595.86.539.85.784.2]TABLE 3
Implementation of commitments and payments as at 31 December 2002
Provisional data
Heading
Commitments
(1) (9) = (1+2+ 4+5+6+7+8)
(2) (3) (4) (5) (6) (7) (8) (10) (11) =
(10)/(9) (12) (13)
Initial voted budget without reserve
EFTA
Current reserve commitments
Carried forward appropriations Supplementary and amanding budget
Budget authority
Other Other appropriations
Authorised appropriations
Amount % Transfers Implementation as at date of report
Amount % Implementation as at 31.12.2001
1. Agriculture
Agricultural expenditure
(out of rural development) (B1-1 to B1-3) 39 635.2 24.9 0.0 39 635.2 38 867.5 98 37 719.6 96 Rural development and accompanying measures
(B1-4 and B1-5) 4 595.0 99.0 0.0 4 694.0 4 349.6 93 4 363.8 97
Sub-total 44 230.2 24.9 99.0 0.0 44 329.2 43 217.1 97 42 083.4 95
2. Structural operations
Objective 1 (B2-10) 21 329.6 3.9 3.0 21 336.5 21 335.4 100 26 202.9 100 Objective 2 (B2-11) 3 729.8 1.5 3 731.3 3 731.3 100 6 263.6 100 Objective 3 (B2-12) 3 646.0 3 646.0 3 646.0 100 3 762.3 100 Other structural operations
(outside Objective 1 regions (B2-13)) 168.9 4.6 173.5 173.5 100 173.4 97 Community initiatives (B2-14) 1 860.3 161.9 – 56.9 1.0 1 966.3 1 965.7 100 1 433.8 89 Innovation schemes and
technical assistance (B2-16) 144.3 41.9 0.2 186.4 183.3 98 204.7 96 Other specific structural operations (B2-2) 170.0 15.0 185.0 185.0 100
Cohesion fund (B2-3) 2 789.0 3.3 2 792.3 2 791.5 100 3 125.2 100
Sub – total 33 837.9 175.2 4.2 34 017.3 34 011.7 100 41 165.9 100
3. Internal policies
Research and technological development (B6) 4 055.0 80.0 6.2 – 1.0 0.0 545.2 4 685.4 4 519.7 96 4 183.3 93 Other agricultural operations (B2-5) 55.3 – 0.3 55.0 52.4 95 49.9 91
Other regional actions (B2-6) 15.0 15.0 15.0 100 15.0 100
Transport (B2-7) 25.0 2.6 1.0 1.6 27.6 25.4 92 23.1 92
Other measures concerning fisheries
and the sea (B2-9) 65.1 – 1.4 63.7 60.5 95 52.3 84
Education. vocational training and youth (B3-1) 523.6 10.7 5.1 106.0 645.4 604.3 94 582.1 96 Culture and audiovisual sector (B3-2) 116.7 2.4 3.1 19.1 141.3 133.4 94 131.0 92 Information and communication (B3-3 ) 105.3 3.2 0.4 108.9 84.4 78 104.3 91 Social dimension and employment (B3-4) 153.0 1.7 4.2 1.5 1.3 157.5 149.0 95 148.6 96 Contributions to European political parties (B3-5) 7.0 7.0
Energy (B4-1) 33.1 0.6 2.2 35.9 33.4 93 62.7 96
Euratom nuclear safeguards (B4-2) 17.7 1.4 0.2 19.3 19.1 99 17.6 98 Environment (B4-3) 189.9 0.4 13.2 9.9 213.4 212.0 99 213.4 92 Consumer policy and consumer
health protection (B5-1) 22.5 0.4 – 1.0 21.9 21.0 96 21.2 93
Aid for reconstruction (B5-2) 0.9 0.9 0.9 100 3.3 100
Internal market (B5-3) 184.8 1.1 0.2 1.1 4.3 191.5 176.7 92 142.3 91 Industry (B5-4)
Labour market and technological
innovation (B5-5) 99.6 2.1 0.4 5.0 2.7 109.8 103.8 95 133.0 87 Statistical information (B5-6) 34.0 0.6 0.1 5.1 39.8 35.1 88 35.2 96 Trans – european networks (B5-7) 677.0 0.5 1.6 – 0.5 0.2 678.8 641.3 94 655.1 98 Area for freedom, security and justice (B5-8) 103.5 0.3 17.1 1.0 21.9 0.1 126.8 121.6 96 125.0 85
Combatting fraud (B5-9) 6.1 6.1 5.9 97 4.4 88
Solidarity fund (B2-4) 599.0 599.0 599.0 100
Payments
(14) (15) (16) (17) (18) (19) (20) (21) (22) = (14+15+17 +18+19+20+21) (23)
(24) =
23/22 (25) (26) (27)
(28) = 27+10
-23+31 (29) (30) (31)
Initial voted budget without reserve
EFTA
Current reserve
payments
Carried forward appropriations
Supplementary and amanding budget Other appropriations Decommitments on RAL
as at 01.01.2002 (
1)
Authorised appropriations
Amount % Implementation as at date of report
Budget authority Other
Transfers
Amount % as at 01/01/2002
as at date of report Implementation
as at 31/12/2001 Stock of RAL
On RAL prior to 2002
On 2002 commit-ments Payments
39 635.2 24.9 585.8 0.0 40 221.0 39 171.1 97 37 170.4 94 586.1 231.3 534.9 38 636.2 – 51.2
4 595.0 99.0 0.0 4 694.0 4 349.6 93 4 363.8 97 4 349.6
44 230.2 24.9 684.8 0.0 44 915.0 43 520.7 97 41 534.2 94 586.1 231.3 534.9 42 985.8 – 51.2
18 818.0 3.0 18 821.0 15 369.1 82 13 789.5 71 30 883.8 36 711.8 13 432.0 1 937.2 -138.1 4 360.0 – 955.0 3 405.0 1 641.2 48 3 137.8 70 8 198.7 10 063.0 1 550.0 91.3 – 225.9 3 360.0 3 360.0 2 404.4 72 1 630.3 51 5 779.4 6 992.4 2 358.9 45.5 – 28.7
380.0 380.0 155.0 41 115.6 25 965.2 983.3 150.1 4.9 – 0.3
2 327.0 – 123.0 1.0 2 205.0 556.5 25 1 701.4 89 3 902.4 5 256.9 450.6 106.0 – 54.6
245.0 0.2 245.2 185.8 76 97.9 43 427.1 365.2 138.2 47.6 – 59.2
39.0 39.0 39.0 100 146.0 39.0
2 600.0 548.0 3 148.0 3 148.0 100 1 983.4 63 6 608.7 6 212.4 2 856.1 291.9 – 39.7
32 129.0 – 530.0 4.2 31 603.2 23 499.0 74 22 455.9 68 56 765.3 66 731.0 20 935.9 2 563.4 – 546.5
3 751.9 72.8 – 20.1 0.0 716.0 4 520.6 3 667.3 81 3 195.9 83 6 945.6 7 520.9 2 080.5 1 586.7 – 277.2
61.2 10.5 – 0.2 71.5 62.6 88 79.3 74 112.7 94.5 50.3 12.3 – 8.1
15.0 15.0 15.0 100 15.2 96 4.5 3.4 3.0 12.0 – 1.1
22.8 1.9 1.6 1.3 25.7 16.1 63 14.6 68 35.5 39.7 13.4 2.8 – 5.2
59.1 – 0.6 58.5 39.4 67 43.7 79 104.4 124.5 26.0 13.5 – 0.8
523.2 10.7 168.7 702.6 592.5 84 567.5 86 482.9 485.2 180.0 412.6 – 9.5
125.9 2.5 25.8 154.2 118.5 77 97.0 68 152.6 165.2 74.3 44.1 – 2.2
95.7 4.0 8.2 0.4 108.3 87.2 81 93.4 85 94.3 77.1 49.3 37.7 – 14.5
137.3 1.3 3.4 6.5 1.4 146.5 132.2 90 122.5 84 152.2 157.4 69.0 63.2 – 12.0
6.3 6.3
34.6 0.7 3.3 2.4 41.0 29.1 71 34.4 78 75.6 74.7 28.6 0.4 – 5.1
17.6 0.0 0.3 17.9 16.6 93 17.6 92 11.8 12.9 5.8 10.7 – 1.4
137.2 0.4 15.0 10.5 163.1 152.0 93 155.9 86 299.9 324.3 79.5 72.4 – 35.7
20.0 0.4 20.4 19.3 95 19.0 94 24.9 23.5 16.0 3.3 – 3.0
0.9 0.9 0.9 100 3.3 100 0.9
167.2 1.0 5.0 0.0 4.5 177.7 141.2 79 126.7 75 177.6 177.5 72.4 68.6 – 35.9
62.0 62.0
125.1 1.3 22.0 3.6 0.0 2.8 154.8 108.0 70 111.0 75 387.4 372.6 93.7 14.3 – 10.6
31.6 0.6 6.3 38.5 32.3 84 32.6 90 43.6 45.0 24.6 7.8 – 1.3
601.0 0.5 108.6 1.7 0.2 712.0 656.3 92 482.1 79 1 380.2 1 308.2 437.6 218.8 – 56.7 111.5 0.2 17.0 13.3 7.9 0.1 133.0 77.0 58 85.6 67 95.6 132.3 30.8 46.0 – 7.7
5.0 5.0 4.7 94 5.5 89 3.6 3.5 1.4 3.3 – 1.3
599.0 599.0 599.0 100 599.0
6 112.1 92.4 22.3 168.3 622.3 0.0 939.4 7 934.5 6 567.2 83 5 302.8 82 10 646.9 11 204.4 3 336.2 3 230.4 – 489.2
Heading
Commitments
(1) (9) = (1+2+ 4+5+6+7+8)
(2) (3) (4) (5) (6) (7) (8) (10) (11) =
(10)/(9) (12) (13)
Initial voted budget without reserve
EFTA
Current reserve commitments
Carried forward appropriations Supplementary and amanding budget
Budget authority
Other Other appropriations
Authorised appropriations
Amount % Transfers Implementation as at date of report
Amount % Implementation as at 31/12/2001
4. External actions
Food aid and support operations (B7-20) 455.0 2.3 55.0 512.3 505.9 99 461.3 99 Humanitarian aid (B7-21) 441.8 80.0 0.1 521.9 520.3 100 523.0 100 Cooperation with Asia developing
countries (B7-30) 488.0 22.2 70.0 2.5 582.7 574.9 99 407.5 93 Cooperation with Latin American developing
countries (B7-31) 346.7 1.8 0.0 0.1 348.6 333.2 96 300.2 96 Cooperation with countries of Southern Africa
and South Africa (B7-32) 124.8 0.1 124.9 124.2 99 121.2 99 Cooperation with the Mediterranean third
countries and the Middle East (B7-4) 861.5 – 78.0 0.5 784.0 783.5 100 909.3 99 European bank for Reconstruction and
Development (B7-51)
Assistance to partner countries in Eastern Europe
and Central Asia (B7-52) 473.9 1.5 3.8 479.2 444.5 93 407.7 98 Other Community measures in favour of
the CEEC. NIS. Mongolia and
Western Balkans (B7-53) 40.0 100
Cooperation with the Balkans countries (B7-54) 765.0 65.9 – 7.0 0.0 18.6 842.5 820.9 97 822.1 91 Other cooperation measures (B7-6) 419.8 18.8 1.0 439.6 429.4 98 432.4 93 European initiative for democracy and
the protection of human rights (B7-7) 104.0 104.0 103.8 100 104.8 99 International fisheries agreements (B7-80) 149.5 42.4 191.9 190.3 99 194.4 100 External aspects of certain Community policies
(B7-81 to B7-87) 75.9 0.4 18.1 94.4 74.0 78 76.4 97
Common foreign and common security policy
(B8-0) 30.0 2.8 0.0 32.8 32.9 100 32.7 85
Mediterranean countries pre– accession strategy
(B7-04 and B7-05) 21.0 128.0 149.0 148.0 99 26.3 100
Sub-total 4 756.9 115.4 70.0 220.8 0.0 44.7 5 207.8 5 085.8 98 4 859.3 96
5. Administration
Part A (excluding pensions) 2 693.2 1.6 0.7 40.4 7.8 1.2 119.3 2 864.2 2 821.1 98 2 656.1 98 Pensions (A-19) 688.1 – 2.5 – 1.8 – 1.2 682.6 681.0 100 626.4 100
Sub-total 3 381.3 1.6 0.7 37.9 6.0 0.0 119.3 3 546.8 3 502.1 99 3 282.5 98
6. Reserves
Monetary reserve (B1-6) 250.0 250.0
Guarantee reserve (B0-2) 213.0 8.8 221.8 170.5 77 207.2 100 Emergencies aid reserve (B7-91) 213.0 – 174.0 39.0
Sub-total 676.0 – 174.0 8.8 510.8 170.5 33 207.2 24
7. Pre– accession aid
Agriculture (B7-01) (Sapard) 555.0 555.0 554.6 100 540.1 100 Pre-accession structural instrument (B7-02) (ISPA) 1 109.0 0.1 1 109.1 1 109.0 100 1 121.2 100 PHARE (applicant countries) (B7-03) 1 664.0 74.8 1 738.8 1 711.3 98 1 650.7 98
Solidarity fund (B7-09) 129.0 129.0 129.0 100
Sub-total 3 328.0 0.1 129.0 74.8 3 531.9 3 503.9 99 3 312.0 99
Grand total 96 700.4 102.4 48.8 409.1 835.9 97.5 0.0 948.5 99 093.8 97 105.0 98 101 613.2 97
[image:25.595.127.581.163.720.2]Payments
(14) (15) (16) (17) (18) (19) (20) (21) (22) = (14+15+17 +18+19+20+21) (23)
(24) =
23/22 (25) (26) (27)
(28) = 27+10
-23+31 (29) (30) (31)
Initial voted budget without reserve
EFTA
Current reserve
payments
Carried forward appropriations
Supplementary and amanding budget Other appropriations Decommitments on RAL
as at 01.01.2002 (
1)
Authorised appropriations
Amount % Implementation as at date of report
Budget authority Other
Transfers
Amount % as at 01/01/2002
as at date of report Implementation
as at 31/12/2001 Stock of RAL
On RAL prior to 2002
On 2002 commit-ments Payments
420.8 420.8 416.3 99 483.8 99 996.9 1 035.7 323.0 93.3 – 50.8
441.8 50.0 51.0 0.1 542.9 474.2 87 561.1 90 376.9 361.4 193.6 280.6 – 61.7
465.1 2.5 467.6 454.3 97 383.1 96 2 032.0 2 047.9 354.9 99.3 – 104.7
318.4 – 85.0 0.0 0.1 233.5 181.8 78 152.0 66 1 276.6 1 393.7 177.5 4.2 – 34.1
148.5 – 12.4 136.1 119.3 88 99.5 82 455.7 446.8 118.8 0.5 – 13.8
678.6 5.2 4.2 180.0 0.5 863.3 843.4 98 579.0 93 3 782.6 3 581.2 605.2 238.3 – 141.6
8.4 8.4 8.4 100 7.4 100 43.9 35.4 8.4
542.7 – 74.5 3.8 472.0 395.1 84 382.4 88 1 445.1 1 456.2 361.1 34.1 – 38.2
0.1 0.1 0.1 100 40.7 49 0.2 0.1 – 0.1
781.7 100.0 – 6.4 18.6 893.9 749.2 84 920.0 87 907.2 955.9 421.0 328.2 – 22.9 411.1 65.0 – 13.5 0.0 1.1 463.7 387.2 84 301.6 65 840.0 803.2 320.2 67.3 – 78.6
100.7 3.0 103.7 93.8 90 54.3 56 242.6 234.3 83.7 10.1 – 18.3
152.8 42.4 195.2 186.2 95 192.0 89 16.6 20.6 4.1 182.1 – 0.2
88.1 0.2 – 8.0 18.2 98.5 64.5 65 42.0 69 211.7 198.6 50.8 13.8 – 22.6
35.0 7.0 – 6.0 36.0 30.9 86 29.5 67 33.7 27.5 14.1 16.8 – 7.9
20.5 8.5 29.0 18.9 65 2.5 19 31.7 160.6 15.1 3.9 – 0.2
4 614.2 5.2 226.4 79.2 0.0 44.9 4 964.7 4 423.6 89 4 230.9 86 12 693.4 12 759.0 3 051.6 1 372.5 – 595.9
2 693.2 1.6 242.3 40.4 7.8 1.2 136.9 3 123.4 2 758.2 88 2 588.6 88 261.2 284.0 222.3 2 535.6 – 39.3
688.1 – 2.5 – 1.8 – 1.2 682.6 679.3 100 625.2 100 679.3 – 1.6
3 381.3 1.6 242.3 37.9 6.0 0.0 136.9 3 806.0 3 437.5 90 3 213.8 90 261.2 284.0 222.3 3 214.9 – 40.9
250.0 250.0
213.0 8.8 221.8 170.5 77 207.2 100 170.5
213.0 – 33.0 180.0
676.0 – 33.0 8.8 651.8 170.5 26 207.2 24 170.5
370.0 370.0 123.9 33 30.5 6 1 038.6 1 468.8 123.9 0.1 – 0.4
704.4 – 198.0 506.4 398.4 79 203.2 58 1 931.7 2 642.3 331.6 66.8 – 0.1
1 520.7 0.0 74.8 1 595.5 1 101.2 69 1 167.8 79 3 728.2 4 305.4 1 010.7 90.4 – 33.0
129.0 129.0 129.0 100 129.0
2 595.1 – 69.0 0.0 74.8 2 600.9 1 752.5 67 1 401.5 61 6 698.5 8 416.5 1 466.2 286.3 – 33.5
1. Introduction
For budget year 2002, EUR 97 billion was committed from total available appropriations of EUR 99 billion, an implementation rate of 98 %. This compares with 97 % in 2001.
Payments made amounted to EUR 83.4 bil-lion from total available appropriations of EUR 96.5 billion, an implementation rate of
86 %, compared with 82 % in 2001. 'Struc-tural actions’ (EUR 8 billion), 'Agriculture’ (EUR 1.4 billion) and 'Internal policies’ (EUR 1.4 billion) mainly account for the unused ap-propriations of EUR 13.1 billion.
Of the unused appropriations in 2002, EUR 145 million for commitments and EUR 3.9 billion for payments were carried forward to the next financial year, under Article 9 of the new financial regulation.
Heading Implementation Implementation
of commitment appropriations (%) of payment appropriations (%)
2002 2001 2002 2001
1. Agriculture 97 95 97 94
2. Structural actions 100 100 74 68
3. Internal policies 96 94 83 82
4. External actions 98 96 89 86
5. Administration 98 98 90 90
6. Reserves 33 24 26 24
7. Pre-accession aid 99 99 67 61
Total 98 97 86 82
2. Agriculture (Heading 1)
(million EUR)
Initial Carryover Budget Other Total Imple- Implementation budget from SAB authority appropriations authorised mentation rate
2001 transfers appropriations 2002 (%)
Commitments 44 230 99 0 (1462-1462) 0 44 329 43 217 97 0
Payments 44 230 685 0 (1462-1462) 0 44 915 43 521 97 0
Agricultural expenditure for the year was EUR 43.5 billion, or 97 % of total available appropriations, compared with 94 % in 2001. Of the unused appropriations, EUR 84 million for commitments and EUR 315 million for payments were carried forward to 2003.
None of the EUR 25 million initial reserve was released during the year. The traditional
payment in direct aid to certain regions for the marketing year 2002/03, and for the milk and milk products sector (EUR 470 million) as a deteriorating market led to increased spending for the sector.
For 'CAP-related expenditure’ (Heading 1a), the under-utilisation mainly relates to veteri-nary and plant health measures (EUR 600 million) because of delays in finalising pay-ments related to foot-and-mouth disease (FMD). However, of EUR 440 million carried forward automatically from 2001 to the emer-gency fund, EUR 420 million was paid in
2002 to cover costs mainly related to FMD. Concerning the eradication of animal dis-eases, while EUR 166 million was committed in 2002, none was spent in the year and of EUR 111 million carried forward from 2001, EUR 97 million was paid mainly for the TSE monitoring programmes (EUR 63 million).
For Sub-heading 1b, under-spending of EUR 345 million was the net result of over-imple-mentation of the rural development pro-grammes by certain Member States and of under-implementation of the same pro-grammes by other Member States.
3. Structural actions (Heading 2)
(million EUR)
Initial Carryover Budget Other Total Imple- Implementation budget from SAB authority appropriations authorised mentation rate
2001 transfers appropriations 2002 (%)
Commitments 33 838 175 0 (62-62) 4 34 017 34 012 100 0
Payments 32 129 0 0 (548-1078) 4 31 603 23 499 74
530
Full implementation for commitments was reached for this heading with a small unutilised amount under 'Structural Funds’ for 'Innovative measures'.
Total payments for the heading amounted to EUR 23.5 billion, or 74 % of available appro-priations, an under-utilisation of around EUR 8 billion entirely related to the Structural Funds. This situation is an improvement on the implementation rate of 68 % in 2001 when unused appropriations amounted to EUR 10.5 billion. For the new Structural Fund pro-grammes 2000-06, EUR 19 billion in pay-ments were made, an implementation rate of 91 %, a significant improvement compared with EUR 14.6 billion or 70 % in 2001.
For the Structural Funds in 2002 the unused payment appropriations mainly relate to the
earlier programmes 1994-99, where payments amounted to EUR 1.2 billion of the EUR 7.3 billion available. In September 2002, the Commission had already pointed to the risk of a concentration of payment requests towards the deadline (31 March 2003) for Member States to present final payment requests, in contrast to the payment forecasts for 2002 by Member States which indicated full utilisation of available appropriations.
The year saw full utilisation for the Cohesion Fund payment appropriations of EUR 3.2 bil-lion, a significant improvement compared with EUR 2 billion or 63 % implemented dur-ing the same period in 2001.
EUR 7.6 billion or 96 % of total available ap-propriations was committed in 2002, com-pared with EUR 6.7 billion, an implementa-tion rate of 94 %, in 2001. Excluding third party appropriations, under-utilisation of com-mitment appropriations for this heading is in the region of EUR 150 million, spread across the heading and is mainly accounted for by EUR 37 million for 'Trans-European net-works', EUR 25 million for 'Information and communication', EUR 18 million for 'Educa-tion, vocational training and youth', EUR 18 million for 'Research and development’ and EUR 15 million for 'Internal market'.
Of the unused appropriations in 2002, EUR 22 million for commitments was carried for-ward to 2003.
Payments made amounted to EUR 6.6 billion, an implementation rate of 83 % compared with EUR 5.3 billion or 82 % in 2001.
The additional payment appropriations from contributions of the associate States to the
Community budget (third part appropriations) comprise equality between commitment and payment appropriations. However, the latter can be only implemented in stages, according to the duration and the progress of the pro-jects. A partial implementation of these appro-priations, corresponding to the payments of the advances, is consequently normal, and the remaining amounts will make it possible in the successive years to liquidate the RAL con-nected with these projects.
Without third party appropriations, unused ap-propriations for the heading are in the region of EUR 700 million and mainly concern EUR 305 million for 'Research and development', EUR 54 million for 'Trans-European net-works', EUR 55 million for 'Area for freedom, security and justice', EUR 44 million for 'Labour market and technology', and EUR 36 million for 'Internal market'.
Of the remaining appropriations in 2002, EUR 87 million for payments was carried for-ward to 2003.
4. Internal policies (Heading 3)
(million EUR) Initial Carryover Budget Other- Total Imple- Implementation budget from SAB authority appropriations authorised mentation rate
2001 transfers appropriations 2002 (%)
Commitments 6 490 19 599 (65-20) 798 7 950 7 614 96 45
Payments 6 112 168 0 (695-72) 1 032 7 935 6 567 83
622
5. External actions (Heading 4)
(million EUR) Initial Carryover Budget Other Total Imple- Implementation budget from SAB authority appropriations authorised mentation rate
2001 transfers appropriations 2002 (%)
Commitments 4 757 115 70 (356-135) 45 5 208 5 086 98 221
Payments 4 614 226 0 (333-254) 45 4 695 4 424 89
Under this heading, EUR 5.1 billion in com-mitments were made, an implementation rate of 98 %, slightly higher in comparison to 2001.
Excluding third-party appropriations, unused appropriations amounted to EUR 78 million, mainly: EUR 32 million for 'Assistance to partner countries in eastern Europe and Cen-tral Asia', EUR 17 million for 'Cooperation with Latin American countries’ and EUR 22 million for 'Cooperation with the Balkan countries'. Of the appropriations that could not be used before end-year 2002, EUR
35 million was carried forward to 2003.
All of the initial appropriations placed in re-serve were released to the heading during the year, including EUR 35 million to cover the financial contribution due for 2002 under the fisheries agreements with Angola and Sene-gal.
EUR 4.4 billion payments were made in 2002, an implementation rate of 89 % compared with 86 % in 2001.
Excluding third-party appropriations, unused appropriations amounted to EUR 520 million.
Of the remaining payment appropriations in 2002, EUR 32 million was carried forward to 2003. The under-utilisation is a combination of programmes committed late in the year, late reinforcements and an increase in the budget over the PDB, and is accounted for mainly by EUR 128 million for 'Cooperation with the Balkan countries', EUR 76 million for 'Assistance to partner countries in eastern Europe and Central Asia', EUR 76 million for 'Other cooperation measures', EUR 69 million for 'Humanitarian aid', and EUR 55 million for 'Cooperation with developing Latin Amer-ican countries'.
Of the initial EUR 52 million placed in re-serve, EUR 47 million was transferred to the heading, including EUR 35 million for 'Inter-national fisheries agreements'. A further EUR 33 million from the 'Emergency aid’ reserve was transferred to the heading, specifically for Humanitarian aid for Afghanistan and neigh-bours, Palestine and Southern Africa.
Through a combination of increasing pay-ments and a continued effort in screening old and dormant commitments, outstanding com-mitments (RAL) have been stable for this heading for the second consecutive year.
6. Administrative expenditure
Initial Carryover Budget Other Total Imple- Implementation budget from SAB authority appropriations authorised mentation rate
2001 transfers appropriations 2002 (%)
Commitments 3 381 0.7 38 (13-7) 121 3 547 3 502 99
6
Payments 3 381 242 38 (13-7) 139 3 806 3 438 90
6
The appropriations to pay wages were fully used up. For the first time since many years, there was no need to reinforce Chapter A-19 (Pensions).
an annual instalment under a long-term lease. In the context of the frontloading operation decided by the budgetary authority, execution of 2002 for rent includes also the payment of the rent for the beginning of 2003 which had to be paid before 1 January 2003. Under 'Buildings expenditure', budgetary lines con-nected with security had to be reinforced fol-lowing the attacks of 11 September 2001 and
the strengthening of safety measures adopted by the Commission.
Expenditure for the Official Journal (and to a lesser extent, those of the Publications Office) was influenced by the need to prepare publi-cation of the secondary legislation in the nine languages of the applicant countries. This in-volves the publication of some 80 000 pages by language.
7. Pre-accession aid (Heading 7)
Initial Carryover Budget Other Total Imple- Implementation budget from SAB authority appropriations authorised mentation rate
2001 transfers appropriations 2002 (%)
Commitments 3 328 0.06 129 0 75 3 532 3 504 99
Payments 2 595 0 0 (129-198) 75 2 601 1 753 67
69
For commitments, 99 % implementation was achieved under this heading, similar to the re-sult in 2001.
Payments amounting to EUR 1.8 billion were made, an implementation rate of 67 %, com-pared with EUR 1.4 billion or 61 % last year. This outcome translates to an under-utilisation of around EUR 800 million mainly related to
Recasting of the financial regulation applica-ble to the Community budget. On 25 June 2002 the Council adopted the new financial regulation applicable to the general budget of the European Communities. The regulation confines itself to stating the broad principles and basic rules governing the establishment and execution of the budget and financial con-trol whilst the associated implementing rules have been moved to their own specific regula-tion in order to produce a better hierarchy of norms.
The new financial regulation, which entered into force on 1 January 2003, has been changed as follows: simplification and legibil-ity of the rules applicable to all stages of
PART 1 — OVERVIEW
In line with the practice of recent years, this Financial Report examines in depth a particu-lar theme intended to show how EU funds have been used to the benefit of the EU tax-payer.
For the financial year 2002, the theme 'Security’ has been selected.
The following chapters (Parts) examine how EU resources, and the efforts of the Commis-sion services, have been employed together to enhance the security of the EU citizen in a wide range of areas - food safety, health pro-tection, transport safety, protection against en-vironmental hazards, civil and diplomatic pro-tection.
The report demonstrates what is being achieved under these areas: it also aims to show the advantages to be gained by tackling these issues at Community, as opposed to na-tional level, given that many are transnana-tional in nature and impact.
Link with the 2001 Report
Protection of EU citizens as consumers was examined in the 2001 edition of the Financial Report under the theme 'Consumers in the Eu-ropean Union'. This protection was given a new impetus when in May 2002, the Euro-pean Commission adopted a new consumer policy strategy specifying its overall political approach for the five year period, 2002-06, with three key objectives.
'A high common level of consumer
protec-tion'. This means harmonising, by the most appropriate means (e.g. framework direc-tive, standards, best practices), not just the safety of goods and services, but also those economic and legal interests that will enable consumers to shop with confidence any-where in the EU and by whatever means.
'Effective enforcement of consumer
pro-tection rules'. There is no good law if it is not properly enforced. In practice, con-sumers should be given the same protec-tion throughout the EU, and also in an en-larged EU. The priority actions are the development of an administrative coopera-tion framework between Member States and of redress mechanisms for consumers.
'Proper involvement of consumer
organisa-tions in EU policies'. For consumer protec-tion policies to be effective, consumers themselves must have an opportunity to contribute to the development of policies that affect them. Consumers and their rep-resentatives should have the capacity and resources to promote their interests on a similar footing as other stakeholders.
PART 2 - FOOD SECURITY
AND SAFETY FOR EU
CITIZENS
2.1. Introduction
Consumer confidence in the quality and safety of food products has been considerably shak-en during the last tshak-en years or so by the cumu-lative impacts of food-related health crises. Responding to the challenge, the European Union is implementing a comprehensive strat-egy to restore people's belief in the safety and quality of their food entitled 'From the farm to the fork'.
has been made in implementing many of the more than 80 separate actions outlined in the White Paper.
2.2. Safety is a producer
responsibility
The framework of the EU's drive for greater food safety is a general food law adopted as a regulation in January 2002. It is based on the following principles:
responsibility for ensuring the delivery of safe food and animal feeds belongs to the food and feed manufacturers. Unsafe foods and feed must be withdrawn;
foodstuffs, animal feed, food and feed
in-gredients must be traceable;
clear procedures should be established for
developing food law and dealing with food emergencies;
feeding stuffs will be covered by a rapid
alarm system to be triggered as soon as doubts arise about their safety. The system extends existing arrangements covering food to the feed sector and feed and food imports from outside the EU. It obliges no-tification of any direct or indirect threat to human health, animal health or the envi-ronment.
The regulation also:
established the European Food Safety
Au-thority (EFSA) which was launched later in 2002. Assessing and communicating the risk of possible threats to food safety is often very difficult. The Authority has been created because of the need for inde-pendent, scientific advice that is also trans-parent and open to scrutiny.
The main task of the EFSA is to provide sci-entific advice and support for Community leg-islation and policies in all fields having a
di-rect or indidi-rect impact on food and feed safe-ty. It will give independent information on these matters and communicate on risks in the food chain to the general public. The Authori-ty is to become a point of reference for all stakeholders, policymakers and the public by virtue of its independence, the scientific quali-ty of its opinions and its information to the public as well as the transparency of its proce-dures.
In addition to its own specialist personnel, the Authority will manage and be supported by networks of similar scientific and food safety organisations in the EU.
gave the Commission new powers to take
emergency measures when national au-thorities are unable to contain an emerging food risk. Such measures can be taken where it is evident that a feed and food originating in the EU, or imported from a third country, is likely to constitute a seri-ous risk to human health, animal health or the environment, and that such a risk can-not be contained satisfactorily by means of measures taken by the Member States. Such action can be initiated by the Com-mission itself, or be requested by a Mem-ber State.
Depending on the gravity of the situation, emergency measures can take the form of a suspension of the marketing or use of the feed or food in question, of subjecting the use and marketing of the feed or food to special condi-tions or any other appropriate interim mea-sure.
replaced three standing committees with