Int. J. Electrochem. Sci., 10 (2015) 7303 - 7319
International Journal of
ELECTROCHEMICAL
SCIENCE
www.electrochemsci.org
Response Surface Optimization of MWCNT modified Carbon
Paste Electrode for Zn(II) Determination
Rimal Isaac*, P. K. Praseetha
Department of Nanotechnology, Noorul Islam Centre for Higher Education (N.I. University), Kumaracoil, Thuckalay, Kanyakumari District, Tamilnadu, INDIA - 629180
*
E-mail: [email protected]
Received: 29 May 2015 / Accepted: 10 July 2015 / Published: 28 July 2015
A novel carbon paste electrode based on 3,7,12,17-Tetramethyl-8,13-divinyl-2,18-porphinedipropionic acid disodium salt (Ionophore) modified with multi-walled carbon nanotube (MWCNT) is fabricated for the selective determination of Zn2+. Central composite design (CCD) and response surface methodology is used in this work to study the effect of different independent variables and to optimize the variable for a particular response. Five variables namely, ionophore, MWCNT, sodium tetraphenylborate, paraffin oil and graphite were studied in a 33 experiment CCD. The slopes of the calibration graphs were measured as the response of the electrode. A mathematical model equation was obtained from computer simulations from the optimization studies. The optimized electrode showed a linear range of 1.0×10⁻¹
to 3.15×10⁻⁷ M and a detection limit of 2.5×10⁻⁷ M. The response time of the electrode was found to be 20 s and a slope of 30.73±0.81 mV/decade. The electrode showed a good selectivity for Zn2+ relative to many cations. Potentiometric titration was used to study the analytical application of the electrode. The optimized electrode was effectively used for the titration of Zn2+ with EDTA.
Keywords: carbon paste electrode; carbon nanotubes; ion selective; response surface design; zinc ion
1. INTRODUCTION
disease, diabetes, malignancy, and other chronic illnesses [5]. Excess of Zn causes tremors, microcytichypo chronic anemia, fewer chills pulmonary manifestation, diarrhea and gastroenteritis [6]. Zn functions as an efficient antioxidant and anti-inflammatory agent [7-10]. In industries, the uses of Zn include galvanizing, die castings and in alloys. The oxide of Zn is used in paints, cosmetics, pharmaceuticals, soaps and textiles. Excess of Zn in the environment can be a serious environmental pollution by decreasing the amount of microorganisms in the soil [11, 12]. This Zn causes contamination of food and agricultural wastes [13]. Because of the above said facts it is essential to develop more sensitive, accurate and analytical techniques to detect trace levels of Zn in the fields of medicine and environment.
There are many analytical methods available for the estimation of Zn, including potentiometry [14], flame atomic absorption spectrometry [15], UV-Vis spectroscopy [16], fluorescence methods [17] and inductively coupled plasma atomic emission spectrometry (ICPAES) [18]. The electronic configuration of Zn is 1s22s22p63s23p63d104s2, which shows a completely filled d-orbital thereby making it not suitable for techniques that require spectroscopic or magnetic signals [19]. Among these analytical techniques, potentiometric technique involving ion-selective electrodes (ISEs) offer better response, selectivity and repeatability in a cost effective manner. There are many ISEs employing polymeric membrane were developed for the determination of Zn [6, 19-29]. The ISEs employ a key component known as the ionophore, which interacts with the metal of interest forming a selective complex, thereby defines the sensitivity and selectivity of the system.
Over ISEs, Carbon paste electrodes (CPEs) are having more advantages like low ohmic resistance, stable response, renewability and there is no need of an internal solution. Carbon paste is made from graphite and mineral oil. In recent years, carbon nanotubes (CNTs) are extensively used in CPEs [30-33]. CNTs are a good candidate because of their ultra-light weight, high electrical conductivity, high aspect ratio, high mechanical strength, high thermal conductivity and high surface area [34].
[image:2.596.157.434.510.723.2]
In this present work, protoporphyrin IX disodium salt is used as the ionophore in a CPE modified with multi-walled CNT (MWCNT). The chemical structure of ionophore is given in fig. 1. In a previously reported study, the ionophore used was applied for the fabrication of Zn ion (Zn(II)) PVC membrane sensor [29]. The effects of individual variable used for the fabrication of CPE for the detection of Zn(II) such as the amounts of ionophore, sodium tetraphenylborate (NaTPB), graphite powder, paraffin oil and MWCNT were studied and the variables were optimized by using central composite design (CCD) under response surface methodology (RSM) by running least number of experiments.
2. EXPERIMENTAL
2.1. Materials
All the chemicals used were of the analytical grade and used as such without purification. All the solutions of the cations were prepared from the analytical grade of the corresponding chloride salt. Ultra-pure water is used for the preparation of salt solutions (Milli–Q System; Millipore Corp.). Graphite, sodium hydroxide and paraffin oil was purchased from Merck, Mumbai. MWCNT was purchased from United Nanotech Innovations Pvt. Ltd., Bangalore, India. Protoporphyrin IX disodium salt and Zinc chloride from Sigma Aldrich. Potassium chloride, manganous chloride and barium chloride were purchased from Spectrum chemicals, Cochin. Ammonium chloride, copper(II) chloride, Ethylenediaminetetraacetic acid disodium salt and NaTPB from Himedia, Mumbai. Sodium chloride and silver chloride from Loba chemie Pvt Ltd, Mumbai. Ferrous chloride and hydrochloric acid from NICE chemicals, Kochi. Tetrahydrofuran (THF) from High Purity Laboratory Chemicals Pvt. Ltd., Mumbai. Stannous chloride and cobalt chloride from Thomas Baker chemicals private Ltd, Mumbai.
2.2. Electrode fabrication
2.3. Potential measurement and selectivity coefficient determination
A homemade potentiometer coupled to a digital multimeter is used for the potential measurements [35]. pH measurements were made using a Medox Bio pH Meter. All the measurements were conducted at 25±0.1°C. Ag|AgCl electrode is used as the reference electrode for potential measurements. The potential measurements were done by using the following scheme of cell assembly:
Ag|AgCl, KCl (satd.) || test solution | CPE | Cu
The selectivity coefficient of the prepared electrode was determined by using fixed interference method [36]. In this method, the activity of the interfering ion (aB, 1.0 x 10⁻²) is kept constant and
varying the activity of primary ion (aA) by using the following equation:
(1)
za and zb are the charges of the primary ion, A and the secondary ion, B. Both zA and zB has the
same sign whether positive or negative.
2.4. Central Composite Design
CCD was used to optimize the independent factors, namely ionophore (X1), paraffin oil (X2), NaTPB (X3), graphite (X4) and MWCNT (X5) at five levels and 7 replicates (designed in Minitab 17) at the center point and are presented in table 1. The model equation can be expressed as
(2)
Where y is the predicted response (slope), xi’s and xj’s are the independent variable and β0, βi’s,
βij’s, βii’s are the model constant, linear coefficients, interaction coefficients and quadratic coefficients
respectively.
[image:4.596.82.518.627.749.2]The effect of each of the factors on the response can be obtained using RSM technique. It also allows to investigate the levels of the factors to which it affects the response. The results were analyzed by three-dimensional surface response, analysis of variance (ANOVA) and desirability function (DF). The significant terms were chosen on the basis of p value (p < 0.05), all the other terms were eliminated from the model using a backward elimination process.
Table 1. Factors and levels used in the Central Composite Design
Factors Levels
Low (-1) Central (0) High (+1) -α +α
X1: Ionophore (mg) 4 6 8 2 10
X2: Paraffin (drop) 3 5 7 1 9
X3: NaTPB (mg) 2 4 6 0 8
X4:Graphite (mg) 150 200 250 100 300
3. RESULT AND DISCUSSION
3.1. Central composite experimental design
[image:5.596.95.503.350.769.2]The effects of the five independent variables namely, ionophore (X1), paraffin oil (X2), NaTPB (X3), graphite (X4) and MWCNT (X5) was studied by measuring the response of each electrode. Table 2 shows the individual responses of the prepared electrode. ANOVA was carried out to study the effects of the variables involved and to validate the results obtained by CCD. The statistical significance of the variables is identified based on the p-value, p < 0.05 is considered statistically significant at 95% confidence interval. ANOVA results are presented in table 3. The comparison between variation from the model and the variation due to residual error is performed by Fisher’s F-test. It is the ratio between mean square of the model and the residual error [37]. The F-value obtained from table 3 as 133.25 is greater (2.41 at 95% significance) than the value found in the standard F-table. This shows the high fitting of the model.
Table 2. List of experiments in the central composite design (uncoded values) and their responses
Trial number
Factor levels Response
X1 X2 X3 X4 X5 Slope (mV)
Observed Predicted
1 4 3 2 250 10 13.88 12.91
2 8 7 6 250 20 16.33 16.38
3 8 3 2 150 10 22.45 21.84
4 4 7 2 250 20 39.42 39.11
5 4 7 6 150 20 41.22 41.48
6 8 7 6 150 10 45.12 45.65
7a 6 5 4 200 15 26.39 27.03
8a 6 5 4 200 15 27.08 27.03
9 4 3 2 150 20 8.55 7.67
10a 6 5 4 200 15 24.44 27.03
11a 6 5 4 200 15 28.55 27.03
12 4 3 6 150 10 22.45 22.58
13 8 3 6 150 20 33.44 33.45
14 8 7 2 250 10 45.74 45.70
15 4 7 2 150 10 16.22 16.39
16 8 3 6 250 10 46.2 46.12
17 8 7 2 150 20 19.25 19.30
18a 6 5 4 200 15 29.23 27.03
19 4 7 6 250 10 42.15 42.32
20 4 3 6 250 20 14.56 14.21
21 8 3 2 250 20 49.7 48.61
22a 6 5 4 200 15 26.45 27.03
24 6 5 4 100 15 24.45 24.26
25 6 5 4 200 25 22.18 22.87
26 6 1 4 200 15 14.45 16.00
27a 6 5 4 200 15 27.67 27.03
28 10 5 4 200 15 55.23 55.46
29 6 9 4 200 15 31.55 30.74
30 6 5 4 300 15 37.57 38.51
31 6 5 8 200 15 25.32 24.59
32 6 5 0 200 15 10.45 11.92
33 6 5 4 200 5 31.29 31.19
a
7 replicates of center point
[image:6.596.94.504.69.249.2]From the ANOVA results all the factors are more significant (P < 0.001) in the response of the electrode. The regression coefficients and the regression equation for the model is given in table 4. The positive and negative signs in the regression equation show the synergistic and antagonistic effect of the variables [38]. From the regression equation, all the factors are having positive signs, this shows the synergistic effect of the variables on the response. The suitability of the polynomial equation is determined by the values of regression coefficient (R2 = 0.9942 and adjusted R2 = 0.9867) which shows good distribution of result around the mean. The fitting between the observed slope and the predicted slope is presented in fig. 2 and it shows a good correlation with the experimental data (R2 = 0.99), which shows that the model can be applied to explain the experimental data.
Table 3. Analysis of Variance for slope
Source of Variation Degrees of Freedom Sum of Squares Mean Square
F-Value P-Value
Model 18 4532.06 251.781 133.25 0.000
X1 1 605.41 605.412 320.41 0.000
X2 1 325.75 325.754 172.4 0.000
X3 1 240.67 240.667 127.37 0.000
X4 1 304.74 304.736 161.28 0.000
X5 1 104 104 55.04 0.000
X1*X1 1 640.19 640.185 338.81 0.000
X2*X2 1 25.36 25.362 13.42 0.003
X3*X3 1 145.85 145.85 77.19 0.000
X4*X4 1 35.88 35.876 18.99 0.001
X1*X2 1 688.01 688.013 364.12 0.000
X1*X3 1 91.97 91.968 48.67 0.000
X1*X4 1 16.28 16.281 8.62 0.011
X1*X5 1 155.25 155.252 82.16 0.000
X2*X4 1 15.25 15.249 8.07 0.013
X3*X4 1 692.48 692.479 366.48 0.000
X3*X5 1 297.56 297.563 157.48 0.000
X4*X5 1 36.54 36.542 19.34 0.001
Residual Error 14 26.45 1.890
Lack-of-Fit 9 11.85 1.316 0.45 0.859
Pure Error 5 14.61 2.921
[image:7.596.103.496.72.183.2]Total 32
Table 4. Characteristics of the constructed model
Response R2 R2
adjustment
R2 prediction
Regression equation
Slope 99.42% 98.67% 96.22% Slope = -169.3 + 1.97*X1
+ 19.13*X2 + 29.19*X3 + 0.2393*X4 + 5.458*X5 + 1.1488*X1*X1 0.2287*X2*X2 0.5484*X3*X3 + 0.000435*X4*X4
- 1.6394*X1*X2 - 0.5994*X1*X3 + 0.01009*X1*X4 - 0.3115*X1*X5 0.00976*X2*X4 0.2142*X2*X5 0.06579*X3*X4 0.4313*X3*X5
0.00604*X4*X5
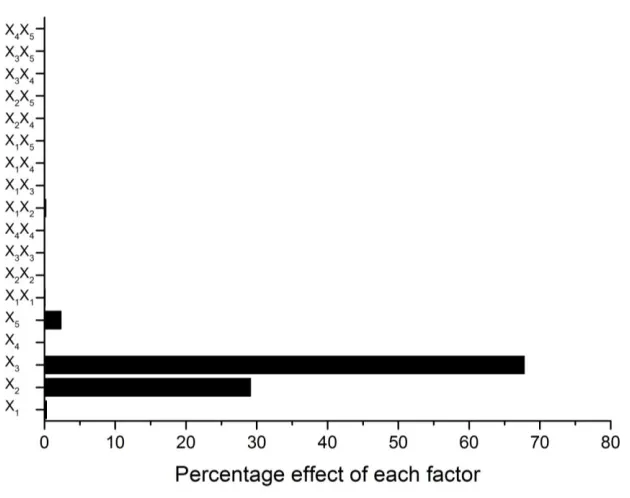
The response surface plots for the response slope is shown in fig. 3. The interacted factors are shown in the figure while keeping the other factors constant in the constructed model. The middle level is chosen as the constant levels. The curvature nature of the plot shows strong interaction between the variables. From the graphs it is evident that all the factors affect the response of the model. Also in order to study the effect of the factors on the response, Pareto analysis was carried out [39]. Pareto analysis calculates the percentage effect (Pi) of the different factors on the response based on the
following equation:
(3) where βi is the coefficient of regression of the individual variables.
Figure 2. Plot of observed slope vs predicted slope
[image:8.596.90.508.384.677.2]
Figure 4. Percentage effect of factors by Pareto analysis
3.2. Optimization of design
The response optimizer option under Minitab with desirable function is used for the optimization of the process. A scale in the range of 0.0 (undesirable) to 1.0 (desirable) was used to optimize the process. The optimal condition (Fig. 5) at which the slope was 29.55 mV/decade was found to be as ionophore (9.9832 mg), paraffin oil (drop) (9), NaTPB (7.9642 mg), graphite (100 mg) and MWCNT (19.2234 mg). Running the experiments with the optimum values resulted in a slope of 31.91 mV, validating the model.
[image:9.596.52.544.538.703.2]
3.3. Emf response and effect of pH
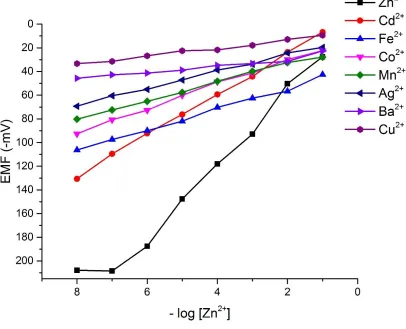
[image:10.596.108.514.268.597.2]The performance characteristics of the prepared electrode was studied based on the recommendations from IUPAC [40]. The response of the electrode towards various metal ions are studied within the concentration range of 1.0 x 10⁻¹ M to 1.0 X 10⁻⁸ M as shown in fig. 6. From the graph it is clear that the electrode showed a Nernstian slope from Zn2+ and poor response for other ions. The calibration graph of the electrode is given in fig. 7. The working linear concentration range of the electrode was found to be 1.0 x 10⁻¹ M to 3.15 x 10⁻⁷ M. in this range the electrode showed a Nernstian slope of 31.91 mV decade-1. The detection limit of the electrode was calculated from the calibration graph from the intersection of two extrapolated linear segments and was found to be 2.5 x 10⁻⁷ M.
Figure 6. Potential response of the optimized electrode to difference cations.
from the formation of Zn2+ ion hydroxyl complexes and at lower pH the deviation may be caused by the partial protonation of the ionophore [41, 42].
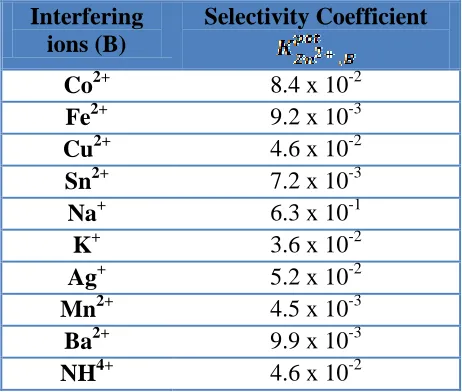
3.4. Selectivity coefficient evaluation
[image:11.596.113.462.279.572.2]The response of any ion selective electrode for a primary ion in the presence of other ions is expressed as potentiometric selectivity coefficient. It gives the basic information of interferences in an ion selective electrode response. The selective coefficient is determined by fixed interference method by using eqn. (1) at a fixed concentration of foreign ions (1.0 x 10⁻² M) and varying the concentration of Zn2+ ions. The graphically calculated selectivity coefficient values are given in table 5.
Figure 7. Calibration graph of the optimized electrode for the detection of Zn2+.
Table 5. Potentiometric selectivity coefficient values determined using fixed interference method for the optimized electrode.
Interfering ions (B)
Selectivity Coefficient
Co2+ 8.4 x 10⁻²
Fe2+ 9.2 x 10⁻³
Cu2+ 4.6 x 10⁻²
Sn2+ 7.2 x 10⁻³
Na+ 6.3 x 10⁻¹
K+ 3.6 x 10⁻²
Ag+ 5.2 x 10⁻²
Mn2+ 4.5 x 10⁻³
Ba2+ 9.9 x 10⁻³
NH4+ 4.6 x 10⁻²
3.5. Response time, repeatability, reproducibility and lifetime
For any analytical application of the electrode, the response characteristics are very important. Response time is the time required to reach 90% of the final equilibrium values after immersion in a series of altered concentration of Zn2+ solutions, each having a tenfold difference in concentration. The prepared electrode showed a response time less than 20 s over all concentration ranges. The repeatability was recorded by measuring the concentration of Zn2+ in 1.0 x 10⁻³ M solution for several times (N = 3). The relative standard deviation was ± 1.65 mV. This shows the electrode response is highly repeatable. Five similar electrodes were prepared and their reproducibility was checked at optimum (table 6). The slope was found to be 30.73±0.81 mV/decade that strongly shows that the electrode response is reproducible. The electrode response was checked for a period of 4 weeks. Over these period the response was obtained without any considerable change.
Table 6. The reproducibility of the electrode response at optimum composition.
Electrode Slopea Correlation
coefficient
Linear Rangeb
1 31.91 0.994 0.1-0.31
2 30.50 0.998 0.1-0.31
3 31.14 0.998 0.1-0.31
4 30.34 0.996 0.1-0.63
5 29.77 0.993 0.1-0.31
RSD = ±0.81 Average slope = 30.73
Average = 0.995 a
mV/decade concentration
b
[image:12.596.146.449.586.750.2]
Figure 8. Effect of pH on the response of optimized electrode; [Zn2+] = 1.0 x 10⁻³ M.
Figure 9. Variation of potential with Zn2+ concentration in the presence of different concentration of Na+.
3.6. Analytical application
[image:13.596.180.408.395.588.2]
ions from the used di-sodium EDTA salt [43]. However the sharp breakpoint in the graph corresponds to the potentiometric determination of Zn2+.
[image:14.596.94.477.129.465.2]Figure 10. Potentiometric titration curve for Zn2+ (1.0 x 10⁻³, 10 mL) against EDTA (1.0 x 10⁻²) using the prepared optimized electrode as an indicator electrode.
Table 7. Comparison of the analytical characteristics of Zn selective electrodes
Ionophore Slopea L.R.b R.T.c D.L.d Reference
Zn-bis(2,4,4-trimethylpentyl)dithiophosphinic 30.1 2.8×10⁻⁵ - 1.0×10⁻¹ 15 - [44] 4-tert-butylcalix[4]arene 28.0 ± 1.0 9.8×10⁻⁶ - 1.0×10⁻¹ 30 5.0×10⁻⁷ [45] N,N′-bis(acetylacetone)ethylenediimine 30.0 1.0×10⁻⁶ - 1.0×10⁻¹ 15 - [23]
N,N′-phenylenebis (salicylideaminato)
29.4 ± 0.2 5.0×10⁻⁷ - 1.0×10⁻¹ <10 2.6×10⁻⁷ [26]
18-crown-6, dibenzo 18-crown-6
30.0 29.0
1.0×10⁻⁵
– 1.0×10⁻¹ ≤15 1.5×10⁻⁶ 7.5×10⁻⁶
[46]
2,6-Diacetylpyridinebis(benzenesulfonylhydrazide)
29.06 ± 0.1 1.0×10⁻⁶ - 1.0×10⁻¹ 20 1.0×10⁻⁷ [25]
3,7,12,17-Tetramethyl-8,13-divinyl-2,18-porphine-dipropionic acid in PVC membrane
electrode
30.0 1.3×10⁻⁵ - 1.0 ×10⁻¹ 10 - [29]
12-crown-4 29.5 ± 1.0 7.0×10⁻⁵ – 1.0×10⁻¹ < 10 - [47] 6,7:14,15-Bzo2
-10,11-(4-methylbenzene)-[15]-6,14-diene-9,12-dimethylacrylate-
[image:14.596.56.543.565.763.2]
9,12-N2-1,5-O2
N,N′-Bis(2-dimethylaminoethyl)-N,
N′-dimethyl-9,10 anthracenedimethanamine 30.0 ± 0.5 1.0×10
−5
- 1.0×10⁻¹ 15 1.5×10⁻⁶ [49]
NiO nanostructures and 12-crown-4 36.0 1.0×10⁻⁶ - 1.0×10⁻¹ 10 5.0×10⁻⁷ [19]
dimethyl-8,13-divinyl-3,7,12,17-tetramethyl-21H, 23H-porphine-2,18-dipropionate
29.0 ± 1.0 1.5×10⁻⁵
- 1.0×10⁻¹ 10 - [50]
1,12,14-triaza-5,8-dioxo-3(4),9(10)-dibenzoyl-1,12,14-triene
29.2 ± 0.4 1.3×10⁻⁷ – 1.0×10⁻¹
7 1.0×10⁻⁸ [6]
1,13-diaza-
2,3;11,12;15,18-tribenzo-4,7,10-trioxacyclononaoctane-14,19-dione
30.0 ± 1.0 1.0×10⁻¹ – 9.0×10⁻⁵
20 5.0×10⁻⁵ [21]
tetra(2-aminophenyl) porphyrin 26.5 5.0×10⁻⁵ - 1.0×10⁻¹ 10 3.0×10⁻⁵ [51] zinc salt of di(2-ethylhexyl)phosphoric acid
dissolved in tri(2-ethylhexyl)phosphate
43.8 - - 4.5 ±
0.1 pZn
[20]
N-[(ethyl-1 pyrrolidinyl-2)methyl] methoxy-2 sulfamoyl-5 benzamide
29.3 1.0×10⁻⁵ – 1.0×10⁻¹ 20 7.0×10⁻⁶ [22]
2,2,2-cryptand 22.0 2.06 ppm - 6.54×10³ ppm
<10 - [52]
dibenzo-24-crown-8 29.0 ± 0. 5 9.2×10⁻⁵ - 1.0×10⁻¹ 12 - [43] tetrabutyl thiuram disulfide 28.0 1.0×10⁻¹ – 1.0×10⁻⁶ 10 4.2×10⁻⁷ [24] bis(2-nitrophenyl)disulfide 29.9 ± 0.4 2.9×10⁻⁷ - 3.2×10⁻² 10 - [53]
3,7,12,17-Tetramethyl-8,13-divinyl-2,18-porphinedipropionic acid disodium salt
30.73±0.81 1.0×10⁻¹ - 3.15×10⁻⁷ 20 2.5×10⁻⁷ This work
amV per decade concentration. b
Linear Range (M).
cResponse time (s). dDetection Limit (M).
4. CONCLUSION
To the best of author’s knowledge, this is the first time a CPE incorporating a nanomaterial is developed for Zn2+ ion using RSM. In this work by using CCD and subsequent RSM, the effect of different factors are analyzed and optimized. The optimized electrode showed a linear concentration range of 1.0×10⁻¹
to 3.15×10⁻⁷ M and a detection limit of 2.5×10⁻⁷ M. The selectivity coefficient values for most of the ions are very small except Na+. The electrode showed good response in the pH range of 2.7 to 7.0. Comparison of this study with reported studies on ion selective electrodes for Zn2+ ion is given in table 7. The repeatability and lifetime of the electrode was studied and it was successfully used in potentiometric titration as an indicator electrode for Zn2+ against EDTA.
ACKNOWLEDGEMENT
The authors are highly thankful to Dr. A. P. Majeed Khan, Chairman of Noorul Islam Centre for higher Education for providing with the facilities to undertake the work.
References
1. K. Kaur, R. Gupta, S. A. Saraf, and S. K. Saraf, Compr. Rev. Food Sci. Food Saf., 13 (2014) 358. 2. T. M. Bray, and W. J. Bettger, Free Radical Biol. Med., 8 (1990) 281.
4. N. F. Shay, and H. F. Mangian, J. Nutr., 130 (2000) 1493S.
5. A. S. Prasad, Biochemistry of zinc, Plenum Press, New York (1993). 6. S. Chandra, and D. R. Singh, J. Saudi Chem. Soc., 14 (2010) 55. 7. S. R. Powell, J. Nutr., 130 (2000) 1447S.
8. A. S. Prasad, B. Bao, F. W. J. Beck, O. Kucuk, and F. H. Sarkar, Free Radical Biol. Med., 37 (2004) 1182.
9. M. P. Zago, and P. I. Oteiza, Free Radical Biol. Med., 31 (2001) 266. 10. A. S. Prasad, J. Trace Elem. Med. Biol., 28 (2014) 364.
11. A. Voegelin, S. Pfister, A. C. Scheinost, M. A. Marcus, and R. Kretzschmar, Environ. Sci. Technol., 39 (2005) 6616.
12. J. Mertens, F. Degryse, D. Springael, and E. Smolders, Environ. Sci. Technol., 41 (2007) 2992. 13. E. Callender, and K. C. Rice, Environ. Sci. Technol., 34 (2000) 232.
14. C. R. T. Tarley, V. S. Santos, B. E. L. Baêta, A. C. Pereira, and L. T. Kubota, J. Hazard. Mater., 169 (2009) 256.
15. M. Soylak, M. Tuzen, A. S. Souza, M. d. G. A. Korn, and S. L. C. Ferreira, J. Hazard. Mater., 149 (2007) 264.
16. C. E. Säbel, J. M. Neureuther, and S. Siemann, Anal. Biochem., 397 (2010) 218. 17. P. Jiang, and Z. Guo, Coord. Chem. Rev., 248 (2004) 205.
18. L. Chew, D. Bradley, A. Y. Mohd, and M. M. Jamil, Appl. Radiat. Isot., 53 (2000) 633.
19. M. A. Abbasi, Z. H. Ibupoto, M. Hussain, Y. Khan, A. Khan, O. Nur, and M. Willander, Sensors, 12 (2012) 15424.
20. U. Fiedler-Linnersund, and K. M. Bhatti, Anal. Chim. Acta, 111 (1979) 57.
21. M. Shamsipur, S. Rouhani, M. R. Ganjali, H. Sharghi, and H. Eshghi, Sens. Actuators, B, 59 (1999) 30.
22. M. Saleh, and A. Gaber, Electroanalysis, 13 (2001) 104.
23. V. Gupta, S. Agarwal, A. Jakob, and H. Lang, Sens. Actuators, B, 114 (2006) 812. 24. R. Kojima, and S. Kamata, Anal. Sci., 10 (1994) 409.
25. I. M. Isa, S. M. Noor, Y. Juahir, N. Hashim, M. Ahmad, A. Kamari, A. Mohamed, S. Ab Ghani, and N. I. Wardani, Int. J. Electrochem. Sci., 9 (2014) 4512.
26. M. Hosseini, S. D. Abkenar, M. Ganjali, and F. Faridbod, Mater. Sci. Eng., C, 31 (2011) 428. 27. Q. Fu, S. Qian, N. Li, Q. Xia, and Y. Ji, Int. J. Electrochem. Sci., 7 (2012) 6799.
28. F. Mizani, and M. Ziaeiha, Int. J. Electrochem. Sci., 7 (2012) 7770.
29. V. Gupta, D. Chauhan, V. Saini, S. Agarwal, M. Antonijevic, and H. Lang, Sensors, 3 (2003) 223. 30. H. Beitollahi, H. Karimi-Maleh, and H. Khabazzadeh, Anal. Chem., 80 (2008) 9848.
31. H. Karimi-Maleh, P. Biparva, and M. Hatami, Biosens. Bioelectron., 48 (2013) 270. 32. M. Elyasi, M. A. Khalilzadeh, and H. Karimi-Maleh, Food Chem., 141 (2013) 4311. 33. I. Noviandri, and R. Rakhmana, Int. J. Electrochem. Sci., 7 (2012)
34. P. M. Ajayan, Chem. Rev., 99 (1999) 1787.
35. R. T. da Rocha, I. G. Gutz, and C. L. do Lago, J. Chem. Educ., 72 (1995) 1135. 36. Y. Umezawa, K. Umezawa, and H. Sato, Pure Appl. Chem., 67 (1995) 507.
37. M. Mourabet, A. El Rhilassi, H. El Boujaady, M. Bennani-Ziatni, and A. Taitai, Arabian J. Chem., (2014) 10.1016/j.arabjc.2013.12.028.
38. M. Ghaedi, A. Asfaram, B. Mirtamizdoust, A. Bazrafshan, and S. Hajati, RSC Adv., 5 (2015) 42376.
39. A. I. Khuri, and J. A. Cornell, Response Surfaces : Designs and Analyses, M. Dekker, New York (1996).
40. R. P. Buck, and E. Lindner, Pure Appl. Chem., 66 (1994) 2527.
41. M. R. Ganjali, F. Faridbod, P. Norouzi, and M. Adib, Sens. Actuators, B, 120 (2006) 119.
43. V. Gupta, M. Al Khayat, A. Minocha, and P. Kumar, Anal. Chim. Acta, 532 (2005) 153. 44. V. K. Gupta, A. K. Jain, L. P. Singh, and U. Khurana, Electrochim. Acta, 43 (1998) 2047. 45. V. Gupta, R. Goyal, M. Al Khayat, P. Kumar, and N. Bachheti, Talanta, 69 (2006) 1149. 46. M. A. Akl, and M. H. A. El-Aziz, Arabian J. Chem., (2011) 10.1016/j.arabjc.2011.09.009. 47. V. K. Gupta, Sens. Actuators, B, 55 (1999) 195.
48. P. Singh, A. K. Singh, and A. Jain, Electrochim. Acta, 56 (2011) 5386.
49. N. R. Gupta, S. Mittal, S. Kumar, and S. A. Kumar, Mater. Sci. Eng., C, 28 (2008) 1025. 50. V. Gupta, A. Kumar, and R. Mangla, Sens. Actuators, B, 76 (2001) 617.
51. A. Fakhari, M. Shamsipur, and K. Ghanbari, Anal. Chim. Acta, 460 (2002) 177. 52. S. K. Srivastava, V. K. Gupta, and S. Jain, Anal. Chem., 68 (1996) 1272.
53. M. Gholivand, and Y. Mozaffari, Talanta, 59 (2003) 399.