Int. J. Electrochem. Sci., 7 (2012) 6571 - 6579
International Journal of
ELECTROCHEMICAL
SCIENCE
www.electrochemsci.orgThermo-Electrochemical Study on the Heat Effects of LiFePO
4Lithium-ion Battery During Charge-Discharge Process
Liubin Song1,2, Xinhai Li1,*, Zhixing Wang1, Xunhui Xiong1, Zhongliang Xiao2, Feng Zhang2
1
School of Metallurgical Science & Engineering, Central South University, Changsha 410083, China
2
School of Chemistry & Biological Engineering, Changsha University of Science & Technology, Changsha 410004, China
*
E-mail: liubinsong1981@126.com
Received: 25 June 2012 / Accepted: 20 July 2012 / Published: 1 August 2012
The heat effects of lithium-ion battery cathode could substantially affect the safety and attenuate lifetime of lithium-ion battery. In order to disclose the thermo-electrochemical behaviors of LiFePO4
battery during charge-discharge process at various rates at 30℃, electrochemical-calorimetric measurements were employed in this study. The results showed that LiFePO4 battery had a smaller
polarization and a better reversibility at low rate (0.1C, 0.2C, 0.5C). With the increasing of the rate structure of cathode material LiFePO4 was partially destroyed and impurities, like Li3PO4 and FeP2,
appeared at rate 1.0C and 2.0C. Formation of these impurities resulted in electrochemical performance deterioration of battery. The charge-discharge process of LiFePO4 battery accompanied exothermic
process and endothermic process at low rate (0.1C, 0.2C). When the rate increased to 1.0C, only exothermic phenomena existed. With the rate increasing heat production rate and the enthalpy change during charge-discharge process of LiFePO4 battery increased. These suggest that appropriate rate for
battery should be choose in order to avoid safety problem, which initiated by internal heat accumulation of battery.
Keywords: Heat effect, thermo electrochemistry, LiFePO4, lithium-ion battery, electrochemical
calorimetry
1. INTRODUCTION
is one of the most important issues in the lithium-ion batteries at high temperature or high charge/discharge rate will lower charge/discharge efficiency and lower the battery life, or even cause safety problem[1-5].
Olivine-type LiFePO4 is regarded as the most promising alternative cathode material for
Lithium-ion batteries because of its advantages of higher theoretic capacity (170 mAh·g-1), lower cost, higher safety, and environmental friendliness. However, LiFePO4 has low electronic and ion
conductivities, low tap density, and poor low-temperature character. A large number of efforts have been made to overcome the electronic and ionic transport limitations by doping with super-valent cations, incorporating nanostructured designs, or coating electronically conductive agents. Much has been reported about the electrochemistry and structures of LiFePO4 material[6-10], but little has been
reported on such thermal behavior of this material as this paper. Understanding the thermal behavior of these heat generation sources would offer much valuable information to develop the battery thermal management strategies as well as cell design, optimization and operation. In the battery operation, the heat generation is mainly ascribed to the electrochemical reactions, the active polarization and the electric conductive resistance. In addition, high rates greatly increase the rate of heat generation in a battery. If the rate of heat generation is faster than heat dissipation, the battery temperature increases. This may bring the battery to a thermal runaway condition.
Calorimetry is an effective method to characterize the thermal behavior of batteries, various materials have been tested to evaluate their performance and to study their thermal behavior using electrochemical-calorimetric methods with commercial Li-ion cells[11-18]. However, researches are rarely focused on the point of analysis of thermodynamics parameters from button cells with microscale active material. These parameters from pocket-size cell are very important in optimizing battery design, fabrication, thermal management for the applications and model building through which the thermal characteristics of lithium-ion batteries can be studied conveniently.
In this paper, we focus the characterization of heat generation occurring during charge and discharge, especially cycling at various rates, by calorimetric measurement. And the emphasis of this is to analyze different heat generation sources a button cell.
2. EXPERIMENTAL
2.1. Materials
Commercially available LiFePO4 powders and N-methyl-2-pyrrolidone (NMP) were provided
2.2. Battery preparation
Active material LiFePO4 was mixed with acetylene black, PVDF binder (mass ratio of
LiFePO4, acetylene black and PVDF is 80:10:10) in NMP onto an aluminum foil current-collector. The
electrodes were dried at 120℃ under vacuum for 6 h and pressed using a hydraulic press. CR2025 button cells were assembled using lithium metal foil as anode and the above prepared electrode as cathodes, Celgard 2300 microporous membrane was used as separator. LiPF6 (1.0M) in a 1:1:1 (v/v/v)
mixture of ethylene carbonate (EC), dimethyl carbonate (DMC) and ethylmethyl carbonate (EMC) was used as electrolyte. The cells were assembled in an argon-filled glove box.
2.3. Electrochemical-calorimetric measurements
The electrochemical and thermodynamic properties of LiFePO4 were measured by using
CR2025 button cell. Charge-discharge performances were evaluated using a Land automatic battery test system (CT2001A, China). The charge/discharge voltage region was 2.2-3.8V, and the current was 0.1C, 0.2C, 0.5C, 1.0C and 2.0C rate. Heat generation occurring during charge and discharge was recorded by an eight-channel micro-calorimeter (3114/3236 TAM Air, Swiss). The calorimeter was electrical calibrated at 303.15K before experiment. As shown in Fig. 1, LiFePO4/Li CR2025 button
[image:3.596.111.487.491.731.2]cell was put into the ampoule bottle, which was hanging up in the channel of micro-calorimeter. The calorimeter was then stabilized at constant temperature (303.15K) for 12 h. The positive and negative terminals of the button cell were connected to the external Land automatic battery test system with the aid of 2 copper wires, and then the charge/discharge studies at 0.1C, 0.2C, 0.5C, 1.0C and 2.0C rate were carried out. The thermal spectra were recorded after electrode reaction started.
2.4. Structure analysis
The button cell was disassembled after the electrochemical-calorimetric experiment. The powder X-ray diffraction (XRD, Rint-2000, Rigaku) measurement (Cu Kα radiation with a step time of
20 min-1) was carried out to identify the crystalline phase of LiFePO4.
3. RESULTS AND DISCUSSION
3.1. Electrochemical performances of LiFePO4
The initial charge-discharge curves of LiFePO4 at different charge-discharge rate are shown in
Fig. 2. It can be shown from Fig. 2 that the lower rate, the greater charge-discharge capacity, the flatter charge-discharge platform, and the smaller voltage difference between the charge platform and discharge platform. Therefore, the battery had a smaller polarization and a better reversibility during low range charging and discharging process. Structure and morphology of cathode material was partially destroyed in the charge-discharge process with high current density. So with the increasing of charge-discharge rates, charge-discharge capacity of battery reduced. For example, the discharge capacity of LiFePO4 at 0.1C rate is 151.3mAh g-1, and at 2.0C rate is 144.5 mAh g-1.
-20 0 20 40 60 80 100 120 140 160 180 2.4 2.6 2.8 3.0 3.2 3.4 3.6 3.8 4.0 4.2
-20 0 20 40 60 80 100 120 140 160 180 2.4 2.6 2.8 3.0 3.2 3.4 3.6 3.8 4.0 4.2
-20 0 20 40 60 80 100 120 140 160 180 2.4 2.6 2.8 3.0 3.2 3.4 3.6 3.8 4.0 4.2
-20 0 20 40 60 80 100 120 140 160 180 2.4 2.6 2.8 3.0 3.2 3.4 3.6 3.8 4.0 4.2
[image:4.596.136.464.425.688.2]-20 0 20 40 60 80 100 120 140 160 180 2.4 2.6 2.8 3.0 3.2 3.4 3.6 3.8 4.0 4.2 (d) (d) (e) (e) (a)0.1C (b)0.2C (c)0.5C (d)1.0C (e)2.0C (c) (c) (b) (b) (a) (a) Capacity (mAh/g) Vo lt a g e / V
Figure 2. The rate capacity of LiFePO4
In order to verify above analysis results, the crystalline nature of the cathode material LiFePO4
shows the X-ray diffraction (XRD) patterns of the cathode material LiFePO4 at different
charge-discharge rates. All the diffraction peaks deflected to high angle, the relative peak areas and intensities ascended slightly on increasing charge-discharge rates, most of which is 0.5C. These facts elucidate crystalline phase content of the cathode material LiFePO4 was increased. With the increasing of charge-discharge rates 3 new diffraction peaks was observed in the XRD pattern at 1.0C and 2.0C.These diffraction peaks belong to respectively Li3PO4 phase, Fe2O3 phase and FeP2 phase by
indexing PDF card. In charge process, part of Fe3+ ions formed Fe2O3 compound, and iron deficiency
in crystal lattice LiFePO4 might result in some Fe2+ sites were occupied by other ions, and impurities,
like Li3PO4 and FeP2, appeared. Formation of these impurities will result in electrochemical
performance deterioration of the cathode materials.
10 20 30 40 50 60 70 80
In
te
n
s
it
y
(a
.u
)
2()
Li3PO
4
Fe2O3
0.5C 1C 2C
Fresh
[image:5.596.141.453.276.493.2] FeP2
Figure 3. The XRD patterns of the cathode material LiFePO4 before and after cycling
3.2. Thermal behaviors of LiFePO4
Fig. 4 shows the variation in the heat flow of LiFePO4 battery, as a function of time at different
charge-discharge rates (0.1C, 0.2C, 0.5C, 1.0C, 2.0C). It can be shown from Fig. 4 that two obvious exothermic peaks appeared at all the curves of heat flow and voltage of LiFePO4 with time at different
charge-discharge rates. The heat flow slowly increased at the initial stage of charge-discharge process at 0.1C and 0.2C rate, but increased rapidly at 0.5C, 1.0C and 0.2C rate. With the increasing of the rate, the heat flow increased during the charge-discharge process, and that’s because irreversible heat production rate of the battery increased with the increasing of the charge-discharge rate[19]. The whole charge-discharge stage of LiFePO4 battery accompanied exothermic process and endothermic process
heat played a dominant part in the charge-discharge process when its’ current was large. Heat effect during charge-discharge process of battery came mainly from irreversible heat, which produced by overcoming battery internal resistance. When the battery was in maximum discharge degree, great irreversible heat produced due to the electrodes reached at serious polarization state. Irreversible heat showed an exothermic effect no matter the charge process or the discharge process.
40000 60000 80000 100000 120000 140000
0.50 0.55 0.60 0.65 0.70 0.75 Vo lta g e (V) Voltage Rest H e a t f lo w (mW) Time (s) (0.1C) Charge Rest Discharge Heat flow 2.5 3.0 3.5 4.0 4.5
40000 60000 80000 100000 0.30 0.35 0.40 0.45 0.50 0.55 H e a t fl o w (mW) Time (s) (0.2C) Vo lt a g e (V) Rest Charge Rest Discharge Voltage Heat flow 2.5 3.0 3.5 4.0 4.5
20000 30000 40000 50000 -0.25 -0.20 -0.15 -0.10 -0.05 0.00 0.05 0.10 Vo lt a g e (V) Time (s) H e a t fl o w (mW) (0.5C) Rest Charge Rest Discharge Voltage Heat flow 2.5 3.0 3.5 4.0 4.5
175000 180000 185000 190000 195000 200000 -0.10 -0.05 0.00 0.05 0.10 0.15 0.20 0.25 0.30 0.35 0.40 0.45 0.50 0.55 (1.0C) Time (s) Vo lt a g e (V) H e a t fl o w (mW) Rest Charge Rest Discharge Voltage Heat flow 2.5 3.0 3.5 4.0 4.5
[image:6.596.64.540.179.691.2]185000 190000 195000 200000 205000 -0.25 -0.20 -0.15 -0.10 -0.05 0.00 0.05 0.10 0.15 0.20 0.25 0.30 0.35 0.40 0.45 0.50 0.55 0.60 0.65 Time (s) Vo lta g e (V) H e a t flo w (mW) 2.5 3.0 3.5 4.0 4.5 (2.0C) Rest Charge Rest Discharge Voltage Heat flow
Figure 4. Change curves of heat flow and voltage of LiFePO4 with time at different charge-discharge
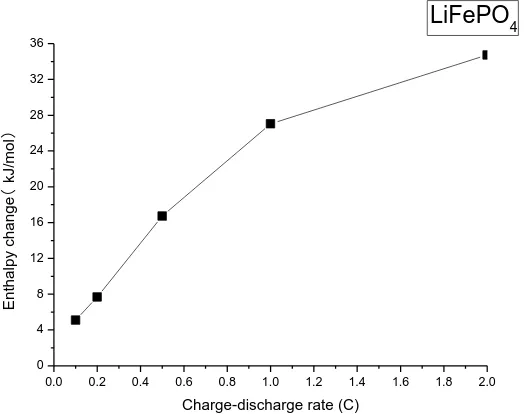
The Enthalpy change for LiFePO4 at various charge-discharge rates (0.1C, 0.2C, 0.5C, 1,0C
and 2.0C) are shown in Fig. 5. Heat production rate was linearly related to the rate, and decreased with the rate decreasing. The smaller the rate, the less the total heat production rate, the less the total enthalpy change in the reaction and the higher the safety performance of the battery.
0.0 0.2 0.4 0.6 0.8 1.0 1.2 1.4 1.6 1.8 2.0 0
4 8 12 16 20 24 28 32 36
En
th
a
lp
y
ch
a
n
g
e
(
kJ/
mo
l
)
Charge-discharge rate (C)
LiFePO
[image:7.596.169.431.170.377.2]4
Figure 5. Enthalpy change against charge-discharge rate of LiFePO4
The enthalpy charge (△H) was calculated by the following equation:
total ch disch ( ) (1)
q q q
h t dt( )
(2) i t dt
Q n
F F
total/ (3)
ch disch
H H H q n
where qtotal is total heat production rate in the reaction, h(t) is the heat flow at time t, n is the
number of electrons passed in the reaction, Q is quantity of electricity in the reaction, F is the Faraday’s constant, and i(t) is the current at time t. Table 1 summarizes detailed information about heat generations for LiFePO4/Li CR2025 button cell.
LiNi0.8Co0.2O2 at different current levels[20]. Heat production rate of battery during the charge and
discharge process at 2.0C were 815.161 mW·s, 824.476 mW·s, respectively (Table. 1), and at 0.1C were 305.632 mW·s, 111.524 mW·s, respectively.
Table 1. Heat generation parameters for LiFePO4/Li CR2025 button cell
Rate qch
(mW·s)
qdisch
(mW·s)
qtotal
(mW·s)
Q (C)
n×105 (mol)
∆Hch
(kJ·mol-1)
∆Hdisch
(kJ·mol-1)
∆H (kJ·mol-1)
0.1C -305.632 -111.524 -417.156 7.892 8.179 -2.296 -2.804 -5.100
0.2C -344.543 -193.615 -538.158 6.753 6.999 -1.911 -5.778 -7.689
0.5C -496.809 -609.307 -1106.116 6.384 6.616 2.139 -18.858 -16.719
1.0C -986.232 -964.530 -1950.762 6.960 7.212 -0.107 -26.942 -27.049
2.0C -815.161 -824.476 -1639.637 4.555 4.721 0.293 -35.024 -34.731
*where the footnotes ch and disch correspond to the charge and discharge processes, respectively.
4. CONCLUSIONS
The thermal stability of cathode materials plays a key role in lithium-ion battery safety, and the electrochemical-calorimetric measurements show good performance in studying the thermo-electrochemical behaviors of LiFePO4.
(1) The lower rate, the greater charge-discharge capacity, the flatter charge-discharge platform, and the smaller voltage difference between the charge platform and discharge platform. Therefore, the LiFePO4 battery had a smaller polarization and a better reversibility at low rate. With the increasing of
the rate structure of cathode material LiFePO4 was partially destroyed, electrochemical performance
deteriorated.
(2) The whole charge-discharge stage of LiFePO4 battery accompanied exothermic process
and endothermic process at low charge-discharge rate (0.1C, 0.2C). When the rate increased to 1.0C, only exothermic phenomena existed. With the rate increasing heat production rate and the enthalpy change during the charge-discharge process of LiFePO4 battery increased.
Based on the experiment results obtained in this article, we could conclude that appropriate charge-discharge rate for battery should be choose in order to avoid safety problem, which initiated by internal heat accumulation of battery.
ACKNOWLEDGMENTS
This work was supported by Major Special Plan of Science and Technology of Hunan Province, China (No.2009FJ1002 & No.2011FJ1005) and the Hunan Provincial Scientific Program of China
References
1. G. W. Ling, X. P. Zhu, Y. B. He, Q. S. Song, B. H. Li, Y. J. Li, Q. H. Yang, Z. Y. Tang, Int. J. Electrochem. Sci. 7 (2012) 2455.
2. H. B. Rem, X. Y. Liu, H. P. Zhao, Z. H. Peng, Y. H. Zhou, Int. J. Electrochem. Sci. 6 (2011) 727. 3. Z. Zhang, D. Fouchard, J. R. Rea, J. Power Sources 70 (1998) 16.
4. N. Sato, J. Power Sources 99 (2001) 70.
5. S. C. Chen, C. C. Wan, Y. Y. Wang, J. Power Sources 140 (2005) 111.
6. S. Franger, F. L. Cras, C. Bourbon, H. Rouault, J. Power Sources 199 (2003) 252.
7. R. Dominko, M. Bele, M. Gaberscek, M. Remskar, D. Hanzel, S. Pejovnikand, J. Jamnik, J. Electrochem. Soc. 152 (2005) 607.
8. D. H. Kim, J. Kim, J. Phys. Chem. Solids 68 (2007) 734.
9. J. Gao, J. J. Li, X. M. He, C. Y. Jiang, C. R. Wan, Int. J. Electrochem. Sci. 6 (2011) 2818. 10.H. C. Wong, J. R. Carey, J. S. Chen, Int. J. Electrochem. Sci. 5 (2010) 1090.
11.X. W. Zhang, J. Electrochim. Acta 56 (2011) 1246. 12.H. F. Jin, Z. Liu, J. Power Sources 189 (2009) 445. 13.K. Onda, T. Ohshima, J. Power Sources 158 (2006) 535. 14.Y. Saito, J. Power Sources 146 (2005) 770.
15.S. A. Hallaj, J. Prakash, J. R. Selman, J. Power Sources 87 (2000) 186.
16.Z. Y. Jiang, J. Zhang, L. J. Dong, J. H. Zhuang, J. Electroanal. Chem. 469 (1999) 1.
17.J. S. Hong, H. Maleki, S. A. Hallaj, L. Redey, J. R. Selman. J. Electrochem. Soc. 145 (1998) 1489. 18.Y. Kobayashi, H. Miyashiro, K. Kumai, K. Takei, T. Iwahori, I. Uchida. J. Electrochem. Soc. 149
(2002) 978.
19.V. Vilayanurras, Viswanathan, D. W. Choi, D. H. Wang W. Xu, T. Silas, R. E. Williford, J. G. Zhang, J. Liu, Z. G. Yang, J. Power Sources 195 (2010) 3720.
20.W. Q. Lu, H. Yang, J. Prakash, J. Electrochim. Acta 51 (2006) 1322.