Int. J. Electrochem. Sci., 10 (2015) 2892 - 2903
International Journal of
ELECTROCHEMICAL
SCIENCE
www.electrochemsci.org
Electrodeposition of Cu-Zn Intermetallic Compounds for Its
Application as Electrocatalyst in the Hydrogen Evolution
Reaction
J.C. Ballesteros*, C. Gómez-Solís, L. M. Torres-Martínez, I. Juárez-Ramírez
Universidad Autónoma de Nuevo León (UANL), Facultad de Ingeniería Civil, Departamento de Ecomateriales y Energía, Av. Fidel Velázquez y Av. Universidad S/N, Ciudad Universitaria, C.P. 64451, San Nicolás de los Garza, Nuevo León, México.
*
E-mail: [email protected]
Received: 29 October 2014 / Accepted: 6 February 2015 / Published: 24 February 2014
Electrodeposition of copper-zinc intermetallic compounds (particularly CuZn5) has been carried out
onto an AISI 1018 steel substrate from an alkaline non-cyanide solution at room temperature. The electrodeposits of Cu-Zn alloy were characterized by cyclic voltammetry (CV), cronoamperometry (CA), linear voltammetry (LV), scanning electron microscopy (SEM) and X-ray diffraction (XRD) techniques. The formation of the CuZn5 intermetallic compound was associated with the
underpotential deposition of zinc and its intercalation into the lattice of copper. Analysis of the chronoamperograms obtained was used for understanding of nucleation and growth mechanism during the formation of these intermetallic compounds. Finally, the electrocatalytic activity of the intermetallic compounds obtained was testes for hydrogen evolution reaction.
Keywords: Electrodeposition alloy; Underpotential deposition; Intermetallic compounds; Alkaline Non-cyanide solution; Cu-Zn; Electrocatalyst
1. INTRODUCTION
solvent choice, and the effects of solution additive which are adsorbed onto the cathode surface and inhibit the growth pattern.
Electrocrystallization has two competing processes: nucleation and grain growth. If a deposition starts on an electrode surface of a different material (that of the object to be plated) the first step will be the formation of nuclei of the new phase and their growth into crystals with the characteristic lattice. Then, once the electrode surface is fully covered by a few atomic layers of this metal, the layer is thickened into a macroscopic deposit. Nucleation is an improbable event and is achieved at an electrode surface by the application of a large overpotential. The nuclei, once formed, grow quite rapidly at comparatively low overpotentials, and in constant-current operation. The overpotential will decrease substantially once nucleation has occurred [1, 2].
W. Plieth [3] has carried out a discussion on the new properties of the intermetallic compounds (ICs) formed by electrochemical deposition. An important property of the ICs is its good durability and catalytic activity when these compounds are used as electrocatalysts [4-8].
The electrodeposition of α-brass (Cu-Zn) alloy is one of the most highly produced coatings industrially. The α-Brass electrolytic is typically produced by using cyanide containing electrolytes [1, 8]. The yellow-gold α-brass is widely applied due to its properties: corrosion protection, decoration and adhesion improvement to rubber. Other non-cyanide alkaline plating baths have been investigated [9-29] and recently by our research group [30] from an alkaline non-cyanide solution containing glycine. Despite many published works on the Cu-Zn electrodeposition, very little is known about formation of Cu-Zn intermetallic compounds and its applications [18, 19, 23, 31]. One of great electrocatalytic applications of Cu-Zn alloy was reported by Mácová and Bouzek [32, 33] for NO3
-reduction in a weakly alkaline solution, in where the results showed an enhancement of the electrocatalytic activity; the highest electrocatalytic activity for electroreduction of NO3- was obtained
using an electrode containing 41 wt. % Zn. in the Cu-Zn alloy. Other authors have published the production of ammonia from nitrates as an alternative of production of green fuel [34-36].
The CuZn5 intermetallic compounds were tested to know its electrocatalytic performance for
the hydrogen evolution reaction (HER) and this material can be considered as a good electrocatalyst for the production of hydrogen.
2. EXPERIMENTAL
The electrolytic solution was prepared with copper(II) sulfate pentahydrate, zinc sulfate heptahydrate and glycine, which were purchased from Sigma-Aldrich and then used for the preparation of the solution electrolytic: 0.1 Cu(II) + 0.2 M Zn(II) + 1.8 M glycine, at pH 10.0 and 25°C. All solutions were prepared using ultra-pure water (Millipore-Q system) and it was deoxygenated by bubbling N2 for 20 minutes before each experiment. The electrodeposition of Cu-Zn alloys was carried
about a 0.1 µm thick Ni layer was electrodeposited from commercial Watts bath onto steel electrode. A Pt wire with an exposed area greater than the working electrode was used as counter electrode. A saturated calomel electrode (SCE) was used as reference, and in this work all potentials are refer to this scale. The electrochemical experiments were carried out with a potentiostat/galvanostat AUTOLAB PGSTAT 302N connected to a personal computer running the system software NOVA for control of experiments and data acquisition. The electrochemical techniques applied to study of nucleation mechanis of alloy were cyclic voltammetry, chronoamperometry and polarization curves. The solution temperature was controlled at 25°C utilizing a circulating water thermostat (Bioblock Scientific). Coating morphology was evaluated using a scanning electron microscope (SEM Zeiss Ultra-55) equipped with an energy-dispersive X-ray spectroscopy (EDS). In this study, the chemical composition of alloy coatings was determined with EDS. The Cu-Zn alloys obtained were characterized by X-ray powder diffraction (XRD) using a Bruker D8 Advance diffractometer with CuKα radiation ( = 1.5406 Å).
3. RESULTS AND DISCUSSION
3.1 Study by cyclic voltammetry
-1.6 -1.4 -1.2 -1.0 -0.8 -0.6 -0.4 -0.2 0.0 -40
-30 -20 -10 0 10 20 30 40 50
E = -1.61 V E = -1.4 V
C'' B'
A'' A'
C'
C
B
j,
m
A
c
m
-2
E, V
A
[image:3.596.120.436.408.642.2]E = -0.73 V
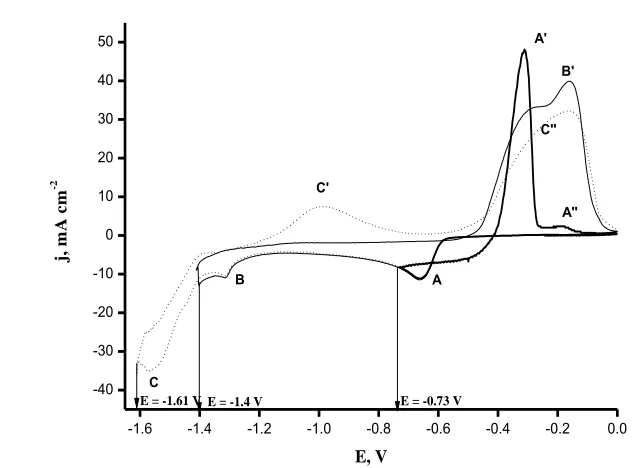
Figure 1. Comparison of the voltammograms obtained from electrolytic solution at different switching potential (-0.73 V, -1.4 V and -1.61 V). Scan rate (v) of 10 mV s-1.
obtained from electrolytic solution at different switching potential. When the switching potential was -0.73 V, the cathodic part of the curve a in Figure 1 exhibits the peak A (EPA = -0.66 V), which is
associated with the reduction of Cu (II) ions to Cu (0). Previous studies [30, 37] have demonstrated that this electrodeposition process is from reduction of the CuG2 complex (where G- is the anion form
of glycine), which is controlled by mass transfer. The anodic part of this curve a shows a fast increase in the cathodic current due to the growth of the first nuclei and then two crossovers between the positive and negative scans are observed, which are characteristic for nucleation process [37, 38]. The crossovers at -0.42 V and -0.62 V are known as equilibrium (ECO) and nucleation (EN), respectively. At
potentials more positive than ECO, two anodic peaks (A’ and A’’) are observed at potentials -0.31 v and
-0.18 V, respectively. The peak A’ is associated with the oxidation of Cu electrodeposited during the potential scan in negative direction. The small oxidation peak A’’ can be attributed to oxidation of other copper phase electrodeposited in peak A.
-1.4 -1.2 -1.0 -0.8 -0.6 -0.4 -0.2 0.0 -20
-10 0 10 20 30 40 50 60
B'
B
j,
m
A
c
m
-2
E, V
A
Hold
(a) (b)
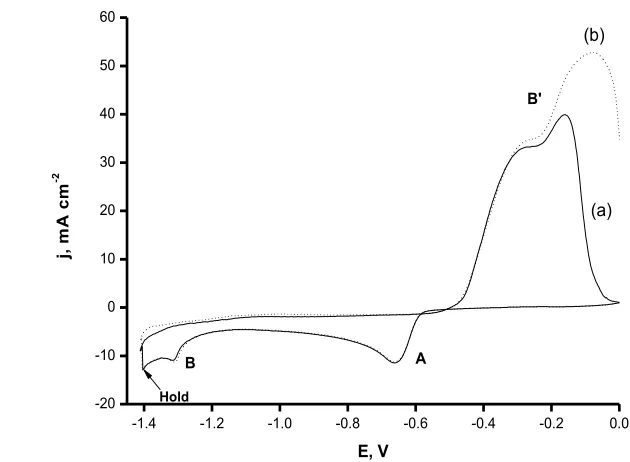
Figure 2. Cyclic voltammetry of copper-zinc alloy that shows the effect of time of halt at −1.40 V (cathodic polarization) on the anodic peak B’: (a) t = 0 s and (b) t = 60 s. Scan rate (v) of 10 mV s-1.
When the inversion of the positive potential scan is occurred at -1.4 V, the cathodic part of the voltammogram shows an additional peak B. In previous studies [39], we have demonstrated that the reduction peak B corresponds to underpotential deposition (UPD) of Zn. In the anodic sweep, two crossovers are newly observed at EN = -0.58 V and ECO = -0.51 V. This result indicates that a
[image:4.596.119.434.297.528.2]
alloy formation by via electrochemical, at least one metal is electrodeposited by UPD, this is a factor for the possible formation of intermetallic compounds.
Finally, the curve c in Figure 1 illustrates the cyclic voltammogram corresponding at inversion potential -1.61 V. This voltammogram shows during cathodic scan the presence of three peaks A, B and C; the anodic part of this voltammogram indicates two peaks C’ and C’’, which are associated to the dissolution of two distinct phases of Cu-Zn alloys. The peak C’ is attributed to the dissolution of a zinc-rich phase and C’’ to the dissolution of copper-rich phase. In the literature [23] has been mentioned that the phases formed in the Cu-Zn by via electrochemical differ from those in metallurgical method, and the results have showed the coexistence of intermetallic compounds ɛ-CuZn5 and ɤ-Cu5Zn8. It is important to mention that in this case the crossovers were no detected.
An additional study by cyclic voltammetry was conducted in order to know if new phases of Cu-Zn can be detected within the potential range -1.4 V to 0 V. Figure 2 shows a comparison of two voltammograms obtained from this study. These curves were started from the open circuit potential at scan rate of 10 mV s−1 and scanned in the negative direction. The potential scan was switched at -1.4 V to the positive direction. The curve a) in Figure 2 indicates that cathodic and anodic peaks A, B and B’ are recorded. In the curve b) it is possible to observe that the magnitude of peak B’ is depending on polarization time. When cathodic polarization is maintained at –1.4 V during a hold time of 60 s, an increase of current of peak B’ is observed. These results indicate that new compounds of Cu-Zn alloy were not formed in peak B under these conditions.
3.2 Morphological and structural characterization of Cu-Zn alloys
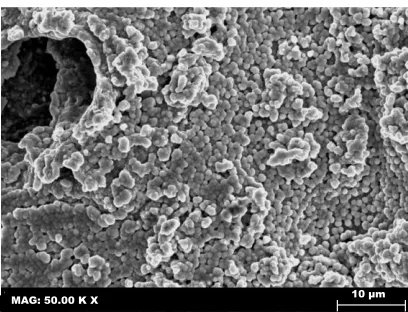
Cu-Zn alloys samples were prepared by the chronoamperometry technique at -1.30 V and -1.55 V, which are the peak potential of the processes A and B. The potentiostatic experiments were conducted on the working electrode and after electrolysis the samples were washed by water and immediately analyzed. The time of electrodeposition was of 10 minutes. The SEM images of the surface morphology of these samples are shown in Figure 3.
[image:5.596.196.400.551.707.2]MAG: 50.00 K X 10 µm
Figure 3. SEM micrographs of Cu-Zn films obtained at two deposition potentials (Ed): (a) -1.55 V and
Figure 3a shows that the morphology of the deposit obtained at – 1.55 V is formed by small spherical crystallites and its particle size was estimated to be around 1.50 µm. However, the Cu–Zn electrodeposit obtained at -1.3 V was formed by crystallites of irregular size and smaller in size, see Figure 3b. High magnification image is showed in Figure 3b, which reveal that the electrodeposit at -1.3 V is composed of small nanoparticles with diameter of between 50-500 nm.
An additional study by energy-dispersive spectroscopy (EDS) indicated that the global chemical composition in both samples is rich in zinc. At -1.3 V the zinc-rich Cu-Zn alloy contains a Zn and Cu concentration of 55 wt. % and 45 wt. %, respectively; while at -1.55 V the chemical composition was 72 wt. % Zn and 28 wt. % Cu.
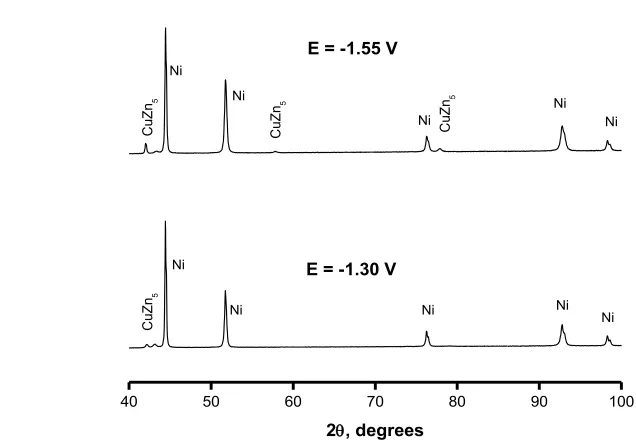
X-ray powder diffraction (XRD) patterns revealed the phase of as-obtained Cu-Zn alloys. Figure 4 shows the XRD pattern of samples obtained at -1.30 V and -1.55 V. Both patterns show reflection peaks that could be readily indexed to pure nickel and small reflections that are corresponding with the CuZn5 intermetallic compound (JCPDS Card No. 00-035-1151). No other
diffraction peaks associated to steel were found in the XRD pattern besides the peaks of nickel and CuZn5, which can be attributed to the thickness of the nickel layer. These results also indicate that the
ɛ-phase can be obtained by via electrochemical at low concentration of zinc (< 80 wt. %) in comparison with metallurgical methods.
40 50 60 70 80 90 100
E = -1.55 V
Ni Ni Ni
Ni Ni
Ni Ni Ni
Ni
C
uZn
5
C
uZn
5
C
uZn
5
C
uZn
5
2, degrees
Ni
[image:6.596.118.436.393.613.2]E = -1.30 V
Figure 4. DRX patterns of Cu-Zn films obtained at two deposition potentials: (a) -1.55 V and (b) -1.30 V.
3.3 Study by chronoamperometry
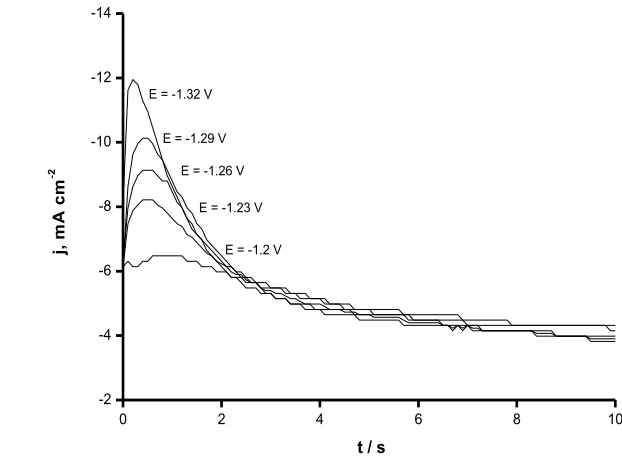
electrodeposition of metallic alloys [44-47]. Potentiostatic typical current density-transient curves are shown in Figure 5 in the negative potential range from -1.2 to -1.32 V for the voltammetric peak A.
0 2 4 6 8 10
-2 -4 -6 -8 -10 -12 -14
E = -1.32 V
E = -1.29 V
E = -1.26 V
E = -1.23 V
t / s
j,
m
A
c
m
-2
E = -1.2 V
Figure 5. Typical family of potentiostatic transients obtained at different potential during the electrodeposition of Cu-Zn alloy in the voltammetric peak A.
For Cu-Zn co-deposition in Figure 5, each transient has two well-defined recognizable zones. The first zone corresponds to the increase in cathodic current density up to a maximum, which is typical of crystal nucleation and growth processes. The second zone corresponds to the decline in the current density, which is typical of a diffusion-controlled process.
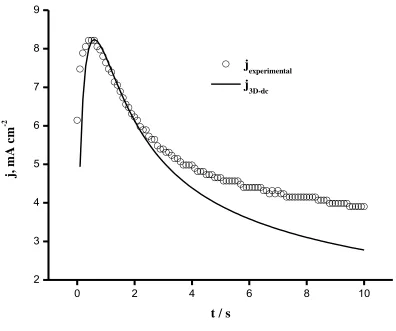
To extract quantitative information on the kinetic parameters associated with crystal nucleation and growth processes from the current density transients, we consider that the current density is well described by the theoretical model proposed by O. Díaz-Morales et al. [47] associated with the diffusion-controlled nucleation and growth of bimetallic crystals in 3D (i3D-dc).
In developing the model for the description of the kinetics of nucleation and growth of bimetallic systems, Díaz-Morales and coworkers [47] assumed that charge transfer steps during reduction of ions leading to the inclusion of metal atoms into bimetallic clusters are fast, thus ensuring that mass transfer from solution is rate determining. Whereby the electrodeposition of a bimetallic cluster involves reduction of metal ions and from solution:
[image:7.596.121.432.129.358.2]
The current associated with the growth of these clusters is [47]:
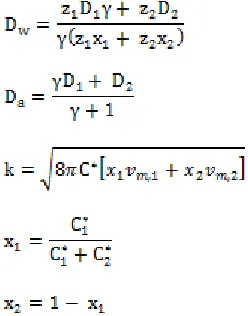
where and is the ratio between and and these last are the bulk concentrations of the two component species in solution and F is the Faraday´s constant. The parameters
are mass and charge transport coefficient and apparent diffusion coefficient, respectively, (which relate the diffusion coefficients of the electrodepositing ions in solution D1 and D2). The parameters in
equation (3) are given by equations (4)-(8).
Here, A (s-1) is the nucleation rate constant, N0 (cm-2) is the number density of active sites on
[image:8.596.48.172.263.421.2]the substrate and are molar volumes of the electrodeposited copper and zinc metals, respectively. For our case and represent the concentration of and complexes in the electrolytic solution and these are 0.1 and 0.2 mol dm-3, respectively. Thus , = 0.33 and = 0.67. The molar volume for copper is 7.09 9.16 cm3 mol-1 and for zinc is 9.16 cm3 mol-1.
0 2 4 6 8 10
2 3 4 5 6 7 8 9
j,
m
A
c
m
-2
t / s j
experimental j
3D-dc
Figure 6. Comparison of an experimental transient recorded at -1.20 V with a simulated transient obtained using equation (3).
3.4 Electrocatalytic activity evaluation for HER.
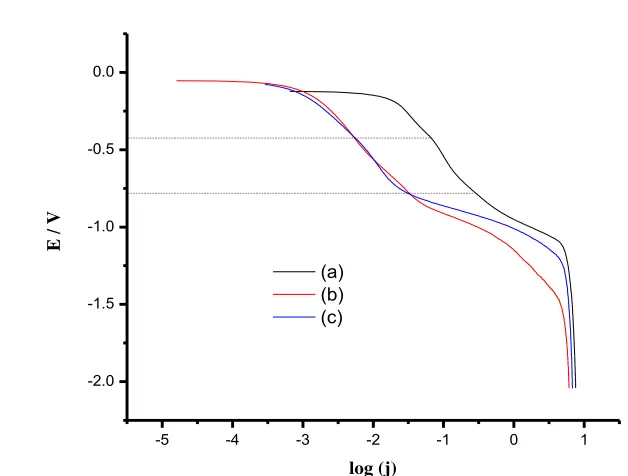
The evaluation of the electrocatalytic activity of coatings of Cu-Zn alloys obtained at -1.30 V and -1.55 V were tested for the hydrogen evolution reaction (HER) in 0.1 M NaOH aqueous solution. Figure 7 shows the cathodic polarization curves obtained for HER on (a) CuZn5 at -1.30 V, (b) CuZn5
at -1.55 V and (c) Cu electrodeposited at -0.70 V. It is clear to observe in Figure 8 that the lowest potential to start the HER occurs on CuZn5 at -1.30 V, showing a high activity for this reaction.
However, CuZn5 at -1.55 V showed a higher activity for HER in comparison with single copper
electrode.
[image:9.596.92.488.104.435.2]
-5 -4 -3 -2 -1 0 1
-2.0 -1.5 -1.0 -0.5 0.0
(a) (b) (c)
E
/
V
[image:10.596.119.433.85.323.2]log (j)
Figure 7. Cathodic polarization curves at scan rate of 2 mV s-1 from 0.1 M NaOH aqueous solution on CuZn5 intermetallic compounds and Cu metallic for HER. (a) CuZn5 obtained at -1.30 V, (b)
CuZn5 obtained at -1.55 V and (c) Cu obtained at -0.70 V
4. CONCLUSIONS
The CuZn5 intermetallic compound has been prepared and characterized by electrochemical
deposition an alkaline non-cyanide solution at room temperature, in presence of glycine. The formation of the CuZn5 intermetallic compound was associated with the underpotential deposition of zinc and its
intercalation into the lattice of copper. The chronoamperometric study allowed us to conclude that the nucleation step is consistent with the 3D-dc model for bimetallic alloy electrodeposition. The intermetallic compound obtained at -1.30 V showed the highest electrocatalytic activity and the lowest potential for HER.
ACKNOWLEDGEMENTS
Authors want to thank the financial support for this research to CONACYT through projects: FON.INST./75/2012 "Fotosíntesis Artificial", CNPq México-Brasil 2012-174247, CB-2011-168730, as well as PAICYT-UANL-2012.
References
4. X. Li, L. An, X. Chen, N. Zhang, D. Xia, W. Huang, W. Chu, Z. Wu, Scientific Reports, 3:3234 (2013) 1.
5. G. Wu, G. Cui, D. Li, P. Shen, N. Lia, J. Mater. Chem., 19 (2009) 6581-6589 6. P. W. T. Lu, S. Srinivasan, J. Electrochem. Soc., 125 (1978) 265.
7. F. Rosalbino, S. Delsante, G. Borzone, G. Scavino, Int. J. Hydrogen Energy, 38 (2013) 10170. 8. H. Strow, Metal Finish., 105 (2007) 163.
9. N. Thon, J. Pinilla, J. Chim. Phys. 28 (1931) 651.
10.V. A. Sukhodskii, V. L. Kheifetz, I. N. Chapurskii, Rept. Central Inst. Metals, (Leningrad), 177 (1934) 209.
11.A. I. Stobraovskii, ZA Fiz. Khim. 26 (1952) 949.
12.R. Sadagopachari, N. B. Srinivasan, T. L. Ramachar, Current Sci. (India) 20 (1951) 154. 13.S. K. Ray, H. V. Uduppa, B. B. Dey, J. Sci. Ind. Res. (India), 14B (1955) 652.
14.D. C. Gernes, G. H. Mentillon, Trans. Electrochem. Soc. 81 (1942) 231. 15.S. K. Ray, T. Banerjee, J. Sci. Ind. Res. (India), 12 B (1) (1953) 438. 16.T. L. Ramachar, Electroplating and Metal Finishing. 10 (1957) 391.
17.F.B.A. Ferreira, F.L.G. Silva, A.S. Luna, D.C.B. Lago, L.F. Senna, J. Appl. Electrochem. 37 (2007) 473.
18.I.A. Carlos, M.R.H. de Almeida, J. Electroanal. Chem. 562 (2004) 153. 19. Y. Fujiwara, H. Enomoto, Surf. & Coat. Technol., 35 (1998) 113. 20.Y. Sakamoto, F. Yamashita, K. Takao, Denki Kagaku, 44 (1976) 524. 21.Y. Sakamoto, M. Ohta, Denki Kagaku, 44 (1976) 472.
22.M.R.H. de Almeida, E.P. Barbano, M.F. de Carvalho, I.A. Carlos, J.L.P. Siqueira, L.L. Barbosa, Surf. Coat. Technol. 206 (2011) 95.
23. R. Juškėnas, V. Karpavičienė, V. Pakštas, A. Selskis, V. Kapočius, J. Electroanal. Chem., 602 (2007) 237.
24.V.V. Povetkin, M.S. Zakharov, R.R. Muslimov, Russ. J. Appl. Chem. 72 (1999) 1367. 25.A. R. Despic, V. Marinovic, V.D. Jovic, J. Electroanal. Chem. 339 (1992) 473. 26.R.M. Krishnan, V.S. Muralidharan, S.R. Natarajan, Bull. Electrochem. 12 (1996) 274.
27.A. Kitada, K. Yanase, T. Ichii, H. Sugimura, K. Murase, J. Electrochem. Soc., 160 (2013) D417. 28.P. De Vreese, A. Skoczylas, E. Matthijs, J. Fransaer, K. Binnemans, Electrochim. Acta, 108 (2013)
788.
29.C. Rousse, S. Beaufils, P. Fricoteaux, Electrochim. Acta, 107 (2013) 624.
30.J. C. Ballesteros, L. M. Torres-Martínez, I. Juárez-Ramírez, G. Trejo, Y. Meas, J. Electroanal. Chem., 727 (2014) 104.
31.S. D. Beattie, J. R. Dahn, J. Electrochem. Soc., 150 (2003) C802. 32.Z. Mácová, K. Bouzek, J. Appl. Electrochem., 35 (2005) 1203.
33.T. Öznülüer, B. Özdurak, H. Öztürk Dogan, J. Electroanal. Chem., 699 (2013) 1 34.J. G. Howalt, T. Vegge, Phys. Chem. Chem. Phys., 15 (2013) 20957.
35.R. Lan, J. T. S. Irvine, S. Tao, Scientific Reports 3 :1145 (2013) 1 36.C. Zamfirescu, I. Dincer, Fuel Process. Technol., 90 (2009) 729.
37.J.C. Ballesteros, E. Chaînet, P. Ozil, G. Trejo, Y. Meas, J. Electroanal. Chem., 645 (2010) 94. 38.S. Fletcher, C.S. Halliday, D. Gates, M. Westcott, T. Lwin, G. Nelson, J. Electroanal. Chem., 159
(1983) 267.
39.J.C. Ballesteros, E. Chaînet, P. Ozil, G. Trejo, Y. Meas, Electrochim. Acta, 56 (2011) 5443. 40.A. Milchev, Electrocrystalization: fundamentals of nucleation and growth, Kluwer, Dordrecht
(2002).
41.B. R. Scharifker, J. Monstany, J. Electroanal. Chem., 177 (1984) 13. 42.L. Heerman, A. Tarallo, J. Electroanal. Chem., 470 (1999) 70.
45.A. Milchev, R. Lacmann, Electrochim. Acta, 40 (1995) 1475.
46.Alexander Milchev, Emilia Michailova, Theodora Zapryanova, Electrochem. Commun., 6 (2004) 713.
47.O. Díaz-Morales, J. Monstany, C. Borrás, B. R. Scharifker, J. Solid. State Electrochem., 17 (2013) 345.