spike-timing dependent synaptic plasticity
A thesis submitted for the degree of Doctor of Philosophy
of The Australian National University
May 2004
by
Bjorn M. Kampa
Division of Neuroscience
John Curtin School of Medical Research Australian National University
STATEMENT
All the work described in this thesis is original. The experiments were performed by me between January 2001 and March 2004 under the supervision of Dr. Greg Stuart. The kinetic model described in Chapter 4 was developed together with Dr. John Clements. A number of presentations were made at scientific meetings. The following abstracts were published in conjunction with these presentations.
Kampa B M, Stuart G J (2001): NMDA Receptor Activation by Coincident Synaptic Stimulation and Backpropagating Action Potentials. In: Soc. Neurosci. Abstr. Program No. 502.7
Kampa B M, Stuart G J (2002): Bidirectional activation of NMDA receptors by coincident synaptic stimulation and backpropagating action potentials. In: Proceedings of the Australian Neuroscience Society, Vol. 13.
Kampa B M, Stuart G J (2002): Coincident synaptic stimulation and backpropagating action potentials activate NMDA receptors. In: Soc. Neurosci. Abstr. Program No. 345.1
Kampa B M, Stuart G J (2003): NMDA Activation and Synaptic Plasticity. In: Proceedings of the Australian Neuroscience Society, Vol. 14.
Kampa B M, Stuart G J (2003): Dendritic mechanisms involved in spike-timing dependent plasticity. In: Proceedings of the 29th Gottingen Neurobiology Conference, Abstract 43, p.162
Kampa B M, Stuart G J (2003): NMDA channel activation during spike-timing dependent synaptic plasticity. In: Soc. Neurosci. Abstract Program No. 257.5.
Kampa, B M, Stuart, G J (2004): Dendritic electrogenesis and action potential backpropagation in basal dendrites of cortical layer 5 pyramidal neurons: A calcium and voltage imaging study. In FENS Abstr., vol. (in press).
In addition, the following paper related to the work described in Chapter 4 of this thesis has been published:
Kampa B M, Clements J D, Jonas P, Stuart G J (2003): Kinetics of Mg2
+ unblock of NMDA receptors: Implications for spike-timing dependent synaptic plasticity. Journal of Physiology 556(2):337-45
1. Summary, pg 2: "this data" changed to "these data" 2. pg 10: "wether" changed to "whether"
3. pg 21, Methods: Paragraph added (on page 22) on correction for bleaching and autofluorescence in Ca2+ and voltage imaging experiments.
4. Fig. 3 .4: Figure changed to same data at larger time scale to show decay of fluorescence transients during control and after application of 4-AP.
5. pg 39: "effect" changed to "affect"
6. pg 46: Method of subtraction of background fluorescence has been explained in Chapter 2 (see above).
7. Fig. 5.1: Number of APs (3) and time interval ( + 10 ms) now indicated in figure legend.
ACKNOWLEDGEMENTS
First of all, I would like to thank my supervisor Greg Stuart for his guidance, encouragement and patience. It has been a great and interesting time and I am looking forward to our future plans.
I would also like to thank my PhD advisers John Bekkers, John Clements and Steve Redman for helpful discussions and especially JC for his help with the modelling. I would also like to thank Peter Jonas for hosting us in Freiburg and providing all the help and support during the one and a half years in his lab.
I would like to thank Wiebke for motivation and confidence and for following me to Australia.
The main aim of this study was to identify dendritic mechanisms
underlying spike-timing dependent synaptic plasticity. Three aspects of this form
of synaptic plasticity in large layer V pyramidal neurons were investigated.
Backpropagation of action potentials into basal dendrites
Spike-timing dependent synaptic plasticity, or STDP, is a form of synaptic
plasticity whereby the strength of connections between neurons in the brain is
modulated following pairing of postsynaptic spikes with presynaptic activity
within a narrow time window (± 50 ms). Backpropagation of the postsynaptic
spike, or action potential, to the site of synaptic input (usually in the dendrites) is
thought to provide a retrograde message to the activated synapse indicating that
the postsynaptic neuron has generated an output signal. This action potential
backpropagation is thought to be essential for induction of STDP. As STDP in the
cortex has been extensively studied between layer V pyramidal neurons, and
because these neurons make synaptic contacts primarily onto basal dendrites, it is
essential to understand action potential backpropagation into basal dendrites. As
these dendrites are too small to record from with standard electrophysiological
techniques, imaging technologies were used to investigate this issue.
The main result of this study was that action potential backpropagation
into basal dendrites was frequency-dependent, and significantly enhanced during
action potential bursts at frequencies of greater than 100 Hz. In addition, this
study provides evidence for generation of dendritic calcium spikes in the distal
basal dendrites. These findings have important implications for STDP as they
suggest that action potential backpropagation, and so presumably STDP, will be
Kinetics of magnesium unblock of NMDA receptors
Like many forms of synaptic plasticity, STDP is dependent on activation
of NMDA receptors. These receptors are blocked by external magnesium at
resting membrane potentials, and require depolarisation to open. During STDP
this depolarisation is thought to be supplied by backpropagating action potentials.
The extent of activation of NMDA receptor channels by backpropagating action
potentials will depend on the amplitude and time course of the dendritic
depolarisation generated at activated synapses during action potential
backpropagation (see above), and also on the kinetics of magnesium unblock. The
latter issue was investigated in membrane patches during fast application of
glutamate to mimic transmitter release. In contrast to the dogma that magnesium
unblock is effectively instantaneous, it had a slow component whose amplitude
and kinetics depend on the timing of depolarisations after glutamate application . .\-~e.sc..
Fitting a kinetic model to ..t,h.i.g. data indicated that magnesium binding to the NMDA receptors increases desensitisation, and reduces both the open channel
probability and affinity for glutamate. These findings have important implications
for STDP. Indeed, STDP timing curves of NMDA receptor activation elicited by
realistic dendritic voltage waveforms were narrower than expected assuming
instantaneous Mg2+ unblock, indicating that slow magnesium unblock of NMDA
receptor channels makes the STDP timing window more precise.
Synaptic activation of NMDA receptors
Ideally, one would like to record directly from the site of synaptic input (a
dendritic spine) and measure NMDA receptor activation during STDP induction
protocols. Unfortunately, this is impossible at present. This study describes a
novel method to address this question, using the activity-dependent NMDA open
channel blocker MK80I. As MK801 binds with very high affinity it is effectively
irreversible on the time scale of the experiments described here. Hence, the degree
of MK801 block can be used as a measure of NMDA receptor activation. Using
this method NMDA receptor activation was found to be greatest during pairing of
TABLE OF CONTENTS
CHAPTERl:GENERALINTRODUCTION
1
CHAPTER 2: GENERAL METHODS
14
BRAIN SLICE PREPARATION
14
ELECTROPHYSIOLOGY
14
RECORDING FROM NUCLEATED PATCHES
16
CALCIUM IMAGING
17
VOLTAGE IMAGING
17
DATA ACQUISITION AND ANALYSIS
18
CHAPTER 3: BACKPROPAGATION OF ACTION POTENTIALS INTO
BASAL DENDRITES 19
INTRODUCTION
METHODS RESULTS DISCUSSION
19 21
23
27
CHAPTER 4: KINETICS OF MAGNESIUM UNBLOCK OF NMDA RECEPTOR CHANNELS
INTRODUCTION METHODS RESULTS DISCUSSION
31
31
32
34
38
CHAPTER 5: ASSESSING ACTIVATION OF SYNAPTIC NMDA RECEPTORS DURING STOP
INTRODUCTION METHODS
42
42
CHAPTER 6: GENERAL DISCUSSION
REFERENCES
57
CHAPTER 1:
GENERAL INTRODUCTION
You have to begin to lose your memory, if only in bits and pieces, to realise that memory is what makes our lives. Life without memory is no life at all.
Luis Bufiuel
Historical perspective
1
Learning involves the process of remembering previous experience. Our
current ideas suggest that memories are stored in the neural circuits of the brain,
and that memories are formed via changes in the strength of connections within
these neural circuits. This idea was first brought forward by the postulate of
Donald 0. Hebb mid-last century (Hebb, 1949), which stated:
When an axon of cell A is near enough to excite a cell B and repeatedly or persistently takes part in firing it, some growth process or metabolic change takes place in one or both cells such that A's efficiency, as one of the cells firing B, is increased.
This postulate proposes a mechanism whereby the synaptic connections
between two cells are strengthened if their activity is correlated. Specifically, it
states that if the input from a presynaptic neuron "takes part" in causing its
postsynaptic target neuron to fire action potentials, then the input from that
presynaptic neuron should become stronger. He suggested that this should take
place by some growth process or metabolic change. Notably, this idea was
published at a time before the cellular mechanisms underlying synaptic
transmission were understood, and well before the details of DNA and protein
synthesis were known. Long-term changes in synaptic strength were first
discovered in 1966 (L¢mo, 1966), and it took another seven years until a
(Bliss & Lomo, 1973). Since then LTP has became one of the most intensely studied subjects in Neuroscience.
Synaptic Plasticity: LTP and LTD
Originally described in granule cells of the dentate gyrus in anaesthetized and awake rabbits (Bliss & Gardner-Medwin, 1973; Bliss & Lomo, 1973), LTP was also induced in the CAI region in slice preparations of the rat hippocampus (Schwartzkroin & Wester, 1975) which is known to play a key role in processes of learning and memory formation (Milner et al., 1998). Since then, LTP has been observed in several other regions of the brain including the neocortex (Bear & Kirkwood, 1993; Malenka & Nicoll, 1999; Teyler & DiScenna, 1987).
Several induction protocols have been used to induce LTP. The most common ones are high-frequency stimulation (HFS) with long trains of stimuli and "theta-burst stimulation" (TBS) where several high-frequency bursts are repeated. These stimuli are of specific interest since synchronous firing patterns at similar frequencies also occur in the hippocampus during learning (Otto et al.,
CHAPTER 1 3
can induce LTP (Kelso et al., 1986; Malinow & Miller, 1986; Sastry et al., 1986; Wigstrom et al., 1986). In addition, the induction of LTP by a strong stimulus can be blocked by preventing the accompanying depolarisation, either by voltage-clamping the cell (Kelso et al., 1986) or by hyperpolarising the membrane potential (Malinow & Miller, 1986). These findings indicate that associative LTP is induced by simultaneous pre- and postsynaptic activity, which finally realises the original idea of Hebb and therefore is also referred to as Hebbian plasticity.
While activated synapses can be potentiated during strong, high-frequency stimulation, other synapses, inactive during the conditioning stimulus, can be depressed (Dunwiddie & Lynch, 1978; Lynch et al., 1977). This heterosynaptic long-term depression, however, has proved difficult to study and several labs have failed to observe the phenomenon (Andersen et al., 1977; Schwartzkroin & Wester, 1975). The induction of input-specific (homosynaptic) long-term depression was already incorporated in theoretical studies (Bienenstock et al.,
1982; Sejnowski, 1977; Willshaw & Dayan, 1990) when it was successfully demonstrated for inputs from Schaff er collaterals onto CA 1 pyramidal neurons (Dudek & Bear, 1992; Mulkey & Malenka, 1992) and in visual cortex (Kirkwood
whereas a strong depolarisation above a critical threshold 8 induces synaptic potentiation (N gezahayo et al., 2000). The value for 8 depends on the history of the synapse. A previous depression facilitates the induction of LTP by moving the threshold for LTP induction to less depolarised values. The opposite effect occurs at previously potentiated synapses. This phenomenon, named metaplasticity, is thought to increase the dynamic range for memory storage in the weights of synaptic connections (Abraham & Bear, 1996).
Spike-timing dependent plasticity
The concept of input frequency-dependent changes in synaptic strength involves the idea that information is coded in the rate of that input. A more recent alternative to this rate code is a temporal code where the exact timing of individual action potentials (APs) carries information (e.g. deCharms & Zador, 2000; Rieke et al., 1997). Synaptic plasticity induced by single postsynaptic APs precisely timed with the excitatory synaptic input has been examined by recent studies using paired intracellular recordings to control the timing of AP firing in the pre- and postsynaptic cell (Bi & Poo, 1998; Markram et al., 1997b). If an AP in the presynaptic neuron produced an excitatory postsynaptic potential (EPSP) slightly before the firing of an AP in the postsynaptic neuron, this synaptic connection was potentiated. A reversion of this temporal order induced a depression of the synaptic connection. In other words, repetitive stimulation of a presynaptic neuron preceding stimulation of the postsynaptic neuron induces LTP, whereas the same repetitive stimulation of the presynaptic AP following the postsynaptic AP induces long-term depression, or LTD. This bi-directional spike-timing dependent plasticity (STDP) has since been described at various excitatory synapses in the cortex (Bi & Poo, 1998; Feldman, 2000; Froemke & Dan, 2002; Markram et al., 1997b; Nishiyama et al., 2000; Sjostrom et al., 2001). Interestingly, a different form of STDP occurs at synapses between spiny stellate cells, which show LTD after positive and negative timing of EPSPs and APs (Egger et al., 1999).
CHAPTER 1 5
between pre- and postsynaptic APs, with the amount of potentiation and depression decreasing with longer time intervals. The time constant for decay of the LTP timing window is approximately 16.8 ms, whereas the time constant for decay of the LTD timing window is approximately 33.7 ms (Bi & Poo, 2001). A recent study has revealed that the extent of synaptic changes depends not only on the exact timing of a pre- and postsynaptic spike, but also on the rate of pairing and on the EPSP amplitude (Sjostrom et al., 2001). Pairing small EPSPs ( <2 mV) at low frequencies ( <10 Hz) with postsynaptic APs at times that should lead to LTP ( + 10 ms) did not lead to synaptic plasticity. However, when combined with a postsynaptic depolarisation during the induction period, this same pairing protocol lead to LTP. Furthermore, if the frequency of pairing was raised above 40 Hz, LTP was induced during pairing at both positive (+10 ms) and negative (-10 ms) timing intervals. Asynchronous spike trains were applied to pre- and postsynaptic neurons generating different spike-timing intervals within one induction period. In layer V pyramidal neurons of the rat visual cortex the data was fit best with a model that predicts that when an AP follows an EPSP which would lead to induction of LTP and at the same time precedes the next EPSP which would lead to induction of LTD, the induction of LTP "wins" over the induction of LTD (Sjostrom et al., 2001). A similar study in layer 11/111 pyramidal neurons suggested that induction of STDP follows a "first pairing-dominating" rule, whereby the pairing interval that occurs first determines the sign of the synaptic change (Froemke & Dan, 2002). It seems likely therefore that different types of pyramidal neurons follow different STDP timing rules.
Backpropagating action potentials
entire apical dendrite in vitro (Bischofberger & Jonas, 1997) and in the anaesthetized animal in vivo (Debarbieux et al., 2003). On the other hand, the principal neurons in the cerebellum, the Purkinje cells, show very poor backpropagation (Stuart & Hausser, 1994). Asking the question, what causes the difference in backpropagation in different neuronal types, one might first notice that the dendritic morphologies of these neurons are very diverse. Mitral cells express a large apical and basal dendrite with only few branch points. On the other hand, Purkinje cells show a strongly branched dendritic tree (reviewed in Mel, 1994). In fact, a recent modelling study has demonstrated that somatic APs invade the dendritic tree to various degrees depending on their dendritic morphology (Vetter et al., 2001). The more dendritic branch points, the less effective is AP backpropagation. In addition, the composition of voltage-gated ion channels in the dendrites plays an important role (Magee, 1999). In cortical pyramidal neurons TTX-sensitive Na+ channels support active backpropagation of APs (Stuart & Sakmann, 1994) and are expressed at a relatively uniform density in the soma and main apical dendrite (Magee & Johnston, 1995; Stuart &
Sakmann, 1994).
The second major determinant of AP backpropagation are voltage-gated potassium channels, which tend to dampen or pace electrogenic activity (Hille, 1992). A-type potassium channels, for example, mediate large outward currents that both activate and inactivate very rapidly and may act like shock absorbers to limit large, rapid dendritic depolarisations. In CAI neurons, these dendritic conductances increase with distance from soma and cause a reduction of backpropagating AP amplitude in distal apical dendrites (Hoffman et al., 1997). In oblique dendrites of the same neurons, an elevated A-type K+ conductance normalises AP triggered Ca2+ influx (Frick et al., 2003). In contrast, these A-type potassium channels are found at a low density in the apical dendrites of layer V pyramidal neurons of somatosensory cortex (Bekkers, 2000) or even decrease with distance from the soma (Korngreen & Sakmann, 2000).
CHAPTER 1 7
Stuart, 2000b ). Because these channels are open at the resting membrane potential they produce a large leak conductance that affects temporal summation of synaptic inputs and overall neuronal excitability. Blocking Ih channels lowers the threshold for backpropagating bursts of APs to induce dendritic spikes (Berger et al., 2003 ). Ih channels are also the target for the anticonvulsant lamotrigine
(Poolos et al., 2002), which is used to treat epilepsy as well as psychiatric illness such as bipolar disorder. Application of lamotrigine causes Ih upregulation that reduces the excitability of CAI pyramidal neuron dendrites, making synaptic inputs less effective at triggering AP firing (Poolos et al., 2002). All told, modulation of Ih channels affects overall neuronal excitability (Berger et al., 2001; Magee, 1998; Williams & Stuart, 2000b) and regulates coupling of proximal and distal dendrites and initiation of dendritic electrogenesis (Berger et al., 2003).
Dendritic morphology and ion channel distribution both affect propagation of somatic APs into the dendrites. In addition, the history of previous backpropagating APs can also play a role. Trains of APs evoked by somatic current injection or axonal stimulation show strong attenuation for APs later in the train when recorded in the dendrite (Spruston et al., 1995b). The amount of attenuation depends on AP frequency and is thought to be due to cumulative Na+ channel inactivation (Colbert et al., 1997; Jung et al., 1997). At a critical frequency ("' 100 Hz), however, backpropagating APs depolarise the distal apical dendrite sufficiently to generate a Ca2+ spike (Larkum et al., 1999a; Williams & Stuart, 2000a). By this mechanism, high frequency trains or bursts of APs are able to invade even the distal parts of the dendritic tree (Larkum et al., 1999a; Williams & Stuart, 1999, 2000a). The additional depolarisation necessary for backpropagating AP amplitudes to reach the threshold for dendritic spike initiation can also be supplied by synaptic inputs (Magee & Johnston, 1997), but only if the relative EPSP-AP timing is appropriate (Stuart & Hausser, 2001). Interestingly, this form of dendri tic coincidence detection has a time window similar to the STDP window for LTP.
Dendritic spikes
In addition to the somatic AP, active dendritic properties allow the initiation of dendritic Na+ and Ca2
1997 a). Coincident distal synaptic input can generate a dendritic spike that propagates to the soma and evokes an axonal AP (Williams & Stuart, 2002). Similarly, neighbouring synapses can initiate local NMDA spikes if they have been activated simultaneously (Schiller et al., 2000). Thereby, dendritic spikes operate as coincidence detectors capable of detecting temporal sequences generated and propagated by functional neural assemblies (Abeles, 1991). Dendritic electrogenesis evoked by pairing backpropagating APs with coincident synaptic input can also couple the dendritic and somatic spike initiation zones (Larkum et al., 1999b), a mechanism that might be important in binding bottom-up and top-down information processing in the cortex. Finally, multiple sites for dendritic spike induction can increase the number of computational compartments and so significantly enhance the computational power of single neurons (Mel, 1993).
Together these studies suggest that the extent of AP backpropagation, as well as dendritic spike initiation, is likely to influence the way neurons process and store information, and so is likely to be important for the induction and expression of synaptic plasticity.
NMDA receptor
Glutamate is the main excitatory synaptic transmitter in the vertebrate central nervous system. Most glutamatergic synapses express two types of ionotropic postsynaptic receptors, AMPA and NMDA receptors. AMPA receptors, when activated, cause a large and very fast postsynaptic current, whereas NMDA receptor (NMDAR) activation gives rise to a slower current lasting several hundred milliseconds (Bekkers & Stevens, 1989; Forsythe & Westbrook, 1988). At resting membrane potentials current flow through NMDAR channels is largely blocked by external Mg2+ ions that bind to the inside of the channel pore (Mayer et al., 1984; Nowak et al., 1984). This Mg2
CHAPTER 1 9
1993). During STDP the postsynaptic depolarisation is thought to be supplied by the backpropagating AP (Magee & Johnston, 1997). This assumes that the depolarisation delivered to the postsynaptic site by backpropagating APs is sufficient to release the Mg2+ block of the NMDA receptor. APs are brief events
with a duration of less than a millisecond at the soma measured half way between their base and peak. While they travel along the dendrite they are attenuated and can fail to invade the distal part of the dendritic arbour (Golding et al., 2001;
Larkum et al., 1999a; Stuart & Hausser, 2001). In addition, although Mg2
+ block
and unblock occurs very rapidly in single channel recordings under steady-state conditions (Jahr & Stevens, 1990a), there has been evidence that Mg2
+ unblock
elicited by depolarising voltage steps has a slow component (Spruston et al.,
1995a; Vargas-Caballero & Robinson, 2003), with a recent study showing that slow Mg2+ unblock affects NMDAR activation by AP waveforms during long
application of NMDAR agonists (Vargas-Caballero & Robinson, 2003 ). Hence, the ki11:etics of Mg2+ unblock of NMDAR channels might also play an important
role in determining the extent of NMDAR activation by backpropagating APs.
Mechanisms generating STDP
Induction of associative LTP involves the association of postsynaptic depolarisation with presynaptic input. The source of depolarisation can be local summation of EPSPs during a high-frequency burst of presynaptic activity or direct current injection into the postsynaptic cell. It is generally assumed that this depolarisation enhances activation of postsynaptic NMDARs by removing the Mg2+ block inside the channel pore allowing Ca2+ to flow into the postsynaptic cell
(Bliss & Collingridge, 1993). Induction of homosynaptic LTD is also NMDA dependent (Linden & Connor, 1995), though an NMDA-independent form of LTD that depends solely on metabotropic glutamate receptors has been reported as well (Oliet et al., 1997). Both LFS and pairing presynaptic stimulation with moderate depolarisation can lead to LTD and are thought to open few NMDAR channels giving rise to moderate Ca2+ influx (Cummings et al., 1996; Dudek &
Bear, 1992; Mulkey & Malenka, 1992; Ngezahayo et al., 2000). Hence,
NMDARs not only detect coincidence of pre- and postsynaptic activation, but can translate the level of postsynaptic activity into a rise in internal Ca2
w~e~e""
amplitude may relate to v.z8thef LTP or LTD is induced. Consistent with this idea, moderate increases in internal Ca2+ have been found to be associated with LTD
induction while induction of LTP is associated with high levels of intracellular Ca2
+ (Artola & Singer, 1993; Cormier et al., 2001). Both LTP and LTD are
blocked by high concentrations of intracellular Ca2+ chelators (Lynch et al., 1983;
Malenka et al., 1988; Mulkey & Malenka, 1992). Low concentrations of Ca2+
chelators can turn LTP induction protocols into LTD induction by lowering the internal Ca2
+ concentration during induction (Cho et al., 2001). Also, reducing
Ca2
+ influx through NMDARs with low concentrations of NMDAR antagonists
during LTP-inducing protocols causes induction of LTD (Cummings et al., 1996; Nishiyama et al., 2000). Finally, artificially raising the internal Ca2
+ concentration
by photolytic uncaging of Ca2
+ ions can induce LTD if small amounts of Ca2+ are
released over longer periods and LTP if the release of uncaged Ca2+ is large and
brief (Yang et al., 1999). Together, these findings indicate that the sign and amount of plasticity as described in the BCM model (see above) depend on the concentration of intracellular Ca2
+. Different levels of internal Ca2+ may activate
different signal cascades as induction of LTP and LTD have been shown to depend on the activation of Ca2+ -dependent kinases (CaMKII) (Mali now et al.,
1989; Silva et al., 1992) and phosphatases (Calcineurin) (Mulkey et al., 1994; Mulkey et al., 1993) respectively.
STDP consists of LTP and LTD components. Does it also sh.are the same mechanisms with the classical models of synaptic plasticity? STDP depends on sufficient postsynaptic depolarisation provided by successfully backpropagating APs (Magee & Johnston, 1997) which could supply the depolarisation necessary for relief of the Mg2+ block inside the NMDAR channel pore. Activation of
NMDARs is a requirement for STDP induction since STDP is blocked by NMDA antagonists (Bi & Poo, 1998; Feldman, 2000; Markram et al., 1997b; Nishiyama
et al., 2000; Sjostrom et al., 2001). Can the temporal order of synaptic activation and postsynaptic APs simply be transferred into intracellular Ca2
+ concentration,
which then determines the sign of plasticity induced by that temporal relationship? Pairing of EPSPs with APs at positive timings, i.e. when the APs follow EPSP onset, leads to supralinear Ca2
+ transients in dendritic spines that are
CHAPTER 1 11
APs alone (Koester & Sakmann, 1998; Nevian & Sakmann, 2004; Schiller et al.,
1998; Yuste et al., 1999). Pairing at negative times results in a sublinear increase
in internal Ca2
+ (Koester & Sakmann, 1998; Nevian & Sakmann, 2004). While the
supralinear Ca2
+ influx is NMDA dependent (Koester & Sakmann, 1998; Nevian
& Sakmann, 2004; Yuste et al., 1999), the source of Ca2+ is complex and can be
through the NMDAR itself as well as voltage-gated calcium channels (Schiller et
al., 1998) or via Ca2+ release from internal stores (Emptage et al., 1999) and Ca2+
permeable AMPA receptors (Yuste et al., 1999). Since NMDAR channels not
only mediate Ca2+ influx but also cause a postsynaptic depolarisation that in tum
can activate voltage-gated calcium channels, imaging synaptically induced Ca2+
influx is an indirect measure of NMDA receptor activation. Simplistically, if the total Ca2
+ concentration at the postsynaptic site can
account for the sign of the induced synaptic plasticity, pairing EPSPs with APs at positive timings would be expected to cause large Ca2+ influx and hence LTP,
whereas pairing at negative timings should give rise to modest Ca2
+ transients and
hence LTD as it has been demonstrated. However, there are problems with this simple "Ca2+ hypothesis", as pairing at long positive intervals should induce LTD
since Ca2+ influx will diminish due to reduced occupation of NMDARs with
glutamate. While such a second LTD window has recently been reported (Nishiyama et al., 2000), other STDP studies failed to observe this (Bi & Poo, 1998; Feldman, 2000; Froemke & Dan, 2002; Markram et al., 1997b; Sjostrom et al., 2001). An alternative model that can explain all the data could be a model that
involves two separate coincidence detectors for each direction of synaptic plasticity (Karmarkar & Buonomano, 2002). Consistent with this idea, a form of spike-timing dependent LTD has been shown to depend not on NMDARs but on metabotropic glutamate receptors (Normann et al., 2000). Therefore, LTP and LTD could use different induction mechanisms. In layer V of visual cortex, LTD has been shown to depend on presynaptic NMDA receptor activation and postsynaptic endocannabinoid release, whereas LTP is caused by activation of postsynaptic NMDARs (Sjostrom et al., 2003).
A further problem of the "Ca2+ hypothesis" is that increases in internal
Ca2+ can also be obtained with postsynaptic depolarisations alone, following
sufficient for inducing long-term plasticity, this is not observed (Kullmann et al., 1992; Markram et al., 1997b; Wang et al., 1997). Possibly, it is not simply the concentration of internal Ca2+ reached, but rather the waveform of the Ca2+ transient that determines the sign of the induced plasticity. Brief elevations of intracellular Ca2+ by uncaging Ca2+ bound precursors were able to induce LTP, whereas LTD was induced by long lasting small increases in internal Ca2+ (Yang et al., 1999). The amplitude of the artificially increased intracellular Ca2+ reached similar levels as NMDAR mediated Ca2
+ influx during synaptic activation at depolarised postsynaptic potentials, whereas single APs gave rise to Ca2+ transients which are an order of magnitude lower and decay rapidly (Sabatini et al., 2002). Postsynaptic depolarisation alone, therefore, might not reach the same
temporal profile and amplitude as NMDAR mediated Ca2+ influx. The spatial profile of Ca2+ elevation presumably plays an important role as well. Excitatory synapses in the mammalian brain are mainly situated on spines (Harris, 1999), small dendritic extrusions that function as a biochemical compartment isolating Ca2+ influx through synaptic NMDAR channels from the apparent dendrite (Sabatini et al., 2002; but see Holthoff et al., 2002 ). The Ca2
+ binding molecules that trigger the different signal cascades for induction of plasticity are situated in close vicinity to the intracellular mouth of the NMDAR channel (Sheng & Lee, 2000) forming a microdomain for Ca2
+ dependent reactions (Hardingham et al., 2001; Takasu et al., 2002). Consistent with this idea, in knock-out mice lacking the postsynaptic protein PSD-95 induction of LTD with LFS is prevented and LTP induced instead (Migaud et al., 1998). While the NMDAR current was not altered compared to wildtype mice, these authors suggest that the Ca2
+ binding protein that regulates LTD induction may not be linked properly to the NMDAR complex in the PSD-95 knock-out animals. Finally, simulations of Ca2
+ diffusion in spines show restriction of free Ca2+ to microdomains around the channels due to internal Ca2+ buffers (Franks & Sejnowski, 2002).
CHAPTER 1 13
different sites for LTP and LTD induction during STDP. Evidence for this comes
from a recent study where LTD is induced presynaptically (Sjostrom et al., 2003).
A temporal separation of the different Ca2+ sources could also determine the sign
of the induced plasticity if previous Ca2+ influx influences other Ca2+ sources
(Senn et al., 2001). Finally, several studies proposed different induction
mechanisms for LTP and LTD. While induction of LTP depends on activation of
postsynaptic NMDARs, LTD induction depends on activation of presynaptic
NMDA and endocannabinoid receptors (Sjostrom et al., 2003) or postsynaptic
metabotropic receptors and N-type voltage-gated calcium channels (Normann et
al., 2000).
Thesis outline
The present study investigates three aspects of STDP in large layer V
pyramidal neurons. First, as the basal dendrites are the main target of synaptic
inputs from neighbouring layer V cells, which have been extensively studied
during STDP, the extent of AP backpropagation in basal dendrites was examined
with calcium- and voltage-sensitive dyes and is shown in Chapter 3. Second, as
described in Chapter 4, the kinetics of Mg2+ unblock and its implications for
STDP were studied using direct recordings of NMDAR currents in patches during
fast application of glutamate. And third, the activation of synaptic NMDA
receptors by backpropagating APs during STDP induction protocols was assessed
in Chapter 5. Finally, the results are set in the context of STDP and discussed in
CHAPTER 2:
GENERAL METHODS
This chapter contains a detailed description of the general methods that are
used in Chapters 3, 4 and 5. Each of the results chapters includes its own methods
section dealing with the specific details of the particular experiments described in
that chapter.
Brain slice preparation
Experiments were performed on male or female wistar rats generally 3-4
weeks old. Animals were anaesthetized by inhalation of Halothane or Isoflurane
and decapitated according to guidelines approved by the Animal Experimentation
Ethics Committee of the Australian National University and the University of
Freiburg. The skull was opened while submerged in ice-cold solution containing
125 mM NaCl, 3 mM KCl, 1.25 mM NaH2P04 , 25 mM NaHC03 , 25 mM glucose,
2 mM CaC12 , 6 mM MgC12 (pH 7.4 with 5% CO2). The magnesium concentration
was increased to block NMDAR mediated Ca2+ influx and cell death (Rothman &
Olney, 1987). After the brain was removed the right hemisphere was glued on the
mid-line onto a stainless steel block in a holding chamber that was filled
immediately with ice-cold solution. The block was angled at 20° with the ventral
side of the brain facing upwards. The holding chamber was placed in a tissue
slicer (Dosaka, Japan) to cut 300 µm thick slices of the somatosensory cortex. The
angle of the brain versus the blade of the slicer is important for the quality of the
slices. Neurons with their apical dendrite parallel to the surface of the slice are
more likely to survive the slicing process. In addition, their dendrites can be
visualised under the microscope. After each slice was cut it was transferred to a
holding chamber containing oxygenated solution at 35 °C for 30 minutes and
stored at room temperature thereafter.
Electrophysiology
Individual brain slices were transferred into the recording chamber and
perfused with artificial cerebrospinal fluid (ACSF) containing 125 mM NaCl, 3
mM KCl, 1.25 mM NaH2P04 , 25 mM NaHC03 , 25 mM glucose, 2 mM CaCl2 , 1
CHAPTER 2 15
gravitation or a peristaltic pump (WPI, USA). The microscope was mounted on a vibration-isolated table (Physical Instruments, Germany) together with the slice chamber and recording electrode manipulators. Neurons were visualised using infrared differential interference contrast (IR-DIC) optics with a Zeiss Axioskop or Olympus BX51 upright microscope and a CCD camera (Hamamatsu or PCO) connected to a TV screen. DIC increases image contrast, while the use of infrared light reduces scatter caused by the tissue. Recordings were made from large layer V pyramidal neurons located in somatosensory cortex. These neurons can be identified by the large size of their soma and apical dendrite, as well as the laminar location of their cell bodies. Current-clamp whole-cell recordings were made from the soma or apical dendrite of these neurons using current-clamp amplifiers (Axon Instruments or Dagan Corporation, USA) using previously described methods (Stuart et al., 1993). Patch-pipettes were pulled from filamented borosilicate glass with a computer-controlled electrode puller (Sutter Instruments, USA) to a tip diameter of"' 1 µm and open tip resistance of 5-10 MQ for somatic and 10-15 MQ for dendritic recordings. Electrodes were filled with intracellular solution containing 135 mM K-gluconate, 7 mM NaCl, 10 mM HEPES, 2 mM MgC12 , 2 mM Na2ATP (pH 7.2 with KOH) and electrically
compensation. This corrects for the voltage drop across the series resistance of the electrode during current injection, and compensate for filtering by the electrode capacitance. Serial resistances were usually between 10 and 20 MQ for somatic and 15-30 MQ for dendritic recordings. APs were elicited antidromically or by brief somatic current injection (2 ms; 2 to 4 nA). During antidromic stimulation, just-subthreshold responses were examined at high gain to ensure that they were not contaminated by excitatory or inhibitory responses. Unless otherwise stated, EPSPs were evoked by extracellular stimulation using patch pipettes filled with external solution placed approximately 100 µm lateral to the soma of the recorded neuron in layer V.
Recording from nucleated patches
Nucleated patch experiments were performed at room temperature (23 °C) using pipettes filled with 137 mM CsCl, 4 mM MgCl2 , 10 mM HEPES, 10 mM EGTA, 4 mM Na2ATP, 10 mM Na2-phophosphocreatine (pH 7.2 with CsOH) or
in some cases with 80 mM CsCl, 80 mM CsFI, 4 mM Na2ATP, 2 mM MgC12 (pH
CHAPTER 2 17
kHz sample rate on an Apple Macintosh Computer. For display purposes current traces in the figures were digitally filtered at 1 kHz.
Calcium Imaging
Changes in intracellular calcium concentration were imaged usmg a confocal microscope (LSM 510; Zeiss, Germany or FV300, Olympus, Japan) or a CCD camera (NeuroCCD-SM; Red Shirt Imaging, USA). When imaged with the CCD camera a microscope halogen lamp was used as the excitation light source (Olympus, Japan). Neurons were loaded via the recording pipette with the calcium-sensitive fluorescent dye Oregon Green BAPT A-6F (200 µM; Kct = 3
µM, Molecular Probes) or Oregon Green BAPTA-1 (200 µM; Kct = 170 nM, Molecular Probes) added to the pipette recording solution and cells were filled for at least 30 minutes prior to recording. Extracellular stimulation pipettes were filled with external solution plus Sulforhodamine 101 (Molecular Probes) and placed within 10 µm of the imaged dendrite. Changes in fluorescence were measured with line scans at 0.3 to 1 kHz (confocal microscope) or with small region of interest (ROI) taken at 1 kHz frame rate across dendritic shafts with spines (CCD camera), and saved in ASCII format. Imaging data was analysed with IGOR (Wavemetrics, USA) and expressed as the percentage change in fluorescence relative to baseline (~F/F) after background subtraction.
Voltage Imaging
formed and the electrode removed. Stained neurons were incubated for 1-3 h at 35 °C and repatched with a dye-free pipette. Time of light exposure was restricted and interleaved by waiting periods of 20-90 s to reduce photodamage of the dye. Fluorescence signals (excitation 520 nm ±45 nm, dichroic 570 nm and emission> 610 nm) were sampled at 5 kHz frame rate using the Neuroplex software controlling the CCD camera. ROis were selected offline and data saved in ASCII format to be analysed with IGOR (Wavemetrics, USA).
Data acquisition and analysis
19
CHAPTER 3:
BACKPROPAGATION OF ACTION POTENTIALS
INTO BASAL DENDRITES
Introduction
In the central nervous system, information is represented and transferred by fast voltage impulses called action potentials. These are initiated in the axon and propagate back into the dendritic tree of many neuronal types (Stuart et al.,
1997b ). In cortical pyramidal neurons, voltage-gated channels in the apical dendrite enable somatic APs to actively propagate in a decremental manner into the apical dendritic arbour (Stuart & Sakmann, 1994). Most studies have focused on AP backpropagation into the larger diameter apical dendrite of pyramidal neurons, as these dendrites are readily accessible to patch-clamp recordings. The majority of synaptic inputs to pyramidal neurons, however, occur on the much finer basal and oblique dendrites originating from the soma and proximal part of the apical trunk (Larkman, 1991). Knowledge of signal integration and AP propagation in these small dendrites is incomplete, although two recent studies have started to address this issue using optical methods.
One of these two studies used calcium imaging to study AP backpropagation into oblique dendrites of hippocampal CAl pyramidal neurons (Frick et al., 2003). This study found that the backpropagating AP-induced Ca2
+
signal was similar at different distances from the soma in oblique dendrites due to activation of dendritic A-type potassium channels. After blocking these potassium channels, Ca2
+ signals increased with distance due to an increase in the surface to
volume ratio allowing greater calcium accumulation in the finer distal parts of oblique dendritic branches. A similar A-type potassium channel-dependent regulation of backpropagating AP amplitude is observed in the apical dendrites of the same neurons (Hoffman et al., 1997).
with this interpretation, however, is that although it is possible to image changes in fluorescence associated with membrane depolarisation in basal and oblique dendrites, it is difficult to quantify these changes in terms of absolute membrane potential.
This chapter describes Ca2+ and voltage imaging studies of action potential
backpropagation into basal dendrites of cortical pyramidal neurons. The aim was to determine the extent and frequency-dependence of AP backpropagation into basal dendrites of layer V pyramidal neurons. These dendrites receive the majority of synaptic input from neighbouring layer V pyramidal neurons (Markram et al., 1997a), hence it is particularly relevant to understand AP
CHAPTER 3 21
Methods
Evoking backpropagating action potentials
Whole-cell patch-clamp recordings were made from the soma of layer V
pyramidal neurons in brain slices of rat somatosensory cortex as described in
Chapter 2. APs were evoked by brief (2 ms) somatic current injections (2 to 4 nA)
in trains at 200 Hz with increasing numbers of APs (1 to 5), or in trains of 5 APs with increasing frequency (66, 80, 100, 133 and 200 Hz). In voltage imaging
experiments, an incubation period was necessary after filling the neuron with the
voltage-sensitive dye (VSD) to allow the AP waveform to recover from the toxic
effects of the high concentration of VSD (see Figure 3.5). In 4-aminopyridine
(4-AP; Sigma) experiments a strong hyperpolarising current pulse was injected after
the AP stimulus to prevent initiation of a second AP on the pronounced
after-depolarisation. All experiments were done at 35 °C. It was not possible to evoke AP bursts at 200 Hz at room temperature.
Imaging with OGB-1 and OGB-6F
Intracellular Ca2+ transients were measured with the low affinity Ca2
+-sensitive dye Oregon Green BAPTA-6F (OGB-6F; Kct = 3 µM) or the high
affinity dye Oregon Green BAPTA-1 (OGB-1; Kct = 170 nM). These dyes were
added to the standard K-Gluconate-based pipette solution at a concentration of
200 µM (see Chapter 2). The low affinity dye was used to prevent dye saturation
during AP trains, whereas the high affinity dye was preferred to detect small Ca2 +
signals caused by single backpropagating APs in distal basal dendrites. In some
initial experiments, spines were imaged together with their adjacent dendrite. No
differences were observed between Ca2+ signals and data were poolefr Ca2+
transients were filtered at 100 Hz and expressed as ~F/F.
Imaging with voltage-sensitive dyes
Neurons were filled with the voltage-sensitive dyes JPWl 114 (Molecular
Probes, USA) or JPW3028 (synthesized by J. P. Wuskell and L. M. Loew,
2003) and in Chapter 2. Precautions were taken to reduce photo-damage. Only a
small area was illuminated around the region of interest (ROI), which was
visualised at high magnification (60x objective, Olympus) as shown in Figure 3.5.
This increased spatial resolution, the signal to noise ratio and ensured that the ROI
was in focus. As a consequence, different dendritic sites were imaged separately.
Data was obtained at 5 kHz frame rate with a CCD camera (Red Shirt Imaging,
USA) and digitally filtered with a Gaussian filter at 500 Hz after interpolation of
data points to achieve a 20 kHz sample rate. Somatic AP voltage recordings were
acquired at 5 kHz using the analog input of the camera software. Traces are
averages of 10 to 30 trialstad backgrmu1d illYmiHatioH 1•1.'as sYbtractsd. Data was
stored as text files and analysed with IGOR (Wavemetrics, USA).
* Background fluorescence was corrected online by adjusting the detector offset.
t
Background fluorescence was measured using a region close to the dendrite ofsimilar size to the ROI. The background fluorescence was subtracted from the
fluorescence measured from the ROI. Values for F were measured by averaging
the amount of fluorescence before action potential stimulation (usually 10 ms). To
correct for bleaching of voltage-sensitive dyes, the ROI was imaged without
stimulation of action potentials, and the decay in fluorescence without stimulation
was fitted with a single exponential, and subtracted from data obtained during
CHAPTER 3 23
Results
Backpropagation of single APs versus bursts
Basal dendrites of large layer V pyramidal neurons filled with Ca2+
sensitive dyes were identified by their origin at the soma, the presence of spines,
and their typical radial branching pattern within layer V. APs were generated by
current injection into the soma, and dendritic calcium influxes associated with
single APs and AP bursts were measured at basal dendritic sites using the low
affinity dye OGB-6F (Fig. 3.1). The calcium signal caused by single
backpropagating APs decreased with distance from the soma and was often
undetectable at dendritic locations greater than 150 µm (Fig. 3. lB). In contrast,
bursts of 3 APs or more at 200 Hz reliably produced large calcium transients that
were detected at all dendritic locations (Fig. 3. lB). These experiments indicate
that AP backpropagation into basal dendrites is more effective during
high-frequency AP bursts, as is the case in the apical dendrite of layer V pyramidal
neurons (Larkum et al., 1999a; Williams & Stuart, 2000a). In addition, compared
to calcium signals associated with single APs, the calcium signals generated
during AP bursts were highly supralinear at distal dendritic locations (Fig. 3. lB).
By analogy with findings in the distal apical dendrite (Larkum et al., 1999a), this
suggests that AP bursts in the basal dendrites are associated with significant
dendritic calcium electrogenesis.
To verify that supralinear responses observed using the low affinity dye
OGB-6F was not due to the fact that the Ca2+ transients were on the rising phase
of the sigmoidal relationship between Ca2+ concentration and binding to the Ca2+
-sensitive dye, these experiments were repeated with the high affinity dye OGB-1.
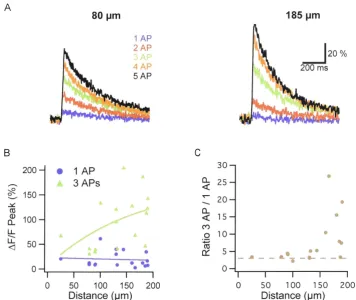
Using OGB-1, single APs produced an increase in intracellular calcium that could
be detected at all dendritic locations, with larger increases at proximal sites (27 ±
6.7% ~F/F peak; n
=
5) than at distal sites (12 ± 4.4% ~F/F peak; n=
5) (Fig.3.2). As seen with the low-affinity Ca2+ dye OGB-6F, using OGB-1 bursts of 3
APs generated supralinear responses compared to the single AP response at distal
...J 50% i:1F/F
~ m s ~
210 µm
120%
__J20 mV 10 ms
Figure 3.1. Calcium imaging of AP backpropagation in basal dendrites. Changes
in intracellular calcium were detected with OGB-6F (200 µM). A. Confocal image
of filled neuron with basal dendrites. Stimulating electrode is filled with red dye
and was used for experiments shown in Chapter 5. Line indicates position of line
scans across basal dendritic branch (120 µm from soma) shown below during
stimulation of 1 AP (left) and 3 APs at 200 Hz (right). Bottom traces show
temporal profile line scans. B. Increase in dendritic calcium (L1F/F) in a different
cell at different distances from the soma in a basal dendrite during trains of 1 to 5
[image:33.528.176.440.117.379.2]A
B
200 -I
•
...--
..
~ 150~
cu ~ 100 LL .4
-LL 50 <J
•
0 -II 0
80 µm
1 AP .4
3APs
.4
•
!•
"·
•
••
•
I I I
1 AP 2AP 3AP 4AP SAP .4 .4 .4 .4
•
•
...
••
I 50 100 150 200 Distance (µm)C 30
0.. 25 I
<(
~
20]
<( 15C'0
o 10 :..:;
cu
er: 5 0 185 µm
_J20%
200 ms•
•
•
•
'
•
• •
_
_.__
..
______
._ I 0 50 100 150 200Distance (µm)
Figure 3.2. AP backpropagation in basal dendrites detected with OGB-1 (200
µM). A. Increasing the number of APs in a train caused linear increases in evoked
Ca2+ influx at proximal sites (left) but supralinear increases in Ca2+ at distal sites
(right). B. Ca2+ transient peaks were similar at different distances from soma for
single APs but increased with distance for bursts of 3 APs. C. Ratio of 3 AP to 1
AP-evoked Ca2+ transients shown in B increases with distance from the soma and
[image:34.528.68.424.69.369.2]findings confirm that AP bursts generate a supralinear increase in distal dendritic calcium in the distal basal dendrites of layer V pyramidal neurons.
Backpropagation of AP trains at a critical frequency
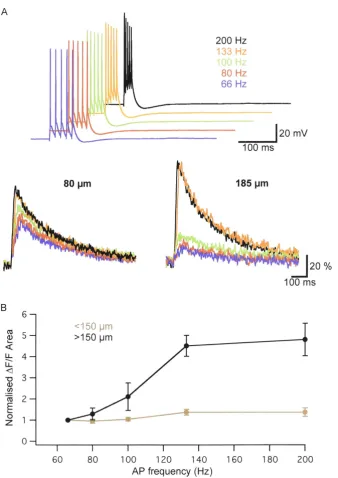
In the apical dendrite of layer V pyramidal neurons trains of APs can evoke dendritic Ca2+ electrogenesis if their frequency exceeds a critical value, usually about 100 Hz (Larkum et al., 1999a). The critical frequency is defined as the frequency of APs in a train of 4 to 5 APs where the time integral of the recorded dendritic voltage becomes substantially larger than at lower AP frequencies. This increased dendritic depolarisation is only observed at distal apical dendritic sites, and is dependent on activation of dendritic voltage-activated calcium channels. Similar findings can be observed in Ca2+ imaging experiments, with a supralinear increase in dendritic calcium concentration at a similar critical frequency (Larkum et al., 1999a). To test whether AP backpropagation into basal dendrites also has a critical frequency, AP-evoked Ca2+ signals were measured at proximal ( <150 µm) and distal (> 150 µm) sites along basal dendrites using the high-affinity Ca2
+ sensitive dye OGB-1. Trains of 5 APs at various frequencies lead to a similar increase in Ca2+ at proximal dendritic locations. In distal dendrites, however, dendritic Ca2+ influx was significantly increased during trains
of 5 APs at frequencies above 100 Hz (Fig. 3.3). On average, Ca2+ transients were
5 fold (± 0.5; n = 5) larger during AP trains at supra-critical AP frequencies (> 100 Hz) compared to the same number of APs evoked at 66 Hz (Fig. 3.3C). Again, these results demonstrate that supralinear summation of APs in distal basal dendrites can activate voltage-gated calcium channels and induce dendritic Ca2+ electrogenesis in the distal basal dendrites of large layer V pyramidal neurons.
Effect of A-type potassium channels
A
80 µm
B
6
ro
5~
<150 µm (1) >150 µm
I....
<(
LL 4
-
LL <'.l "'O 3(1) -~
cu 2
E
I....
0
z
0
60 80 100 120 140 AP frequency (Hz)
200 Hz 133 Hz Q,1 Hz
80 Hz
66 Hz
120 mV
_1_0_0_m_s ...
185 µm
160 180 200
Figure 3.3. Action potential backpropagation in basal dendrites at a critical frequency. A. Trains of APs at different frequencies (top) and evoked Ca2+
transients at a proximal and a distal site. AP frequencies above 100 Hz caused
supralinear Ca2
+ influx at distal (right) but not proximal sites (left). B. Summary
data of AP-evoked increases in Ca2
+ at different frequencies. At a critical
freuqency above 100 Hz AP trains induced significantly more Ca2
+ influx in distal
· than in proximal basal dendrites (n = 5). Data is normalised to changes in Ca2 + at
[image:36.528.110.448.67.545.2]presence of 4-AP (4 mM), DNQX (10 µM) and APV (50 µM) were added to the extracellular solution to block AMPA and NMDA receptors. The Ca2+ influx
associated with the backpropagation of single APs was not changed after blockade of IA channels (Fig. 3.4). These findings rule out modulation of backpropagating APs in basal dendrites by dendritic A-type potassium channels, as observed in apical and oblique dendrites of CAl neurons in the hippocampus (Frick et al., 2003; Hoffman et al., 1997).
Voltage imaging of single action potentials
Voltage-dependent fluorescence transients associated with backpropagating APs were imaged in the basal dendrite at different distances from the soma. Fluorescence changes during APs at proximal dendritic locations had similar waveforms to the voltage recorded at the soma (Fig. 3.5C). To examine the backpropagation of single APs, fluorescent transients associated with the first AP in the burst were compared at different distances from the soma. APs detected at basal dendritic locations were delayed with respect to somatically recorded APs (Fig. 3.6A). The relationship between dendritic location and the latency between the peak of somatic and dendritic APs was not linear (Fig. 3.6B),
A - control
-
4-AP
B
60
..--...
?f2- 40
..__...
LL
-LL
<l 20
0
120
% t-F/F200 ms 120 mV
Figure 3.4. AP backpropagation in basal dendrites is not affected by 4-AP. (A) Ca2
[image:38.531.100.359.56.447.2]C
I
_ 10mv 0.2% ~F/F --10_m_s_~
Figure 3.5. Voltage-imaging of AP backpropagation into basal dendrites. A. AP
induction at soma during staining period (black traces) and after incubation period
(red trace). B. Image of proximal dendrite (average of 30 trials). Rectangle
indicates ROI. C. AP burst recorded at soma (black) and imaged in proximal
dendrite shown in B. Distance from soma was 30 µm. Data in C has been filtered
[image:39.528.88.413.77.449.2]A
B
2.5
I
- - Antic (2003)
- . 2.0~ •
en
s
.
>. 1.5
u •
C
Q.) • •
j
1.0...
•..,a.. /
<( 0.5 .., ..,( I
.., .., C ,.
/
.
o.o~ ....
I ~....
---~----~
I I I0 100 200 300
Distance (µm)
C D
1.0 \ 2.5
00 0.8 00 2.0
- E
!
0.6 \ .i
1.5~
• • •~
0.4 ~ ·· ; 1.0l
..
>
·-
•
a.. I o::: ~ I
<( 02 . • tit • • a.. <( 0.5
•
•
o.oJ
o.o
I I I I
0 1 00 200 300 0 1 00 200 300
Distance (µm) Distance (µm)
Figure 3.6. Action potential attenuation with distance from soma. A.
Superimposed somatic voltage recording (black) and dendritic voltage imaging
(coloured traces). B. AP peak latency increases in a non-linear way with distance.
Dashed line shows linear fit from Antic (2003 ). C. Velocity of AP
backpropagation slows down with distance. Line shows exponential fit. D.
[image:40.526.66.447.90.454.2]Voltage imaging of dendritic electro genesis
A recent study using voltage-sensitive dyes has claimed full invasion of backpropagating APs into basal dendrites without attenuation (Antic, 2003). As yet it is not possible to quantify the magnitude of changes in membrane voltage detected using VSDs. Hence, the absolute amplitudes of the signals detected in the study by Antic (2003) are unknown. What is possible is to compare the size of one signal relative to that of another detected at the same location. To do this,
backpropagation of AP bursts was examined, as this allowed a comparison of the individual AP amplitudes relative to each other. Little change in AP amplitude or shape during the AP bursts was observed at proximal dendritic sites ( < 150 µm)
compared to the somatic voltage recording (Fig. 3.7 A, grey traces). In contrast, at distal dendritic sites (> 150 µm) the amplitude of the third AP in a burst was significantly larger than the first (Fig. 3.7 A), with the peak amplitude of the 3rd AP being on average two-fold larger than the 1st AP (Fig. 3.7B; 2.11 ± 0.22; n =
11; p = 0.01).
Effect of voltage-gated calcium channels
A likely explanations for the finding that the third AP in a burst was significantly larger than the first is that, in contrary to the conclusion of Antic (2003), single APs show significant attenuation at distal basal dendritic locations with the third AP in a high frequency burst boosted due to recruitment of dendritic voltage-activated sodium or calcium channels. This finding is consistent with the observation that the increase in intracellular calcium during single APs is smaller at distal dendritic locations despite the fact that if backpropagting APs did not attenuate in amplitude one might have expected it to be larger due to the smaller diameter of these dendrites and hence greater surface to volume ratio. To test for a role of dendritic calcium channels in boosting the amplitude of the 3rd AP in 3 AP burst cadmium at 200 µM was bath applied. Cadmium reduced the peak of the 3rd AP relative to the 1st (Fig. 3.7C, top traces) and also the depolarisation at the soma following the AP burst (Fig. 3.7C, bottom traces), which has previously been shown to be associated with generation of dendritic calcium spikes (Larkum et al.,
A
B
230 µm
100 µm 5 ~ 4 -.., ~ 3 Q) 0.... LL 2
-LL <J 1
>150 µm
<150 µm
11.0 %
~""l2omv
5 ms
**
o-.
- -
- -
-1st AP . 2nd AP
C
D
3.0-, Control Washout
2.51
T
Cadmium0
~ 2.0 a::
1.5
.:::t::.
ro
Q) 1.0 0....
0.5
0.0
3rd AP/ 1st AP
Figure 3.7. Voltage-imaging of backpropagating AP bursts in basal dendrites. A.
Fluorescence changes in distal (black; 230 µm) and proximal (grey; 100 µm)
dendrites. Bottom traces show simultaneously recorded somatic voltage. Traces
from different distances were recorded separately. B. Pooled peak ~F/F for each
AP in a 3 AP burst at proximal ( <150 µm; n
=
8) and distal (> 150 µm; n=
11)basal dendritic sites. Peak of 3rd AP was significantly larger in distal dendrites. C.
AP bursts induce Ca2
+ spikes in distal dendrites. 3 AP burst as in A in control
(black) and cadmium (200 µM; grey) in different cell at 200 µm from soma. D.
Summarized ratio of third and first AP peak shows significant reduction in
[image:42.531.65.449.77.418.2]direct evidence that bursts of APs in basal dendrites activate voltage-gated calcium channels and induce dendritic Ca2+ spikes.
Discussion
Previous examinations of AP backpropagation have largely been restricted to the apical dendrites of cortical pyramidal neurons. Little is known about the extent of AP backpropagation into smaller dendrites, such as basal dendrites, which receive the majority of the synaptic input (Larkman, 1991). AP backpropagation into these dendrites is particularly relevant to STDP, which has been extensively studied in synaptically coupled layer V to layer V pairs where the majority of synaptic input is onto the basal dendritic tree. The experiments presented in this chapter demonstrate that single APs invade the distal part of the basal dendrites, but are highly attenuated at physiological temperatures. This attenuation is overcome during AP bursts, leading to generation of large localized depolarisations associated with the induction of dendritic Ca2+ spikes.
Calcium imaging and electrogenesis in basal dendrites
It is known from calcium imaging in apical dendrites of layer V pyramidal neurons that single backpropagating APs evoke only small or negligible increases in intracellular calcium at distal locations, whereas high-frequency bursts can lead to substantial distal calcium signals (Larkum et al., 1999a). Similarly, in the basal dendrites of these cells the calcium signal associated with single backpropagating APs declined with distance from the soma, while the response to AP bursts increased supralinearly at distal sites. These observed supralinear increases are unlikely to be a consequence of the non-linear Ca2
CHAPTER 3 28
Voltage imaging of AP backpropagation in basal dendrites