Induction of epigenetic variation in
Arabidopsis by over-expression of DNA
METHYLTRANSFERASE1 (MET1)
Samuel Brocklehurst1, Michael Watson1, Ian M. Carr2, Suzan Out3, Iris Heidmann3, Peter Meyer1*
1 Center for Plant Sciences, University of Leeds, Leeds, United Kingdom, 2 School of Medicine Institute of Biomed. & Clin. Sciences (LIBACS), University of Leeds, Leeds, United Kingdom, 3 Enza Zaden Research and Development B.V., Enkhuizen, NL
*p.meyer@leeds.ac.uk
Abstract
Epigenetic marks such as DNA methylation and histone modification can vary among plant accessions creating epi-alleles with different levels of expression competence. Mutations in epigenetic pathway functions are powerful tools to induce epigenetic variation. As an alter-native approach, we investigated the potential of over-expressing an epigenetic function, using DNA METHYLTRANSFERASE1 (MET1) for proof-of-concept. In Arabidopsis
thali-ana, MET1 controls maintenance of cytosine methylation at symmetrical CG positions. At
some loci, which contain dense DNA methylation in CG- and non-CG context, loss of MET1 causes joint loss of all cytosines methylation marks. We find that over-expression of both catalytically active and inactive versions of MET1 stochastically generates new epi-alleles at loci encoding transposable elements, non-coding RNAs and proteins, which results for most loci in an increase in expression. Individual transformants share some common phenotypes and genes with altered gene expression. Altered expression states can be transmitted to the next generation, which does not require the continuous presence of the MET1 transgene. Long-term stability and epigenetic features differ for individual loci. Our data show that over-expression of MET1, and potentially of other genes encoding epigenetic factors, offers an alternative strategy to identify epigenetic target genes and to create novel epi-alleles.
Introduction
DNA methylation patterns in plants influence a number of molecular mechanisms, including transcription [1], repair [2] and recombination [3], with implications for plant development [4], genome structure [5] and evolution [6]. The responsiveness of DNA methylation patterns to environmental stress [7] has been proposed to act as a molecular switch for evolutionary adaptation of plants to environmental change [8]. In support of this model, various biotic [9] and abiotic stress conditions [10] have been shown to alter DNA methylation profiles. The epi-genotype has therefore emerged as an additional factor to genetic mutations in shaping phenotypic diversity [11], [12].
a1111111111 a1111111111 a1111111111 a1111111111 a1111111111 OPEN ACCESS
Citation: Brocklehurst S, Watson M, Carr IM, Out
S, Heidmann I, Meyer P (2018) Induction of epigenetic variation in Arabidopsis by over-expression of DNA METHYLTRANSFERASE1 (MET1). PLoS ONE 13(2): e0192170.https://doi. org/10.1371/journal.pone.0192170
Editor: Keqiang Wu, National Taiwan University,
TAIWAN
Received: August 30, 2017
Accepted: January 17, 2018
Published: February 21, 2018
Copyright:©2018 Brocklehurst et al. This is an open access article distributed under the terms of theCreative Commons Attribution License, which permits unrestricted use, distribution, and reproduction in any medium, provided the original author and source are credited.
Data Availability Statement: Data are available at
NCBI BioProject database under SubmissionID SUB2885208, BioProject ID: PRJNA395995.
Funding: SB was funded by a BBSRC CASE
studentship (http://www.bbsrc.ac.uk/) BB/ K011669/1.
Competing interests: The authors have declared
Cytosine methylation inArabidopsisoccurs in three sequence contexts. The most promi-nent methylation mark at CG sites is faithfully propagated by maintenance DNA METHYL-TRANSFERASE1 (MET1), a plant homolog of the mammalian DNA methyltransferase 1 (Dnmt1). Non-symmetrical CHH methylation (H representing C, T or A) is controlled by the RNA-directed DNA methylation (RdDM) pathway with 24nt small RNAs (siRNAs) acting as guides forde novoDOMAINS REARRANGED METHYLTRANSFERASE 2 (DRM2). A third DNA methyltransferase, CHROMOMETHYLASE3 (CMT3), which is exclusively found in plants, predominantly controls CHG methylation [13] in combination with histone methyl-transferases [14]. The RdDM pathway predominantly controls repeats in heterochromatic regions and in dispersed transposons, and related sequences in euchromatic regions [15]. At a number of loci, RdDM-mediated DNA methylation is supported by the Snf2 remodeler DRD1, which forms a complex with RdDM pathway proteins [16]. An RdDM-independent DNA methylation pathway is controlled by DDM1, another Snf2 family nucleosome remode-ler, which facilitates access to heterochromatic regions for DNA methyltransferases, especially for CHROMOMETHYLASE 2 (CMT2), which controls the majority of methylation at CHH sites in pericentromeric heterochromatin [17].
The analysis of distinct genomic loci has helped to establish mechanistic models that allo-cate specific functions to the different DNA methyltransferases. MET1 has mainly been dis-cussed in the context of its maintenance function for CG methylation marks, providing more stable epigenetic patterns than the target loci of the RdDM pathway, which show a higher level of epigenetic variation inArabidopsisaccessions [18]. The role of MET1, however, is not strictly limited to maintenance of CG methylation. At some genetic regions with dense DNA methylation in all sequence contexts, elimination of MET1 activity causes a loss of all methyla-tion marks [19], which can result in heritable loss of dense methylation patterns creating novel epi-alleles and states of expression [20]. At many of these loci, dense DNA methylation is inde-pendent of DRM2 and other components of the RNA-directed DNA methylation (RdDM) pathway. Instead, dense methylation at these loci requires the nucleosome remodeler DDM1, with CHH methylation being controlled by CHROMOMETHYLASE 2 (CMT2) and CHG methylation by CHROMOMETHYLASE3 (CMT3) [20].
There are several mechanistic options that could explain how MET1 depletion could result in a loss of CG and non-CG marks in dense methylation region. MET1 may be part of a multi-protein complex that also contains CMT2 and/or CMT3 and that would be non-functional without MET1. Alternatively, MET1 depletion would be have an indirect effect on other epige-netic factors that it interacts with, and that are required for dense methylation. This could involve interaction of MET1 with histone regulators like HISTONE DEACETYLASE6 (HDA6), for which direct binding to MET1 has been demonstrated [21] and which has been proposed to recruit MET1 to certain target loci as the initial step in establishing subsequent non-CG methylation [22]. Finally, depletion of MET1-controlled CG-methylation in dense methylation region could remove epigenetic marks established by CG-methylation, which may be required to recruit CMT2 and CMT3. An indirect effect of MET1 on non-CG methyla-tion has, for example, been observed at certain loci that lose their H3K9 methylamethyla-tion patterns in amet1mutant, which resulted in a loss of CHG and CHH methylation marks [23].
MET1transgene, its expression induces heritable epi-alleles at distinct loci with altered expres-sion levels and epigenetic marks.
Materials and methods
Construction of plasmids and plant transformation
DNA fragments with compatible ends were ligated in a reaction incubated for 17 h at 4oC using 1 U of T4 DNA ligase (Promega). De-phosphorylation was carried out using calf intesti-nal alkaline phosphatase (Promega) according to the manufacturer’s instructions. 5’ overhangs produced after amplicon assembly were filled by PCR using the Phusion high-fidelity PCR kit (Finnzymes).Arabidopsistransformation was carried out by floral dip [24].
TheMET1cDNA [25] was cut from p-GEM T easy (Promega) usingEcoRI and was subse-quently ligated into pGreen II 0179 35S-NOS, which contains a singleEcoRI site in the polylin-ker region between the promoter and terminator. To remove the catalytic function from MET1 we followed the strategy documented by Hsieh et al [26] and exchanged the cysteine residue in the active site loop region in MET1 GGPPCQGFSGMNRFN by a serine residue. Site-directed mutagenesis and subsequent assembly-PCR were used to mutate the cysteine codon (TGT) to a serine codon (TCT) within theMET1coding sequence.
Plant material
T1 transformants A1, A2, I1 and I2 were selected on hygromycin medium and were selfed. T2 progeny plants of each line were grown without selections and were genotyped. To differentiate between transformants that had retained or lost theMET1transgene, respectively, primers were designed annealing either side of an intron of theMET1gene. These primers amplify part of the endogenousMET1gene yielding a 1161bp fragment, while amplification of a part of theMET1
cDNA transgene without the intron produces a 786bp fragment. Plant with (+) and without (-) the transgene we isolated and selfed. T3 seeds of these plant were placed on hygromycin selec-tion to confirm that the transgene had been lost in (-) plants and to identify (+) lines that were homozygous for the transgene. One (-) plant and one (+) plant, homozygous for the transgene, were selected for each line. For transcript profiling, qRT-PCR and bisulphite sequencing analy-sis, three replica samples were prepared, each contained ten pooled four-week old seedlings of the T3 generation. Control plants were derived from non-transgenic seeds raised from a trans-formation experiment after culture of seeds on selection-free media.
Plant analysis
Seeds were sterilised by washing in 70% ethanol for 2 minutes, soaking in 30% bleach (4.8% active hypochloride) for 10 minutes and washing 3 times with sterilised water. Sterilised seeds were sown on MS15 medium (4.4g/l Murashige and Skoog plus vitamins; 15g/l Sucrose; 1% agar; pH 5.8) and germinated under long day conditions (25oC, 16 hour photoperiod). After four weeks seedlings were harvested for molecular analysis. For flowering analysis seedling were grown on MS15 medium under long day conditions, and were transferred to soil after four weeks. For bolting analysis, leaves above 1cm in length were counted, once the primary bolt reached 1cm in height from the base of the plant.
Sequencing and data analysis
using the STAR aligner [27]. Reads mapping to each transcript were determined using the R pack-age rsubRead [28] and pairwise comparisons between the wild type sample and each of the modi-fied samples were performed using the R package DeSeq2 [29] to identify transcripts whose expression varied markedly between the control and experimental sample for each condition Reads were used to calculate the mean value of read mapping to a transcript in all sample in the analysis (base Mean), the change in expression between the control sample and the test sample given as a Log to the base 2 value (log2FoldChange), the standard error of variation for the log2-FoldChange values in the analysis (lfcSE = log fold change Standard Error), the Wald statistic; the log2FoldChange divided by lfcSE, the probability the result is real; the log2FoldChange divided by lfcSE, compared to a standard Normal distribution to generate a two-tailed pvalue (pvalue) and the pvalue adjusted for multiple testing using the Benjamini-Hochberg test (Padj).
Raw data were submitted to the short read archive of NCBI BioProject database under Sub-missionID SUB2885208, BioProject ID PRJNA395995 for the following Datasets:
Quantitative RT-PCR assay
Gene expression was analysed using SsoFast EvaGreen supermix (BioRad) on the Fluidigm Biomark 96.96 Dynamic Array according to the manufacturer’s protocol. Data analysis was carried out utilizing the Fluidigm Gene Expression Analysis software using ACTIN 2 (AT3G18780) as the reference gene. Primers are listed inS8 Table.
ChIP analysis
28-day-old seedlings were harvested and cross-linked with 1% formaldehyde. Chromatin was extracted using the ChromaFlash Plant Chromatin Extraction Kit (Epigentek) and sheared to 200-500bp fragments using a Bioruptor (Diagenode). ChIP was carried out using the EpiQuik Plant ChIP Kit (Epigentek). Input samples and immunoprecipitated samples were analysed using SsoFast EvaGreen supermix (BioRad) on the Fluidigm Biomark 96.96 Dynamic Array according to the manufacturer’s protocol. ChIP-qPCR results were first normalized with input sample. Relative enrichment was then calculated via the enrichment of the signal (antibody of interest) compared to the enrichment of the noise (negative control). Primers used for
Accession Sample Name Organism Tax ID BioProject
SAMN07419160 WT_1 Arabidopsis thaliana 3702 PRJNA395995 SAMN07419161 WT_2 Arabidopsis thaliana 3702 PRJNA395995 SAMN07419162 WT_3 Arabidopsis thaliana 3702 PRJNA395995 SAMN07419163 A1+_1 Arabidopsis thaliana 3702 PRJNA395995 SAMN07419164 A1+_2 Arabidopsis thaliana 3702 PRJNA395995 SAMN07419165 A1+_3 Arabidopsis thaliana 3702 PRJNA395995 SAMN07419166 A1-_1 Arabidopsis thaliana 3702 PRJNA395995 SAMN07419167 A1-_2 Arabidopsis thaliana 3702 PRJNA395995 SAMN07419168 A1-_3 Arabidopsis thaliana 3702 PRJNA395995 SAMN07419169 A2+_1 Arabidopsis thaliana 3702 PRJNA395995 SAMN07419170 A2+_2 Arabidopsis thaliana 3702 PRJNA395995 SAMN07419171 A2+_3 Arabidopsis thaliana 3702 PRJNA395995 SAMN07419172 A2-_1 Arabidopsis thaliana 3702 PRJNA395995 SAMN07419173 A2-_2 Arabidopsis thaliana 3702 PRJNA395995 SAMN07419174 A2-_3 Arabidopsis thaliana 3702 PRJNA395995
amplification are listed inS8 Table. Antibodies used for ChIP: anti-acetyl-histone H4K5K8K12K16 (06–866; Millipore), H3K4me3 (07–473, Millipore), H3K9me3 (07–442, Millipore), normal rabbit IgG (12–370, Millipore).
Bisulphite analysis
Genomic DNA was isolated [30] and subjected to bisulfite treatment using an EZ DNA Meth-ylation-lightning kit (Zymo Research) according to the manufacturer’s instructions. Regions containing dense methylation forAt3G01345(Chr3: 129684..129860–177 bp),At3G27473
(Chr3: 10171884..10172090–207 bp), andAt3G30720(Chr3: 12348994..12349109–116 bp)
AT5G34850(Chr5: 13111304..13111574 – 271bp) were amplified by primers listedS8 Table. For each line, 10 clones were sequenced and sequences were exported into the BioEdit pro-gram [31]. Aligned sequences were saved in FASTA format and analysed by the CyMATE pro-gramme [32].
Data analysis
The ThaleMine platformhttps://apps.araport.org/thalemine/begin.dowas used to extract the annotation for extracted genes. DNA methylation patterns were extracted from the Neomorph platformhttp://neomorph.salk.edu/epigenome/epigenome.htmlto identify genes with dense DNA methylation patterns.
Results and discussion
Phenotypic changes in MET1 over-expression lines
To investigate the effects ofMET1over-expression,Arabidopsiswas transformed with a con-struct which contained theMET1cDNA under the control of the 35S promoter and with a sec-ond construct carrying a point mutation in theMET1cDNA introducing a C/S replacement in the active site loop region that renders the MET1 protein catalytically inactive [26]. For each construct, two transgenic lines were selected; lines A1 and A2 contain the cDNA encoding a catalytically active MET1, and lines I1 and I2 contain the cDNA encoding a catalytically inac-tive MET1. To identify heritable effects that do not require continuous presence of theMET1
transgene, each line was selfed and plants were selected from the T2 generation that had retained the transgene (labelled ‘+’) as well as plants that had lost the transgene (labelled ‘-‘). In plants that had retained the transgene,MET1transcript levels were found to be increased about 3-fold in A1+ and I1+, and about 15-fold in A2+ and I1+. In lines that had lost the trans-gene,MET1transcript levels had been restored to wildtype levels (S1 Fig).
Among theMET1lines specific shoot and root phenotypes were observed (Fig 1). In all lines, primary root length was reduced (S2A Fig) and several lines showed an increase in sec-ondary roots (S2B Fig) and a delay in bolting (S2C Fig). Similar common phenotypes were present in different lines, which were also retained inMET1lines that had lost the transgene, suggesting that that phenotypic changes represent heritable changes induced at common target loci. There was no direct correlation detectable between the transgene expression levels and the severity of individual phenotypes in individual lines.
target genes are only susceptible to increased MET1 levels during a short developmental period, and if epigenetic changes not only depend on the local concentration of MET1 but also on the local concentration of proteins that interact with MET1.
[image:6.612.49.577.73.503.2]A reduction in primary root length has been reported forArabidopsisseedlings treated with the DNA methylation inhibitor 5-azacytidine [33], which suggests that the phenotype is associ-ated with cytosine hypomethylation. Among theMET1over-expression lines, we did not observe any defect in leaf shape or size, nor in flower structure or floral organ identity, which have been reported forddm1[34] and forMET1antisense lines [4], but the delay in bolting resembles phenotypes observed in some mutants associated with DNA methylation pathways. Both theHDA6mutantaxe1-5andHDA6RNAi lines display late flowering phenotypes [35]. When grown in long-day photoperiod,ddm1-2mutant plants also flower late [34], while they
Fig 1. Shoot and root phenotypes in wildtype control plants, in MET1 transformants (+) and in lines derived from MET1 transformants, from which the transgene has been removed (-). Lines A1 and A2 express a catalytically active MET1 transgene, lines I1 and I2 express a catalytically inactive MET transgene. Images
were taken eight weeks after stratification. The scale bar for shoot images indicates 5cm, the scale bar for root images indicates 10mm.
flower early under short day conditions [36]. Plants with altered MET1 functions show a range of flowering time effects. Inmet1-3 mutants, a consistent delay in flowering is observed [37],
met1-2mutant plants exhibit normal morphology and development, andmet1-1mutants are late flowering [38]. Demethylation of DNA via 5-azacytidine (5-azaC) treatment or via expres-sion of aMET1antisense gene causes early flowering, with the promotion of flowering being directly proportional to the decrease in methylation inMET1antisense lines [36].
With regard to the maintenance of phenotypes in lines that had lost theMET1transgene, at least partial heritability of phenotypes has been reported forMET1antisense lines when the antisense transgene had been lost via segregation [36] and for derivatives of amet1-1mutant with restored wildtype MET1 levels. The at least partial transmission of the late flowering phe-notype in these lines was explained by the inheritance offwaepigenetic alleles activated in the
met1-1mutant [38]. As themet1-1allele encodes a MET1 protein with a single aminoacid sub-stitution, it is possible that some of the induced phenotypes are generated by changes in pro-tein structure and interaction, which may induce similar effects as an increase in MET1 concentration.
Expression changes in MET1 over-expression lines
To identify potential target loci forMET1over-expression, pools of 4-week-old T3 seedlings of lines A1+ (S1 Table), A1- (S2 Table), A2+ (S3 Table) and A2- (S4 Table) were used for tran-script profiling. In each line except line A2-, the majority of genes with altered trantran-script pro-files show an increase in expression. Applying a cut-off of a log2-fold change of 2.5, increased expression levels were observed in 644 genes in A1+, 565 genes in A1-, 22 in A2+ and 37 in A2-. Reduced expression was observed in 240 genes in A1+, 77 genes in A1-, 0 genes in A2+ and 85 genes A2-. The three major categories of genes with altered gene expression were trans-posable elements (S5 Table), genes expressing non-coding transcripts (S6 Table) and coding genes (S7 Table).
The majority of genes encoding transposable elements are up-regulated. An exception is the down-regulated geneAT5G34853,MUSTANG 8(MUG8), which encodes a member of a domesticated transposable element gene family MUSTANG. Members of this family are derived from transposable elements genes but gained functions in plant fitness and flower development [39]. To assess the efficiency and frequency of heritable expression changes, we compared transcript data from lines A1+ and A1-. Heritability frequencies differed among the individual categories of transposable element genes and non-coding RNA (Table 1), with high heritability levels for snRNAs (100%), snoRNA (98%), ncRNAs (82%) and pseudogene TEs (80%), and low heritability rates for CACTA-like TEs of Tnp1/En/Spm (16.7%) and Tnp2/En/ Spm types (21.9%) and for Ty1-Copia-like retrotransposons (36.8%). This suggests that the transcript changes induced afterMET1over-expression at individual genetic loci are main-tained with different levels of efficiency. This resembles observations made inmet1-1,met1-3
[40] andddm1-2 lines [41,42], where induced hypomethylation of repeat sequences was either fully reversed or could be stably inherited for at least eight generations. Heritable activation in
ddm1has, for example, been reported for the CACTA family members CAC1-CAC4 [43], [44], [41] and for LTR-retrotransposons (ATGP3,ATCOPIA13,ATCOPIA21,ATCOPIA57,
ATCOPIA93/EVD) [45]. Inmet1lines, ATLANTYS2 and VANDAL21, family member show particularly high heritability levels [40].
ddm1-2, andhda6-5,AT3G42658, which is upregulated inmet1-1,ddm1-2,hda6-5andsuvh4,
AT2G04770andAT5G19015, which are jointly and additively regulated by MET1 and HAD6 [21], andAT3G31442, for which strong activated is only observed inddm1-2[46]. Some TEs activated inMET1over-expression lines also deviate in their heritability levels. While, for example, Athila elements that are activated inmet1mutants are efficiently silenced again after re-introduction of a MET1 transgene copy [40], two third of all Athila elements activated in
MET1over-expression lines, retain this status after removal of theMET1transgene (Table 1). To differentiate between potential primary and secondary targets of MET1-based epigenetic modifications, we used the methylome genome browserhttp://neomorph.salk.edu/[23] to screen genes with altered transcript levels for the presence of dense methylation patterns. We identified 31 primary target candidate genes with heritable dense methylation. These genes were entered intoTable 2, arbitrarily grouped into three categories, based on the presence of dense methylation in the promoter or 5’ region (upstream), in the gene region (genic) or in the genomic region into which the gene is embedded (region).
Several of the genes listed inTable 2have been shown to be sensitive to DNA methylation changes. The up-regulated geneAT4G25530,FLOWERING WAGENINGEN (FWA), is imprinted in the endosperm under the control of MET1 [47] and DDM1 [48]. Silencing is most likely mediated by transposable-element-derived tandem repeats in the promoter region [49]. In line A1-,FWAactivation is retained, which suggest that, at least in some lines,MET1
[image:8.612.39.577.107.423.2]over-expression can induce a heritable activation. In contrast, anFWAallele activated in
Table 1. Summary of transposable elements and genes expressing non-coding RNAs with altered transcript levels and their heritability rates. Data were compiled
for different categories of transposable elements (S5 Table) and genes expressing non-coding RNAs (S6 Table) that showed at least log2-fold changes of +/- 2.5 in line A1 + compared to wildtype. For each gene the values in A1+ and A1- were compared to score the heritability of expression changes.
No of genes Genes with heritable changes Percentage heritable changes
Transposable elements
CACTA-like transposase family (En/Spm) 3 0 0
CACTA-like transposase family (Ptta/En/Spm) 59 39 66.1 CACTA-like transposase family (Tnp1/En/Spm) 18 3 16.7 CACTA-like transposase family (Tnp2/En/Spm) 32 7 21.9
CACTA-like transposase family, putative 4 0 0
copia-like retrotransposon family (Ty1-Copia-element) 19 7 36.8 gypsy-like retrotransposon family (Athila) 59 39 66.1 gypsy-like retrotransposon pseudogene (Athila) 4 4 100 gypsy-like retrotransposon genes and pseudogenes (Athila) 63 43 68.3 gypsy-like retrotransposon family (Ty3-element) 26 16 61.5 hAT-like transposase family (hobo/Ac/Tam3) 12 9 75
Mutator-like transposase family 24 16 66.7
non-LTR retrotransposon family (LINE) 11 8 72.7
transposable element gene 64 37 57.8
transposable element gene; pseudogene, hypothetical protein 86 69 80.2
non-coding RNAs
miRNAs 4 4 100
NATs 10 5 50
ncRNA 50 41 82
rRNAs 2 0 0
snoRNAs 57 56 98.2
snRNAs 8 8 100
tRNAs 2 2 100
Table 2. List of all coding genes with heritably increased (negative log2-fold change) or reduced (positive log2-fold change) transcript levels in the A1 lines with dense cytosine methylation in all three sequence contexts (CG, CHG, CHH).
Gene ID line log2-fold change
pvalue Location of dense C methylation
Annotation
Increased transcript levels
AT2G34130 A1+ -6.343 7.37E-42 genic MEE19 maternal effect embryo arrest 19; hypothetical protein A1- -1.855 0.000285
A2+ -2.970 5.17E-62
AT3G01345 A1+ -7.076 4.86E-76 genic Expressed protein A1- -6.829 5.84E-86
A2+ -0.883 6.86E-08
AT3G21570 A1+ -3.451 2.47E-09 genic proline-rich nuclear receptor coactivator A1- -1.949 0.000119
AT3G24542 A1+ -5.551 8.93E-28 genic Beta-galactosidase related protein A1- -4.889 3.90E-26
AT3G53910 A1+ -4.682 3.88E-18 genic Malate dehydrogenase-like protein A1- -3.701 8.64E-14
AT4G18150 A1+ -5.660 7.99E-34 genic Serine/Threonine-kinase, putative A1- -5.388 3.45E-37
AT5G15360 A1+ -4.214 6.81E-14 genic Transmembrane protein A1- -6.021 7.80E-51
AT5G26270 A1+ -3.470 2.04E-09 genic Transmembrane protein A1- -5.411 4.71E-64
AT5G35375 A1+ -3.379 4.08E-09 genic Transmembrane protein A1- -2.398 2.47E-06
AT5G01080 A1+ -2.550 1.39E-05 upstream/ genic Beta-galactosidase related protein A1- -4.218 5.14E-21
AT3G27473 A1+ -2.984 9.32E-09 upstream Cysteine/Histidine-rich C1 domain family protein A1- -1.797 0.000464
AT3G30775 A1+ -1.205 1.18E-08 upstream EARLY RESPONSIVE TO DEHYDRATION 5 (ERD5); Encodes a proline oxidase, its mRNA expression induced by high levels of Al and by osmotic stress. The promoter contains
an L-proline-inducible element. A1- -2.719 6.01E-38
AT4G09430 A1+ -2.531 2.12E-06 upstream Disease resistance protein (TIR-NBS-LRR class) family; with Natural antisense transcript At4G09432, FUNCTIONS IN: transmembrane receptor activity, ATP binding. A1- -2.721 6.51E-09
AT4G25530 A1+ -10.316 7.26E-118 upstream FLOWERING WAGENINGEN, FWA, HDG6, HOMEODOMAIN GLABROUS6 A1- -3.858 3.10E-14
A2+ -2.503 7.00E-44
AT5G23240 A1+ -2.881 9.78E-30 upstream ATDJC17, DJC76, DNA J PROTEIN C76, DNAJ heat shock N-terminal domain-containing protein
A1- -2.544 1.21E-20 A2- -3.046 1.10E-41
AT5G24240 A1+ -4.144 3.44E-14 upstream Phosphoinositide 4-kinase PI4Kc3, Overexpression mutants display late-flowering phenotype.
A1- -4.524 3.52E-24
AT2G06904 A1+ -5.267 1.48E-23 region Nucleic acid / zinc ion binding protein A1- -4.457 1.88E-20
A2+ -1.449 7.54E-17
AT2G07240 A1+ -2.203 1.99E-04 region Cysteine-type peptidase A1- -3.788 2.22E-15
AT2G11778 A1+ -9.461 1.53E-116 region Transmembrane protein A1- -8.981 6.08E-135
A2+ -2.911 2.75E-59
ddm1-2, was efficiently re-methylated and re-silenced upon restoration of the DDM1 function. Only in some rare cases, further hypomethylation and reactivation of FWA alleles could occur [41]. The up-regulated geneAT4G03950, which encodes a Nucleotide/sugar transporter family protein, is activated in some but not all biological replicas of 9-day-old seedlings of addm1-2
mutant [49]. The up-regulated geneAT3G30720,Qua-Quine Starch (QQS)is embedded within a TE-rich region and its expression levels are increased inmet1,ddc(ddm1/ddm2/cmt3),ddm1
and in theRNA-DEPENDENT RNA POLYMERASE 2 mutant rdr2. QQS expression levels, vary considerably among natural accessions, which correlates negatively with the DNA meth-ylation level of repeated sequences located within the 50end of the gene. DNA methylation and
expression variants can be inherited for several generations. [50].
A large number of the genes with dense methylation marks and altered expression inMET1
over-expression lines, also show modified expression profiles in thehda6mutantaxe1–5. The upregulated geneAT3G30720is also upregulated inaxe1–5and the downregulated gene
AT5G13170is also downregulated inaxe1–5[51].HDA6regulates cold acclimation under low temperature condition. Ten of the genesactivated in MET1 over-expression lines(AT3G01345,
Table 2. (Continued)
Gene ID line log2-fold change
pvalue Location of dense C methylation
Annotation
AT3G28193 A1+ -3.823 3.92E-12 region Transmembrane protein A1- -4.477 2.58E-22
AT3G30720 A1+ -4.185 2.57E-117 region QQS qua-quine starch A1- -3.951 2.41E-95
A2+ -0.748 6.70E-06
AT3G30770 A1+ -5.097 4.01E-23 region Eukaryotic aspartyl protease family protein A1- -5.149 2.83E-31
AT3G31910 A1+ -4.855 7.50E-24 region Ulp1 protease family protein (DUF1985) A1- -3.709 1.98E-15
AT3G42723 A1+ -4.205 2.11E-15 region ATP binding / aminoacyl-tRNA ligase/ nucleotide binding protein A1- -2.870 5.22E-09
AT3G44070 A1+ -5.709 4.19E-28 region Glycosyl hydrolase family 35 protein A1- -5.617 6.42E-37
AT3G44265 A1+ -6.376 7.87E-46 region Beta-galactosidase-like protein A1- -5.866 2.31E-47
A2+ -0.549 8.62E-05
AT4G03950 A1+ -3.246 2.27E-08 region Nucleotide/sugar transporter family protein A1- -3.250 4.93E-11
AT5G45570 A1+ -4.759 5.05E-17 region Ulp1 protease family protein A1- -3.487 4.75E-13
A2+ -1.290 8.65E-14
Reduced transcript levels
AT5G34850 A1+ 7.956 1.09E-105 upstream Purple acid phosphatase 26 A1- 7.971 6.56E-111
Antagonistic transcript level changes in A1+ and
A1-AT3G50770 A1+ 2.816 3.50E-15 upstream CML41, calmodulin-like 41 FUNCTIONS IN: calcium ion binding A1- -0.948 0.00018459
AT4G00130 A1+ 2.452 6.56E-08 region DNA-binding storekeeper protein-related transcriptional regulator A1- -3.355 4.03E-63
[image:10.612.37.576.90.486.2]AT3G27473,AT3G30770,AT3G44070,AT5G01080,AT5G15360,AT5G24240,AT5G26270,
AT5G35375andAT5G45570), are upregulated inaxe1–5after cold treatment [51]. Two genes listed inTable 2are regulated by DNA methylation.The up-regulated gene
AT3G50770,calmodulin-like 41 (CML41,)contains transposon promoter insertions [52]. Its increased expression, in response to elevated temperature, correlates with reduced promoter DNA methylation [53]. The down-regulated geneAT3G18610,nucleolin like 2 (NOR2), is involved in epigenetic regulation, as its disruption induces rDNA hypermethylation [54].
Epigenetic changes in selected target genes
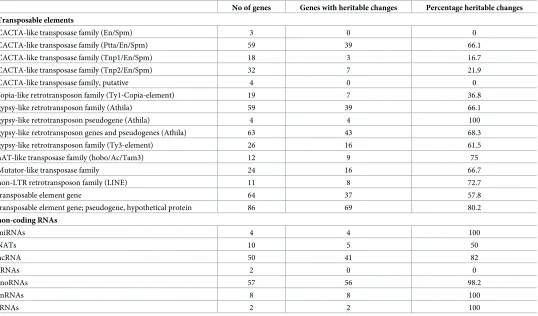
We selected four genes fromTable 2for further analysis of expression changes and epigenetic features. We selected three genes with increased transcript levels that contained dense DNA methylation marks in the upstream region (At3G27473), in the genic region(At3G01345)or in the chromosomal environment (At3G30720), respectively, and one gene with reduced tran-script levels and dense methylation in the upstream region (At5G34850). For q-RTR analysis, transcript samples were prepared from T3 seedling pools for all eightMET-overexpression lines. Similar to the observed phenotypes, expression changes of the four analysed genes occur independently of expression levels, catalytic activity or conservation of theMET1transgene. Within individual lines, expression changes occur stochastically and with different intensity, inducing an increase in expression for all genes exceptAt5G34850, which displays a significant reduction in expression in six out of eightMET1-overexpression lines. In mostMET1- overex-pression lines that have lost the transgene, exoverex-pression changes are conserved (Fig 2).
To investigate if expression changes in the four genes were associated with epigenetic changes, we compared cytosine methylation and histone marks in wildtype andMET1 over-expression lines. Bisulphite sequencing analysis of densely methylated regions (S3 Fig) identi-fied a reduction or loss of methylation marks for all three genes, independent of the expression levels of the three activated genes in different lines (Fig 3). This suggests thatMET1 overex-pression induced heritable hypomethylation at these loci, which was, however, not in all cases sufficient to increase gene expression. The analysis of the silenced geneAt5G34850, turned out to be more complicated. PCR-analysis of the locus (S4 Fig) revealed that the upstream region of the gene, which contains multiple repetitive elements, had been deleted or rearranged in all six lines, in which the gene had been silenced. Moreover, a central region ofAt5G34850also could not be amplified in lines A1+ and A1-, suggesting extensive rearrangement of the locus in the six lines that may be the result of transposon activity. Bisulphite analysis of the 5’ region of the gene, which had been retained in all eight lines, did not give any indication for DNA methylation changes (Fig 3).
To investigate if expression changes correspond to changes in specific histone marks, we compared histone 4 acetylation and histone 3 methylation (H3K9me2, H3K4me3) marks of
At5G34850,At3G01345,At3G27473andAt3G30720in wildtype and in the eightMET1 over-expression lines (Fig 4). H3K9me2 levels were moderately reduced forAT3G01345in most lines and H4 acetylation levels were increased in some lines forAT3G01345,AT3G27473and
of upstream regions that are required for gene expression. It also unclear if H3K4me3 reduc-tion is causally linked to DNA rearrangements or expression changes.
The expression analysis had identified genetic loci for which the presence of theMET1
transgene was not required to maintained expression changes inMET1over-expression lines. This suggests that for certain loci epigenetic changes that alter gene expression, once they had been induced by enhancedMET1expression, are inherited without the need for increased
MET1levels. This does, however, not exclude the possibility that in lines that have maintained theMET1transgene, enhancedMET1levels continuously induce new epigenetic changes. The expression analysis in T3 populations (Fig 2) had shown no indication for a specific enhancement of expression changes inMET1over-expression lines that had retained the
MET1transgene. Such effects may, however, be obscured by the stable propagation of initial
MET1-induced epigenetic states, and might become more easily detectable in later genera-tions, especially at loci with semi-stable epigenetic changes. If the presence of theMET1
[image:12.612.42.586.72.467.2]transgene favours the induction of new epigenetic changes, expression changes at loci with
Fig 2. RT-PCR analysis of four genes with dense methylation in MET1 transformants with (+) and without the transgene (-). Lines A1 and A2 express a
catalytically active MET1 transgene, lines I1 and I2 express a catalytically inactive MET transgene. The mean and the standard error are shown for three biological replicates each tested in three technical replicates. Values on the y-axis represent the log2-fold-difference compared to the control line.
semi-stable epigenetic states would be expected to revert to wildtype levels in progeny of
MET1over-expression lines that have lost the transgene but could be re-established in progeny that has retained the transgenes.
To investigate this option and to test the long-term stability ofMET1-induced expression changes, we compared the expression profiles of six genes in the T3 and T4 generation (Fig 5). In most lines, enhanced expression of genes observed in the T3 generation, is also detectable in the T4 generation, although at a lower levels. In a few lines, enhanced expression is restored to wildtype levels in the T4 generation. A comparison of the four (-) lines that have lost the
[image:13.612.46.576.74.450.2]MET1transgene, suggests locus-specific differences in the efficiency of maintaining expression levels, with enhanced states being preserved forAt3G30720but reset forAt5G34850. This cor-responds to previous reports about locus-specific differences in the maintenance of epigenetic changes [55] [56]. For all genes exceptAt3G30720, the analysis implies that enhanced expres-sion can be maintained in the T4 generation at a reduced level, with a tendency to be reset to the original levels over subsequent generation. The stable epigenetic state ofAt3G30720 con-firms reports about addm1-derived hypomethylated epiallele ofAt3G30720that was inherited
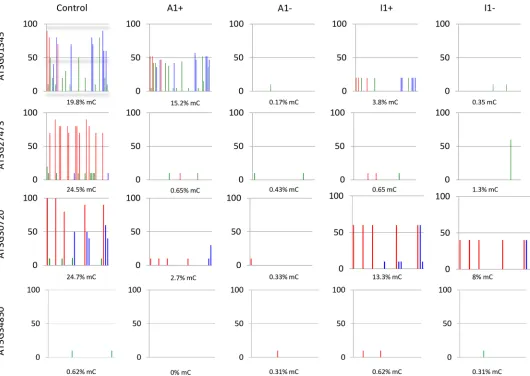
Fig 3. DNA methylation analysis of regions (S3 Fig) of genesAT3G01345, AT3G27473, AT3G30720, AT5G34850 in MET1 transformants (+) and in lines derived fromMET1 transformants, from which the transgene has been removed (-). Lines A expresses a catalytically activeMET1transgene, line I1 expresses a catalytically inactiveMETtransgene. Red bars denote CG methylation, blue bars CHG methylation and green bars CHH methylation.
for least eight generations [50]. In some lines, enhanced expression levels are higher in the T4 generation than in the T3 generation. This applies toAt3G30720in lines I1+ and I2+,
[image:14.612.163.576.76.582.2]At3G27473in lines A2+ and I2+ andAt3G01345in line I1+ (Fig 5). All lines have retained the MET1 transgene, which suggests that epigenetic changes can be continuously induced in lines that have retained increasedMET1expression.
Fig 4. ChIP analysis of genesAt3G27473, At3G01345, At3G30720 and At5G34850 for H3K9me2, H3K4me3 and H4 acetylation marks. The means and the standard errors are shown for three biological replicates each tested in three technical
replicates. Values on the y-axis represent the fold-difference of histone mark levels compared to the control line.
To compare the effects ofMET1over-expression withMET1mutation, we examined the expression of the six genes in amet1-1mutant and in a met1 derived linemet1-1RE, from which themet1mutant alleles had been replaced byMET1wildtype alleles. No significant
Fig 5. Comparison of expression profiles of genesAT3G01345, AT3G27473, AT3G30720, AT3G30820, AT4G25530 and AT5G34850 in MET1 lines. T3 seeds are
labelled in blue, T4 seeds are labelled in orange.
expression changes were observed inmet1-1ormet1-1REforAT5G34850, the locus that had been rearranged in some MET1 over-expression lines. The five genes, however, that had shown increased expression inMET1over-expression lines were also more highly expressed in themet1-1mutant. This suggests that all five genes respond in a similar way to an increase and to a reduction in MET1 levels. Enhanced expression of all five genes inmet1-1was reversible as wildtype expression levels were restored inmet1-1RE(Fig 6).
Our data show thatMET1over-expression can be employed to induce epigenetic changes, with enhancedMET1expression levels being required but not always sufficient to induce epi-genetic changes. There is not direct correlation between the level of enhancedMET1 expres-sion and the efficiency of the induction of epigenetic changes. This implies that recombinant MET1 proteins do not act like a transcription factor or like any other concentration-dependent gene regulator.MET1over-expression acts stochastically but not randomly as it induces simi-lar changes in epigenetic and expression states at specific target loci in different MET1-overex-pression lines. This resembles position-effect-variegation effects where epigenetic changes also occur stochastically but with defined probability for individual loci [57].
[image:16.612.196.575.75.312.2]As increased transcript levels are stable inMET1over-expression lines (S1 Fig) and as there is no indication that enhanced MET1 protein levels are subject to degradation (S5 Fig), MET1 over-expression does not generate co-suppression or protein degradation effects that would resemble amet1mutant. Yet, some of the genes with altered expression inMET1 over-expression lines, have also been reported to be affected inmet1mutants, while other genes with altered expression match genes with modified expression inddm1andhda6mutants. Increased expression correlated with hypomethylation and with an increase in H3K4me3 marks, which may occur either as a consequence of hypomethylation or due to an interaction of MET1 with histone modifier proteins like HDA6. Changes in MET1 levels may affect the stability of complexes to which MET1 and histone modifier functions contribute, altering the
Fig 6. Comparison of expression profiles of genesAT3G01345, AT3G27473, AT3G30720, AT3G30820, AT4G25530 and AT5G34850 in the met1-1 mutant and met1-1 RE. The mean and the standard error are shown for three biological
replicates each tested in three technical replicates. Values on the y-axis represent the fold-difference compared to the control line.
epigenetic state of target loci like some transposable elements, which are jointly activated in
met1andhda6mutants, correlating with H3K4 methylation levels [21].
Alternatively an increase in MET1 levels may cause epigenetic changes at loci that are con-trolled by histone modification without a direct involvement of MET1, if the activity of bind-ing partners like HDA6 [21] is altered by their interaction with MET1, and if this impairs the regulation of the target loci of the binding partner. Stochiometric imbalances can sequester complex partners and disrupt a multiprotein complex into non-functional subassemblies. One of the earliest examples demonstrating this effect is the over-expression of either histone H2A-H2B or histone H3-H4 gene pairs in yeast, which causes aberrant chromosome segrega-tion [58] and which alters transcription due to disturbance of the histone octamer [59] [60]. If a protein with a catalytic function is involved in a multi-protein interaction, over-expression of a catalytically inactive version of the protein is sufficient to disturb interactions with binding partners [61].
While the mechanisms involved inMET1over-expression remain unclear, our data show thatMET1over-expression offers a new strategy to induce variants with novel combinations of epi-alleles. Selective MET1 over-expression may be used to limit epigenetic changes to cer-tain tissue types and potentially to distinct MET1 target loci, which will be especially relevant in species where the induction of epigenetic changes in all plant tissues creates unfavourable phenotypes or lethal effects. Spatial and temporal over-expression of MET1, also offers the opportunity to test if target loci alter their susceptibility toMET1over-expression in different tissue types, developmental stages and/or under specific growth or stress conditions.
Conclusions
Epigenetic states contribute to the variation in gene expression and phenotypes in plants. A temporary increase in levels of DNA methyltransferase MET1 induces heritable epigenetic changes at specific loci. Over-expression ofMET1provides a new tool to generate novel epi-alleles, and to identify and analyse epigenetic target loci and phenotypes.MET1 expres-sion serves as a proof-of-concept study that should stimulate a wider application of over-expressing epigenetic regulator genes to examine the significance and targets of epigenetic reg-ulation in different species.
Supporting information
S1 Fig. Comparison ofMET1 expression levels in wildtype, in MET1 transformants (+), in lines derived fromMET1 transformants, from which the transgene has been removed (-).
In A1+ and I2+, MET1 expression is about 3-fold higher compared to wildtype. In A2+ and I1 +, MET1 levels increase are about 15-fold compared to wildtype.
(PDF)
S2 Fig. Phenotypic analysis of MET1 transformants with (+) and without the transgene (-).
A) Primary root length at four weeks of development. B) Number of secondary roots greater than 2mm per mm of primary root length, at four weeks of development. C) Bolting time was analysed by counting the number of basal rosette leaves upon bolting. The parameter used to determine when bolting had occurred was defined, as the stem reaching a minimum of 1 cm in vertical height, for a basal rosette leaf to be counted in the study the leaf had to be at least 1 cm in length and 0.5cm in width. The significance of a change from wildtype is indicated by asterisks (if present):= P<0.05,= P<0.01= P<0.005, calculated by Student’s
S3 Fig. Genes with dense DNA methylation patterns in the genic region (AT3G01345), in the upstream region (AT3G27473 and AT5G34850) and in the gene and its surrounding region (AT3G30720). Boxes label sections that were analysed by bisulphite sequencing
(Fig 3). (PDF)
S4 Fig. Deletions upstream ofAT5G34850 in MET1 transformants. A) Region of the AT5G34850locus, which was mapped using four different primer pairs (Pp1-Pp4). B) PCR analysis ofAT5G34850regions inMET1transformants (+) and in lines derived fromMET1
transformants, from which the transgene has been removed (-). A lines express a catalytically activeMET1transgene, I lines express a catalytically inactive MET transgene. Actin was used as an internal reference for DNA concentrations. Lack of PCR fragments in some lines indi-cates absence of at least one of the primer pairs.
(PDF)
S5 Fig. Analysis of a recombinant FLAG-tagged MET1 shows no indication for MET1 instability. To assess if increasing the amount of MET1 protein induced protein degradation,
a Western blot was carried out for a 35S-FLAG-MET1transformant and a wild type control. The expected size of the FLAG-tagged MET1 protein is 176 kDa. Actin (40 kDa) was used as an internal control for protein concentration. An unspecific ~50kDa protein is present in both samples.
(PDF)
S1 Table. List of genes with altered transcript levels in line A1+.
(PDF)
S2 Table. List of genes with altered transcript levels in line A1-.
(PDF)
S3 Table. List of genes with altered transcript levels in line A2+.
(PDF)
S4 Table. List of genes with altered transcript levels in line A2-.
(PDF)
S5 Table. List of transposable elements with at least log2-fold increases (negative log2-fold change) or decreases (positive log2-fold change) of 2.5 in at least one of the four lines A1+, A1-, A2+ or A2-.
(PDF)
S6 Table. List of non-coding RNAs with at least log2-fold increases (negative log2-fold change) or decreases (positive log2-fold change) of 2.5 in at least one of the four lines A1+, A1-, A2+ or A2-.
(PDF)
S7 Table. List of coding genes at least log2-fold increases (negative log2-fold change) or decreases (positive log2-fold change) of 2.5 in at least one of the four lines A1+, A1, A2+ or A2-.
(PDF)
S8 Table. List of primers.
Acknowledgments
SB was supported by a BBSRC CASE studentship.
Author Contributions
Conceptualization: Peter Meyer.
Data curation: Ian M. Carr.
Funding acquisition: Peter Meyer.
Investigation: Samuel Brocklehurst.
Methodology: Samuel Brocklehurst, Michael Watson, Suzan Out, Iris Heidmann.
Project administration: Peter Meyer.
Resources: Iris Heidmann.
Software: Ian M. Carr.
Supervision: Peter Meyer.
Validation: Samuel Brocklehurst, Ian M. Carr.
Writing – original draft: Samuel Brocklehurst.
Writing – review & editing: Peter Meyer.
References
1. Huettel B, Kanno T, Daxinger L, Bucher E, van der Winden J, Matzke AJM, et al. RNA-directed DNA methylation mediated by DRD1 and Pol IVb: A versatile pathway for transcriptional gene silencing in plants. Biochimica et Biophysica Acta (BBA)—Gene Structure and Expression. 2007; 1769(5–6):358– 74.
2. Yao Y, Bilichak A, Golubov A, Kovalchuk I. ddm1 plants are sensitive to methyl methane sulfonate and NaCl stresses and are deficient in DNA repair. Plant Cell Reports. 2012; 31(9):1549–61.https://doi.org/ 10.1007/s00299-012-1269-1PMID:22538524
3. Mirouze M, Lieberman-Lazarovich M, Aversano R, Bucher E, Nicolet J, Reinders J, et al. Loss of DNA methylation affects the recombination landscape in Arabidopsis. Proceedings of the National Academy of Sciences. 2012; 109(15):5880–5.https://doi.org/10.1073/pnas.1120841109PMID:22451936
4. Finnegan EJ, Peacock WJ, Dennis ES. Reduced DNA methylation in Arabidopsis thaliana results in abnormal plant development. Proceedings of the National Academy of Sciences. 1996; 93:8449–54. 5. Kato M, Miura A, Bender J, Jacobsen SE, Kakutani T. Role of CG and Non-CG Methylation in
Immobili-zation of Transposons in Arabidopsis. Current Biology. 2003; 13(5):421. PMID:12620192
6. Lopez-Maury L, Marguerat S, Bahler J. Tuning gene expression to changing environments: from rapid responses to evolutionary adaptation. Nat Rev Genet. 2008; 9(8):583–93.https://doi.org/10.1038/ nrg2398PubMed PMID: WOS:000257758400009. PMID:18591982
7. Finnegan EJ. Epialleles—a source of random variation in times of stress. Current Opinion in Plant Biol-ogy. 2002; 5(2):101–6. PubMed PMID: ISI:000174097000003. PMID:11856603
8. Kou HP, Li Y, Song XX, Ou XF, Xing SC, Ma J, et al. Heritable alteration in DNA methylation induced by nitrogen-deficiency stress accompanies enhanced tolerance by progenies to the stress in rice (Oryza sativa L.). Journal of Plant Physiology. 2011; 168(14):1685–93.https://doi.org/10.1016/j.jplph.2011.03. 017PMID:21665325
9. Boyko A, Kathiria P, Zemp FJ, Yao Y, Pogribny I, Kovalchuk I. Transgenerational changes in the genome stability and methylation in pathogen-infected plants: (Virus-induced plant genome instability). Nucleic Acids Research. 2007; 35(5):1714–25.https://doi.org/10.1093/nar/gkm029PMID:17311811
10. Kovarik A, Koukalova´ B, Bezdek M, Opatrn Z. Hypermethylation of tobacco heterochromatic loci in response to osmotic stress. Theor Appl Genet. 1997; 95(1–2):301–6.https://doi.org/10.1007/ s001220050563
nature/journal/v480/n7376/abs/nature10555.html#supplementary-information.https://doi.org/10.1038/ nature10555PMID:22057020
12. O’Malley RC, Ecker JR. Epiallelic Variation in Arabidopsis thaliana. Cold Spring Harbor Symposia on Quantitative Biology. 2012; 77:135–45.https://doi.org/10.1101/sqb.2012.77.014571PMID:23223383
13. Jackson JP, Lindroth AM, Cao X, Jacobsen SE. Control of CpNpG DNA methylation by the KRYPTO-NITE histone H3 methyltransferase. Nature. 2002; 416(6880):556.https://doi.org/10.1038/nature731
PMID:11898023
14. Cao X, Aufsatz W, Zilberman D, Mette MF, Huang MS, Matzke M, et al. Role of the DRM and CMT3 Methyltransferases in RNA-Directed DNA Methylation. Current Biology. 2003; 13(24):2212–7. PMID:
14680640
15. Matzke M, Kanno T, Daxinger L, Huettel B, Matzke AJM. RNA-mediated chromatin-based silencing in plants. Current Opinion in Cell Biology. 2009; 21(3):367–76.https://doi.org/10.1016/j.ceb.2009.01.025
PMID:19243928
16. Law JA, Ausin I, Johnson LM, Vashisht AA, Zhu J-K, Wohlschlegel JA, et al. A Protein Complex Required for Polymerase V Transcripts and RNA- Directed DNA Methylation in Arabidopsis. Current Biology. 2010;In Press, Corrected Proof.https://doi.org/10.1016/j.cub.2010.03.062PMID:20409711
17. Zemach A, Kim MY, Hsieh P-H, Coleman-Derr D, Eshed-Williams L, Thao K, et al. The Arabidopsis Nucleosome Remodeler DDM1 Allows DNA Methyltransferases to Access H1-Containing Heterochro-matin. Cell. 2013; 153(1):193–205.https://doi.org/10.1016/j.cell.2013.02.033PMID:23540698
18. Schmitz RJ, Schultz MD, Urich MA, Nery JR, Pelizzola M, Libiger O, et al. Patterns of population epige-nomic diversity. Nature. 2013; 495(7440):193–8.http://www.nature.com/nature/journal/v495/n7440/ abs/nature11968.html#supplementary-information.https://doi.org/10.1038/nature11968PMID:
23467092
19. Singh A, Zubko E, Meyer P. Co-operative activity of DNA methyltransferases for maintenance of sym-metrical and non-symsym-metrical cytosine methylation in Arabidopsis thaliana. Plant Journal. 2008; 56:814–23.https://doi.org/10.1111/j.1365-313X.2008.03640.xPMID:18665914
20. Watson M, Hawkes E, Meyer P. Transmission of Epi-Alleles with MET1-Dependent Dense Methylation in Arabidopsis thaliana. PLoS ONE. 2014; 9(8):e105338.https://doi.org/10.1371/journal.pone.0105338
PMID:25137154
21. Liu X, Yu C-W, Duan J, Luo M, Wang K, Tian G, et al. HDA6 Directly Interacts with DNA Methyltransfer-ase MET1 and Maintains Transposable Element Silencing in Arabidopsis. Plant Physiology. 2012; 158 (1):119–29.https://doi.org/10.1104/pp.111.184275PMID:21994348
22. To TK, Kim J-M, Matsui A, Kurihara Y, Morosawa T, Ishida J, et al. Arabidopsis HDA6 Regulates Locus-Directed Heterochromatin Silencing in Cooperation with MET1. PLoS Genet. 2011; 7(4): e1002055.https://doi.org/10.1371/journal.pgen.1002055PMID:21552333
23. Stroud H, Greenberg Maxim VC, Feng S, Bernatavichute Yana V, Jacobsen Steven E. Comprehensive Analysis of Silencing Mutants Reveals Complex Regulation of the Arabidopsis Methylome. Cell. 2013; 152(1–2):352–64.https://doi.org/10.1016/j.cell.2012.10.054PMID:23313553
24. Clough SJ, Bent AF. Floral dip: a simplified method forAgrobacterium-mediated transformation ofArabi-dopsis thaliana. The Plant Journal. 1998; 16(6):735–43.https://doi.org/10.1046/j.1365-313x.1998. 00343.xPMID:10069079
25. Zubko E, Gentry M, Kunova A, Meyer P. De novo DNA methylation activity of METHYLTRANSFERASE 1 (MET1) partially restores body methylation in Arabidopsis thaliana. The Plant Journal. 2012; 71 (6):1029–37.https://doi.org/10.1111/j.1365-313X.2012.05051.xPMID:22587613
26. Hsieh C-L. In Vivo Activity of Murine De Novo Methyltransferases, Dnmt3a and Dnmt3b. Molecular and Cellular Biology. 1999; 19(12):8211–8. PMID:10567546
27. Dobin A, Davis CA, Schlesinger F, Drenkow J, Zaleski C, Jha S, et al. STAR: ultrafast universal RNA-seq aligner. Bioinformatics. 2013; 29(1):15–21.https://doi.org/10.1093/bioinformatics/bts635PubMed PMID: PMC3530905. PMID:23104886
28. Liao Y, Smyth GK, Shi W. The Subread aligner: fast, accurate and scalable read mapping by seed-and-vote. Nucleic Acids Research. 2013; 41(10):e108–e.https://doi.org/10.1093/nar/gkt214PubMed PMID: PMC3664803. PMID:23558742
29. Love MI, Huber W, Anders S. Moderated estimation of fold change and dispersion for RNA-seq data with DESeq2. Genome Biology. 2014; 15(12):550.https://doi.org/10.1186/s13059-014-0550-8PMID:
25516281
30. Dellaporta SL, Wood J, Hicks JB. A plant DNA minipreparation: version II. Plant Molecular Biology Reporter 1983; 4:19–21.
32. Hetzl J, Foerster AM, Raidl G, Scheid OM. CyMATE: a new tool for methylation analysis of plant geno-mic DNA after bisulphite sequencing. The Plant Journal. 2007; 51(3):526–36.https://doi.org/10.1111/j. 1365-313X.2007.03152.xPMID:17559516
33. Virdi KS, Laurie JD, Xu Y-Z, Yu J, Shao M-R, Sanchez R, et al. Arabidopsis MSH1 mutation alters the epigenome and produces heritable changes in plant growth. 2015; 6:6386.https://doi.org/10.1038/ ncomms7386 https://www.nature.com/articles/ncomms7386#supplementary-information. PMID:
25722057
34. Kakutani T, Jeddeloh JA, Flowers SK, Munakata K, Richards EJ. Developmental abnormalities and epi-mutations associated with DNA hypomethylation epi-mutations. Proceedings of the National Academy of Sciences. 1996; 93(22):12406–11.https://doi.org/10.1073/pnas.93.22.12406
35. Wu K, Zhang L, Zhou C, Yu C-W, Chaikam V. HDA6 is required for jasmonate response, senescence and flowering in Arabidopsis. Journal of Experimental Botany. 2008; 59(2):225–34.https://doi.org/10. 1093/jxb/erm300PMID:18212027
36. Finnegan EJ, Genger RK, Kovac K, Peacock WJ, Dennis ES. DNA methylation and the promotion of flowering by vernalization. Proceedings of the National Academy of Sciences. 1998; 95(10):5824–9. 37. Saze H, Scheid OM, Paszkowski J. Maintenance of CpG methylation is essential for epigenetic
inheri-tance during plant gametogenesis. Nat Genet. 2003; 34(1):65–9.https://doi.org/10.1038/ng1138PMID:
12669067
38. Kankel MW, Ramsey DE, Stokes TL, Flowers SK, Haag JR, Jeddeloh JA, et al. Arabidopsis MET1 Cytosine Methyltransferase Mutants. Genetics. 2003; 163(3):1109–22. PMID:12663548
39. Cowan RK, Hoen DR, Schoen DJ, Bureau TE. MUSTANG Is a Novel Family of Domesticated Transpo-sase Genes Found in Diverse Angiosperms. Molecular Biology and Evolution. 2005; 22(10):2084–9.
https://doi.org/10.1093/molbev/msi202PMID:15987878
40. Catoni M, Griffiths J, Becker C, Zabet NR, Bayon C, Dapp M, et al. DNA sequence properties that pre-dict susceptibility to epiallelic switching. The EMBO Journal. 2017; 36(5):617–28.https://doi.org/10. 15252/embj.201695602PMID:28069706
41. Johannes F, Porcher E, Teixeira FK, Saliba-Colombani V, Simon M, Agier N, et al. Assessing the Impact of Transgenerational Epigenetic Variation on Complex Traits. PLoS Genet. 2009; 5(6): e1000530. Epubhttp://journals.plos.org/plosgenetics/article?id https://doi.org/10.1371/journal.pgen. 1000530PMID:19557164
42. Johannes F, Colome´-Tatche´ M. Quantitative Epigenetics Through Epigenomic Perturbation of Isogenic Lines. Genetics. 2011; 188(1):215–27.https://doi.org/10.1534/genetics.111.127118PMID:21385727
43. Miura A, Yonebayashi S, Watanabe K, Toyama T, Shimada H, Kakutani T. Mobilization of transposons by a mutation abolishing full DNA methylation in Arabidopsis. Nature. 2001; 411(6834):212–4.https:// doi.org/10.1038/35075612PMID:11346800
44. Kato M, Takashima K, Kakutani T. Epigenetic Control of CACTA Transposon Mobility in Arabidopsis thaliana. Genetics. 2004; 168(2):961–9.https://doi.org/10.1534/genetics.104.029637PMID:15514067
45. Tsukahara S, Kobayashi A, Kawabe A, Mathieu O, Miura A, Kakutani T. Bursts of retrotransposition reproduced in Arabidopsis. Nature. 2009; 461(7262):423.https://doi.org/10.1038/nature08351PMID:
19734880
46. Rangwala SH, Richards EJ. Differential Epigenetic Regulation Within an Arabidopsis Retroposon Fam-ily. Genetics. 2007; 176(1):151–60.https://doi.org/10.1534/genetics.107.071092PMID:17339215
47. Kinoshita T, Miura A, Choi Y, Kinoshita Y, Cao X, Jacobsen SE, et al. One-Way Control of FWA Imprint-ing in Arabidopsis Endosperm by DNA Methylation. Science. 2004; 303(5657):521–3.https://doi.org/ 10.1126/science.1089835PMID:14631047
48. Soppe WJJ, Jacobsen SE, Alonso-Blanco C, Jackson JP, Kakutani T, Koornneef M, et al. The Late Flowering Phenotype of fwa Mutants Is Caused by Gain-of-Function Epigenetic Alleles of a Homeodo-main Gene. Molecular Cell. 2000; 6(4):791. PMID:11090618
49. Lippman Z, Gendrel A-V, Black M, Vaughn MW, Dedhia N, Richard McCombie W, et al. Role of trans-posable elements in heterochromatin and epigenetic control. Nature. 2004; 430(6998):471.https://doi. org/10.1038/nature02651PMID:15269773
50. Silveira AB, Trontin C, Cortijo S, Barau J, Del Bem LEV, Loudet O, et al. Extensive Natural Epigenetic Variation at a De Novo Originated Gene. PLoS Genet. 2013; 9(4):e1003437.https://doi.org/10.1371/ journal.pgen.1003437PMID:23593031
51. To TK, Nakaminami K, Kim J-M, Morosawa T, Ishida J, Tanaka M, et al. Arabidopsis HDA6 is required for freezing tolerance. Biochemical and Biophysical Research Communications. 2011; 406(3):414–9.
52. Baev V, Naydenov M, Apostolova E, Ivanova D, Doncheva S, Minkov I, et al. Identification of RNA-dependent DNA-methylation regulated promoters in Arabidopsis. Plant Physiology and Biochemistry. 2010; 48(6):393–400.https://doi.org/10.1016/j.plaphy.2010.03.013PMID:20400323
53. Naydenov M, Baev V, Apostolova E, Gospodinova N, Sablok G, Gozmanova M, et al. High-temperature effect on genes engaged in DNA methylation and affected by DNA methylation in Arabidopsis. Plant Physiology and Biochemistry. 2015; 87:102–8.https://doi.org/10.1016/j.plaphy.2014.12.022PMID:
25576840
54. Durut N, Abou-Ellail M, Pontvianne F, Das S, Kojima H, Ukai S, et al. A Duplicated NUCLEOLIN Gene with Antagonistic Activity Is Required for Chromatin Organization of Silent 45S rDNA in Arabidopsis. The Plant Cell. 2014; 26(3):1330–44.https://doi.org/10.1105/tpc.114.123893PMID:24668745
55. Paszkowski J, Grossniklaus U. Selected aspects of transgenerational epigenetic inheritance and reset-ting in plants. Current Opinion in Plant Biology. 2011; 14(2):195–203.https://doi.org/10.1016/j.pbi.2011. 01.002PMID:21333585
56. Weigel D, Colot V. Epialleles in plant evolution. Genome Biology. 2012; 13(10):249.https://doi.org/10. 1186/gb-2012-13-10-249PMID:23058244
57. Elgin SCR, Reuter G. Position-Effect Variegation, Heterochromatin Formation, and Gene Silencing in Drosophila. Cold Spring Harbor Perspectives in Biology. 2013; 5(8).https://doi.org/10.1101/ cshperspect.a017780PMID:23906716
58. Meeks-Wagner D, Hartwell LH. Normal stoichiometry of histone dimer sets is necessary for high fidelity of mitotic chromosome transmission. Cell. 1986; 44(1):43–52.http://dx.doi.org/10.1016/0092-8674(86) 90483-6. PMID:3510079
59. Clark-Adams CD, Winston F. The SPT6 gene is essential for growth and is required for delta-mediated transcription in Saccharomyces cerevisiae. Molecular and Cellular Biology. 1987; 7(2):679–86.https:// doi.org/10.1128/mcb.7.2.679PMID:3029564
60. Clark-Adams CD, Norris D, Osley MA, Fassler JS, Winston F. Changes in histone gene dosage alter transcription in yeast. Genes & Development. 1988; 2(2):150–9.https://doi.org/10.1101/gad.2.2.150