This is a repository copy of Destructive and non-destructive testing methods for characterization and detection of machining induced white layer: A review paper. White Rose Research Online URL for this paper:
http://eprints.whiterose.ac.uk/136777/ Version: Accepted Version
Article:
Brown, M., Wright, D., M'Saoubi, R. et al. (5 more authors) (2018) Destructive and non-destructive testing methods for characterization and detection of machining induced white layer: A review paper. CIRP Journal of Manufacturing Science and Technology. ISSN 1755-5817
https://doi.org/10.1016/j.cirpj.2018.10.001
Article available under the terms of the CC-BY-NC-ND licence (https://creativecommons.org/licenses/by-nc-nd/4.0/).
[email protected] https://eprints.whiterose.ac.uk/ Reuse
This article is distributed under the terms of the Creative Commons Attribution-NoDerivs (CC BY-ND) licence. This licence allows for redistribution, commercial and non-commercial, as long as it is passed along
unchanged and in whole, with credit to the original authors. More information and the full terms of the licence here: https://creativecommons.org/licenses/
Takedown
If you consider content in White Rose Research Online to be in breach of UK law, please notify us by
*Corresponding author [email protected]
Destructive and non-destructive testing methods for
characterization and detection of machining-induced white layer: A
review paper
M.Browna,h, D.Wrightb ‘ M “ c, J.McGourlayd, M.Wallise, A.Mantlef, P. Crawforthg, H.Ghadbeigih
a Industrial Doctoral Centre in Machining Science, Advanced Manufacturing Research Centre with Boeing, University of Sheffield, Rotherham, S60 5TZ, UK
b Non-Destructive Evaluation, Rolls Royce PLC, Derby, UK
c Materials & Technology development, Seco Tools AB, SE73782 Fagersta, Sweden d Rolls Royce PLC
e Rolls Royce PLC, Barnoldswick, UK
f Manufacturing Technology, Rolls Royce PLC, Derby, UK
g Advanced Manufacturing Research Centre with Boeing, University of Sheffield, Rotherham, S60 5TZ, UK
h The University of Sheffield department of Mechanical Engineering, Sir Frederick Mappin Building, Mappin Street, S1 3JD, Sheffield, UK
Keywords: White layer, Surface integrity, Non-destructive testing, Machining, Gas turbine materials
Abstract
The presence of machining-induced white layer in the near-surface of critical aeroengine alloys has a detrimental effect on the lifetime of a component. Present techniques for identifying and characterizing white layer, such as optical microscopy and hardness testing, whilst effective, are destructive, costly and time-consuming. Non-destructive testing methods may, therefore, offer improvements to the process of white layer detection. This paper discusses the formation mechanisms and the defining physical properties of machining-induced white layers before offering a comprehensive review of the current state-of-the-art in both destructive and non-destructive testing methods for detecting this anomalous surface feature.
Introduction
It is widely acknowledged that the surface integrity of a machined component has a significant effect on its performance, reliability and life (Grzesik et al., 2010, Guo et al., 2010, Choi, 2010, Herbert et al., 2014). In this context, the surface inspection of parts used in critical applications, for example within an aerospace gas turbine engine, is a vital step in the validation of the manufacturing process.
[Type here]
as well as the appropriate methodology for measuring, recording and assessing surface integrity.
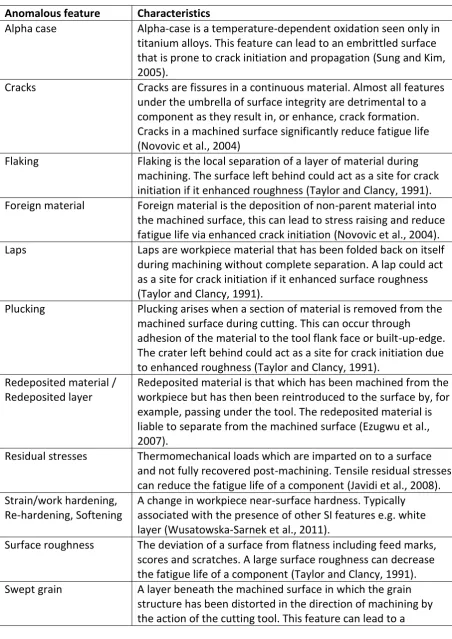
Table 1. Surface integrity features
Anomalous feature Characteristics
Alpha case Alpha-case is a temperature-dependent oxidation seen only in titanium alloys. This feature can lead to an embrittled surface that is prone to crack initiation and propagation (Sung and Kim, 2005).
Cracks Cracks are fissures in a continuous material. Almost all features under the umbrella of surface integrity are detrimental to a component as they result in, or enhance, crack formation. Cracks in a machined surface significantly reduce fatigue life (Novovic et al., 2004)
Flaking Flaking is the local separation of a layer of material during machining. The surface left behind could act as a site for crack initiation if it enhanced roughness (Taylor and Clancy, 1991). Foreign material Foreign material is the deposition of non-parent material into
the machined surface, this can lead to stress raising and reduce fatigue life via enhanced crack initiation (Novovic et al., 2004). Laps Laps are workpiece material that has been folded back on itself
during machining without complete separation. A lap could act as a site for crack initiation if it enhanced surface roughness (Taylor and Clancy, 1991).
Plucking Plucking arises when a section of material is removed from the machined surface during cutting. This can occur through
adhesion of the material to the tool flank face or built-up-edge. The crater left behind could act as a site for crack initiation due to enhanced roughness (Taylor and Clancy, 1991).
Redeposited material / Redeposited layer
Redeposited material is that which has been machined from the workpiece but has then been reintroduced to the surface by, for example, passing under the tool. The redeposited material is liable to separate from the machined surface (Ezugwu et al., 2007).
Residual stresses Thermomechanical loads which are imparted on to a surface and not fully recovered post-machining. Tensile residual stresses can reduce the fatigue life of a component (Javidi et al., 2008). Strain/work hardening,
Re-hardening, Softening
A change in workpiece near-surface hardness. Typically associated with the presence of other SI features e.g. white layer (Wusatowska-Sarnek et al., 2011).
Surface roughness The deviation of a surface from flatness including feed marks, scores and scratches. A large surface roughness can decrease the fatigue life of a component (Taylor and Clancy, 1991). Swept grain A layer beneath the machined surface in which the grain
[Type here]
reduction in fatigue life (Herbert et al., 2014), large residual stresses (Velásquez et al., 2010) and work hardening (Mantle and Aspinwall, 1997).
Twinning Re-orientation of the crystal lattice to facilitate deformation via slip during machining. Twins have been shown to act as sites for fatigue damage (Beevers and Halliday, 1969).
White layer A layer immediately beneath the machined surface in which the grain structure cannot be resolved at a magnification which facilitates the resolution of the bulk microstructure. White layer formation can reduce fatigue life (Guo et al., 2010), lead to an embrittled surface (Guo and Ammula, 2005), cause large residual stresses (Kwong et al., 2009) and result in a hardened region (Akcan et al., 2002).
The recommended data requirements for the best assessment of SI in machined parts are outlined in Table 2. The requirements were defined by Koster et al. (1970) and modified by ANSI (1986). Whilst numerous studies have been undertaken to investigate SI for specific materials and machining processes, more comprehensive studies include tho M “ et al. (2008) and Jawahir et al. (2011).
Table 2. The recommended surface integrity data set for assessing surface integrity (ANSI, 1986) and the specific feature or useful information that can be observed or obtained from the data.
Data acquired Information obtained
Surface topography roughness measurement, topographical imaging
Surface contacting methods can be used to measure roughness (Ra, Rz) but non-contacting optical profilometers can also identify surface imperfections such as laps, flaking and plucking. Macrostructure images of the surface (low
magnification <10x) etch indentations and large surface imperfections
Laps, flaking, plucking, redeposited material, foreign material
Cross-sectional microstructure images (high magnification >10x) Surface drag, white layer, small surface imperfections, phase transformations, microcracks, re-deposited material
White layer, swept grain, alpha-case, laps, flaking, plucking, redeposited material, cracks, foreign material
Cross-sectional microhardness measurements Work-hardening or softening of the near-surface region
Profile of residual stress with depth Residual stress in the machined surface compared to the bulk
Fatigue tests of samples Low and high cycle fatigue life
[Type here]
addition to uncertainty around the formation mechanisms and imposed machining conditions which generate this anomalous feature in different materials. Typically, white layer in aeroengine materials has been characterized as being a region of ultra-fine grain size (Barry and Byrne, 2002) that is often associated with high hardness (Wusatowska-Sarnek et al., 2011), high brittleness (Guo and Ammula, 2005) and extremes of residual stress (Kwong et al., 2009).
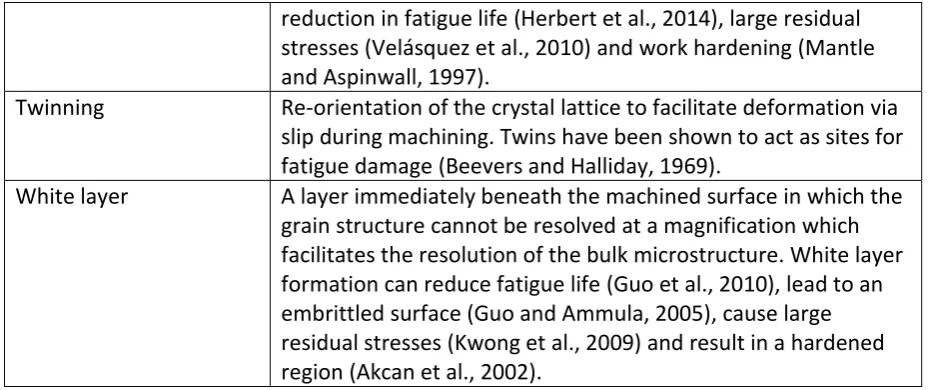
In industry, white layer is typically defined as a region at the machined surface, in the cross-section, in which the microstructure cannot be distinguished at a magnification which allows the bulk microstructure to be easily resolved, as demonstrated in Figure 1. The white appearance of this region has traditionally been attributed to an increased resistance to etching relative to the bulk material (Griffiths, 1987, Chou and Evans, 1999), which means the grain structure is not revealed in the white layer. More recently, it has been proposed that the scattering of the incident light used to illuminate the sample during subsequent optical microscopy inspection in the cross-section, results in the appearance of the white layer (Akcan et al., 2002). Due to its comparatively larger wavelength, white light is thought to be scattered from the small diameter grains in the white layer, resulting in a featureless layer. Although white layers are typically 1-
observed in extreme cases (Wusatowska-Sarnek et al., 2011).
Figure 1. A 25 µm white layer in milled Ti-6Al-4V (Cutting speed = 40 m/min, axial depth of cut =
VB T A
own obtained through optical microscopy of an etched titanium sample.
It has been reported (Herbert et al., 2014) that the presence of a 10 µm white layer severely reduces the fatigue life of a drilled part, by as much as 30 times compared a drilled sample with no white layer. Even after shot-peening a drilled surface with white layer, the fatigue life was still 10 times lower than the benchmark life. Additionally, the rolling contact fatigue life has been measured to be reduced by 80% or more when white layers between 7 µm and 14 µm in thickness are present in steel (Guo et al., 2010, Choi, 2010). This reduction is predicted to be due to reductions in both crack initiation life (75%) and crack propagation life (89 %) (Choi, 2010). Herbert et al. (2014) reported that a tensile residual stress in the white layer facilitates the initiation of fatigue cracks, at the surface of the part, during cyclic loading and the propagation rate is greatly accelerated by the nanoscale grains in the white layer. Additionally, micro-cracks observed within the white layer have been predicted (Herbert et
[Type here]
al., 2014) to result in greater crack propagation rates during low cycle fatigue when fatigue cracks merge with microcracks.
White layers have been identified in turned (Ramesh et al., 2005), milled (Wusatowska-Sarnek et al., 2011), drilled (Herbert et al., 2011), broached (Chen et al., 2017) and electrical discharge machined surfaces (Hosseini et al., 2012a). Additionally, this SI feature is not exclusively seen in machining, it is also found in worn rail tracks (Lojkowski et al., 2001, Pan et al., 2017), ballistic impacts (Zhang et al., 1997) and high velocity shaping and forming (Rogers, 1979). Currently, the presence of a white layer is successfully identified through destructive evaluation. In industry, this is primarily through optical microscopy of the machined surface cross-section, which is both costly and time-consuming. At present, there is no widely researched and truly non-destructive testing (NDT) method for reliably detecting the presence of a white layer in different machined surfaces. Conventional NDT techniques such as dye penetrant inspection and magnetic particle inspection offer no solution as there is no surface breaking or sub-surface discontinuity (Hardy et al., 2014). More advanced and novel techniques must therefore be investigated.
This research identifies the current state-of-the-art on the mechanisms of white layer formation in aerospace gas turbine materials and the physical properties of this anomalous surface feature. Following this, the principles behind viable NDT techniques that could facilitate detection of a white layer are discussed in order to determine potential approaches to fill the gap in this field of knowledge.
Machining-induced white layer
Formation mechanisms
[Type here]
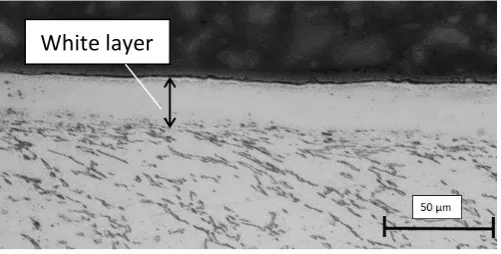
Figure 2. Schematic highlighting the primary, secondary and tertiary shear zones during cutting, after (Groover, 2007).
High temperatures and rapid cooling rates can result in a phase transformation of the near-surface region of metallics during machining. Heat is generated during mechanical cutting operations such as turning and milling due to severe plastic deformation (SPD) of the workpiece and considerable frictional contact conditions caused by the cutting tool-workpiece interaction. SPD occurs in the primary, secondary and tertiary shear zones, as outlined in Figure 2, with the direct effect of the tertiary shear zone on the machined surface immediately apparent. Guo et al. (2011) showed, using particle image velocimetry, that the deformation effect of the primary shear zone extends into the workpiece such that material that does not form part of the chip is still deformed in a fan-shaped deformation zone in front of the tool. It is, therefore, appropriate to consider that the primary shear zone, in addition to the tertiary shear zone situated at the tool and workpiece surface interface, may affect the workpiece surface integrity.
[Type here]
as shown by Hosseini et al. (2015). In steels it is suggested (Akcan et al., 2002, Warren et al., 2006) that there may be a softened layer, often termed dark layer, beneath the hardened white layer that is the result of thermal softening. Dark layers have only been shown to be found beneath white layers formed from the phase transformation mechanism (Hosseini et al., 2012b).
Within the remaining material adjacent to the machined surface, Griffiths (1987) suggests that a shear deformation occurs due to the action of the cutting tool. This action leads to fragmentation of the grains in the near-surface, which results in the refined grain structure present in the white layer. F G hypothesis, Poulachon et al. (2005) propose that white layer formation through grain refinement is a two-step process. Initially, dislocations pile-up within grains due to SPD and this results in regions of high dislocation density. In-turn, this facilitates the formation of new grain boundaries within the original grains. Several studies (Barry and Byrne, 2002, Wusatowska-Sarnek et al., 2011) refer to this white layer formation mechanism as SPD plus dynamic recovery and it has been observed in the machining of steels (Ramesh et al., 2005), nickel superalloys (Herbert et al., 2011) and titanium alloys (Edkins et al., 2014).
The influence of machining parameters on the white layer formation in aeroengine
materials
White layer formation is fundamentally dependent on the thermal and mechanical effects of machining on the workpiece material. These effects are dictated by the interaction of the cutting tool and the workpiece material which is strongly influenced by the imposed cutting parameters. It has been shown that the tendency for the formation of a white layer is increased significantly by raising the cutting speed, using improper cooling, under lubrication of the cutting operation and by the wearing out of the cutting tool (Caruso et al., 2011, Bushlya et al., 2011).
[Type here]
Early surface integrity research (Koster et al., 1970, Koster et al., 1972) found that abusive cutting conditions, particularly the use of tools with high wear, results in the formation of a white layer during milling of AISI 430 steel and Ti-6Al-6V-2Sn. Similar results have since been reported for other titanium, nickel and steel alloys and these are discussed as follows. In Ti-6Al-4V, it has been shown (Che-Haron and Jawaid, 2005, Ibrahim et al., 2009) that white layers are formed at the end of tool life, during turning, when the average flank wear is 0.2 mm or greater, due to enhanced plastic deformation of the workpiece. Puerta Velasquez et al. (2010) reported the presence of a layer in turned Ti-6Al-4V which was likened to white layers observed in other studies. However, from the evidence provided it appears that the layer formed at low speed (20 m/min) was simply a region of high grain distortion. This is because the microstructure is resolvable at all locations in the images provided, by contrast, the layer formed at 260 m/min may be white layer as the structure is harder to resolve. This uncertainty in the identification of white layer from microscopy is common, possibly due to a lack of a unified definition. Another factor which indicates this layer formed at 20 m/min was not, in fact, a white layer is that it was generated at low cutting speeds. This is a trend contrary to the majority of research into white layers but one that is often indicative of swept grains (Crawforth et al., 2012).
For nickel superalloys, specifically RR1000, it has been reported (Kwong et al., 2009, Herbert et al., 2011) that white layers can be generated using abusive drilling conditions, a high metal removal rate and a large average flank wear. A similar observation has been made when turning Inconel-718 (Bushlya et al., 2011) where it was reported that white layer was only formed once tool wear levels greater than 0.15 mm were reached and cutting speeds were high (300-400 m/min).
[Type here]
White layers are readily formed during machining of steels and it has been reported (Chou and Evans, 1999, Hosseini et al., 2012a, Fang-yuan et al., 2017, Arfaoui et al., 2018) that, once again, white layer thickness increases with cutting speed and tool wear. However, Hosseini et al. (2012b) measured that the effect of flank wear was greater than cutting speed over the full range of speeds investigated (30-260 m/min). The temperatures reached when machining steels are critical to the surface integrity due to the effect on the phase transformation mechanism of white layer formation. This is evidenced by the tendency to produce white layers through phase transformation when high speed machining is used (Fang-yuan et al., 2017). Cryogenic cooling during machining has been shown to reduce the thickness of a white layer (Umbrello et al., 2011), it is proposed that this is due to a significant reduction in the microstructural transformation resulting from the lower temperatures experienced during cutting (Umbrello, 2013). Despite the reduction in white layers formed by phase transformation, formation due to SPD was still observed at different cutting parameters. It has been reported (Ramesh et al., 2005, Hosseini et al., 2012b) that the white layers formed when machining at high speeds are a result of austenization followed by martensitic phase transformation during cooling. By contrast, the temperatures reached during cutting at lower speeds are not sufficient for austenization, so white layers form due to grain refinement from SPD. In both SPD and phase transformation layers in steels it has been proven (Hosseini et al., 2012a, Hosseini et al., 2014b) that carbide dissolution does not occur. This is due to the small amount of time the workpiece material is at high temperatures.
The effect of cryogenic cooling on white layer formation in titanium alloys and nickel superalloys is less well documented but it is predicted that the impact may be less significant than in steels. This is due to the lack of temperature-dependent phase transformations seen in the white layers of these alloys even when cutting at high speeds (Velásquez et al., 2010, Herbert et al., 2011). Additionally, the effect of cryogenic cooling may reduce white layer formation due to the SPD mechanism. It has been shown (Lee and Lin, 1998) that for Ti-6Al-4V the work hardening coefficient is greater at a lower temperature. Thus, when machining with cryogenic cooling, the workpiece material can be expected to more readily work harden and consequently provide a greater resistance to plastic deformation reducing white layer formation.
It should be noted that with the move to high metal removal rate methods within industry, the occurrence of white layers can be expected to increase due to the higher cutting speeds employed. The identification of this anomalous surface feature is therefore critical for optimizing modern machining methods.
Mechanical and microstructural characterization of the white layer
Microscopy observations
[Type here]
(M'Saoubi et al., 2014, Chamanfar et al., 2017) has shown that the white layer is not amorphous and in fact contains nanoscale grains. In TEM, very thin samples are examined by firing electrons through the sample to a detector, the interaction of the transmitted electrons with the sample yields information on the microstructure. TEM can be used to resolve grain structure do (Barry and Byrne, 2002, Herbert et al., 2011), this is 10-100 times greater resolution than can be achieved with conventional optical microscopy. EBSD is a grain orientation measurement technique used in a scanning electron microscope or TEM.
Ultrafine grains have been measured in Nickel superalloy within the white layer using TEM (Herbert et al., 2011, Chamanfar et al., 2017), an observation mirrored in hard turned steel (Barry and Byrne, 2002, Smith et al., 2007). EBSD analysis of the white layer in several nickel superalloys also revealed a fine equiaxed grain structure that is indistinguishable under optical light microscopy (M'Saoubi et al., 2014). Transmission EBSD has been used to show that the white layer formed when turning steels at high cutting speeds (Bedekar et al., 2015) and when broaching nickel superalloys (Chen et al., 2017), has a strong recrystallized texture. This contrasts with the shear texture seen for lower cutting speeds in steels. Once again this highlights the two different white layer formation mechanisms that can be found in steels. At the point of writing there has been no detailed TEM or EBSD investigation into white layers in titanium alloys. This is most likely because the quality of EBSD analysis is significantly affected by lattice strain leading to issues indexing the grains in the white layer (Wright et al., 2011). Additionally, it would not be trivial to isolate a sample of the white layer for TEM analysis.
Nanoindentation measurements
Nanoindentation is a hardness testing technique which facilitates indentation within the white layer whilst still adhering to widely adopted standards for hardness testing such as
ASTM E384 (ASTM, 2012) T
of nanometres and these are obtained through loads that are of the order of 1 mN (Warren et al., 2006, Li et al., 2008).
A major limitation of nanoindentation testing, particularly in titanium alloys, is the
(Tamura et al., 2012))
compared to grain sizes in some aeroengine titanium-alloys (Xun and Tan, 2000). Thus for an array of indents, individual hardness measurements could be occurring in different grains. It has been identified (Moussaoui et al., 2013) in titanium can cause up to a 30% difference in measured values. Not only can hardness vary between different phases but also within different orientations of the same phase. As much as a 30-40% variation in hardness between two differently orientated hexagonal close packed (HCP) -phase grains has been reported (Rugg et al., 2014).
[Type here]
relationship for hardness in the white layer is flipped for high and low cutting speeds due to the difference in the formation mechanism. At low cutting speeds, dislocation hardening was found to be dominant, whereas for higher cutting speeds in steels it was phase transformation which influenced the hardness and grain diameter relationship.
Wusatowska-sarnek et al. (2011) observed that the width of the hardened region corresponded to the width of the white layer obtained from optical microscopy in IN-100 nickel superalloy. In titanium, a hardened surface region has been recorded (Li et al., 2008), this is despite the indentation locations used being too close to the surface with respect to the recommended procedure outlined in ASTM E384 (ASTM, 2012). This would typically result in lower measured values. Although a white layer was not explicitly identified by Tamura et al. (2012) in drilled Ti-6Al-4V, nanoindentation measurements undertaken indicated a hardened region was present at the surface. This appears to show similarities to white layers identified in other materials but may have been the chemical SI feature, alpha case. It should be noted that alpha-case formation is typically considered a time and temperature-dependent anomalous feature with Gaddam et al. (2013) showing that prolonged heating is necessary, this is not achieved during machining. Further evidence is required to establish whether white layer formation leads to a hardened surface in titanium due to the limited number of studies.
Energy dispersive X-ray spectroscopy measurements
In energy dispersive X-ray spectroscopy (EDXS), the characteristic x-rays emitted from samples illuminated by an electron beam are used to determine the chemical composition of the material. EDXS has been used to show that there had been a change in the composition of the phases in milled Ti-6Al-4V at the machined surface compared to the bulk (Moussaoui et al., 2013). In the near-surface material (up to 7-8 µm in depth), after machining, the proportion of Va % from a value of 11.6 % in the bulk. Although not explicitly identified by Moussaoui et al. (2013) this region of chemical change may be due to alpha-case formation or a white layer formed through phase transformation in titanium. However, the -depletion is indicative of alpha-case formation and the white layer was not clearly visible in an optical microscopy inspection. Due to the lack of prolonged heating of the material during drilling, further investigation would be required to determine which SI feature is present.
X-ray diffraction phase analysis
[Type here]
White layer has been found, via XRD phase analysis, to be formed due to microstructural transformation during cooling from a molten state in electro-discharge machined Ti-6Al-4V H Ç . By contrast, in chip forming machining operations, there have been no observations of phase change in the white layer observed on the machined surface (Velásquez et al., 2010) or in the chip (Velásquez et al., 2007). Re-orientation of the grain structure in the machined surface of Ti-6Al-4V has been reported (Patton et al., 2011) however the authors did not explain this phenomenon aside from attributing it to machining damage.
In the machining of steel alloys, the temperature of the workpiece at the contact point can raise as high as the austenitic phase transformation limit (Barry and Byrne, 2002). XRD studies (Chou and Evans, 1999, Barry and Byrne, 2002, Hosseini et al., 2012b, Bedekar et al., 2015) have shown that austenitic transformation of the machined surface at high temperature followed by rapid cooling results in a higher retained austenite concentration. The resulting ultra-fine grained microstructure in this instance is a white layer. By contrast, in situations where the white layer was formed by the SPD mechanism, it has been demonstrated that there are no phase transformations for nickel superalloys (Herbert et al., 2011) or high strength steel alloys (Hosseini et al., 2012b). This same result would be expected for the SPD mechanism white layer in titanium.
Residual stress measurements
Residual stress measurements can be obtained from XRD using the sin method by measuring the changes in the position of peaks in intensity from high angle diffractions. These position changes correspond to lattice strains (Fitzpatrick et al., 2005). In an alternative technique, blind-hole drilling, a hole is drilled in the sample and strain gauges or optical techniques are used to measure the resultant strain of the material when the drill is removed (Schajer, 2010). In both techniques, the residual stress is calculated from the measured strains.
Tensile residual stresses as large as 2000 MPa have been measured in the white layer after drilling of RR1000 (Kwong et al., 2009, Herbert et al., 2012). Similarly, in titanium alloys, it has been shown (Velásquez et al., 2010) that tensile residual stresses are present in the white layer of a machined surface. In the same study (Velásquez et al., 2010), it was measured that near-surface residual stresses at lower cutting speeds, when the white layer was thinner, were compressive. This agrees with the theory that tensile residual stresses are typically found when temperature effects during cutting have been dominant (Varela et al., 2014), i.e. often at higher cutting speeds. Compressive residual stresses, by contrast, imply that plastic deformation was overriding (Ulutan and Ozel, 2011).
[Type here]
the low thermal conductivity of the alloys, which would give smaller surface compressive stresses than at greater depths. This observation was also recorded in another study into steel (Caruso et al., 2011) where it was shown that the compressive residual stress was greatest at the interface between the white layer and the dark layer. It should be noted that a dark layer was also identified by Smith et al. (2007) but not by Chomienne et al. (2016) or Umbrello et al. (2011). Several studies (Bedekar et al., 2013, Hosseini et al., 2014a) have measured that compressive residual stresses were indicative of a white layer in steel formed via SPD whereas a tensile residual stress resulted from the thermally activated phase transformation mechanism.
Summary of white layer formation and its properties
It is clear that the white layers formed in titanium and nickel superalloys arise due to different mechanisms to those in some steels. Analysis of the physical properties, however, shows a considerable similarity between white layers in different materials. All white layers are hardened, possess large residual stresses and contain small grain sizes although they differ in chemical and phase composition depending on the formation mechanism. It is evident from the literature surveyed that there is still limited research on the formation of white layers in machined titanium, particularly with respect to nanohardness and grain size. Current research has not looked closely at a number of physical properties, such as elastic modulus, which are fundamental to some NDT methods. An understanding of elastic modulus changes and the crystallographic texture in the white layer, as well as the magnetic properties of white layers in steels, would certainly enhance the state-of-the-art and aid development of a suitable NDT inspection method.
Non-destructive characterization of the white layer
True NDT of a machining-induced white layer (as opposed to pseudo-NDT techniques such as nanoindentation) has been subjected to limited research. This is despite the considerable weight of research into machined surface integrity and the potentially catastrophic effect of the presence of a white layer in a critical aeroengine components. In this section, the current research in the field of NDT of white layers will be discussed. In addition, a brief description of the physical principles of the techniques discussed, will be presented.
Acoustic emission testing
[Type here]
The technique is commonly used in the field of machining for tool condition monitoring (Byrne et al., 1995). This is because acoustic signals are generated through changes to the condition of the tool, such as rake face pitting and flank face abrasion (Axinte et al., 2005). Research has also been undertaken to investigate combined workpiece and tool condition monitoring. It was shown (Marinescu and Axinte, 2008) that AET could be used to both monitor the condition of a tool and simultaneously detect when anomalous surface features were generated on the workpiece surface. This holistic condition monitoring approach is possible because acoustic emission (AE) energy can increase when workpiece surface anomalies such as laps and smeared material are generated during machining. This is due to the large redistribution of stress fields associated with these examples of severe plastic deformation. There have been attempts (Guo and Ammula, 2005) to monitor white layer formation during the turning of hard steels using AET. It was proposed that the RMS and frequency of the AE signal could be used as key indicators for monitoring white layer generation in the machined surface. It was reported that, due to the brittleness of the white layer compared with the bulk material, the RMS of the AET signal detected when generating white layer was as much as 100% greater. The increased brittleness leads to reduced damping and consequently larger amplitude vibrations. Through the use of feedback loops, AET could be used to monitor for white layer formation in-process and intelligently adjust the machining conditions to eliminate the generation of the anomalous surface.
It should be noted that surface roughness, tool edge sharpness and white layer formation are all purported to affect the AE signal but these effects could not be isolated by Guo and Ammula (2005). Additionally, AE is generated from a number of sources, including the primary, secondary and tertiary shear zones. It has been shown (Dornfeld and Kannatey-Asibu, 1980) that deformation in the primary and secondary shear zones contribute a greater proportion to total acoustic wave emission than the tertiary shear zone, however, it is the tertiary shear which contributes most directly to the formation of a white layer. Therefore future work should aim to decompose the AE signal so that only tertiary shear zone AE is monitored. This will greatly aid the development of AET for white layer detection.
AET is a highly mature in-process NDT method that would be comparatively cheap to conduct further research into, because of the accessibility of the technique. It is apparent from the research from Guo and Ammula (2005) that there is merit for further research into the use of AET for white layer detection.
Eddy current testing
[Type here]
to changes in one of three main factors, electrical permeability, electrical conductivity and lift-off. Lift-off in ECT refers to the change in the impedance signal when the distance between the test probe coil and the surface of the test piece changes. It is an undesirable effect that reduces the sensitivity of ECT for detecting changes in permeability or conductivity (Hughes et al., 2014).
ECT is typically used to detect cracks in metallic components (Brinksmeier et al., 1984) and extensive standards for this application can be found from the ISO (2018b). Due to the large number of microstructural features that can influence measured impedance, ECT can also be used for macroscopic grain texture measurements and to obtain residual stress profiles (Abu-Nabah and Nagy, 2007). This may be useful for white layer detection because white layers are often associated with extreme surface residual stresses (Guo et al., 2010, Chomienne et al., 2016) and possess significantly different grain texture to bulk material (Barry and Byrne, 2002, Herbert et al., 2011).
Abu-Nabah and Nagy (2007) and Abu-Nabah et al. (2010) conducted research into the application of ECT for determining residual stress profiles in shot-peened nickel superalloys. This was achieved through the measurement of the change in conductivity at different inspection frequencies. The residual stress profiles in machined surfaces with white layer have been measured, via XRD and hole drilling, to occur over a smaller depth than those from
shot-(Hood et al., 2016)). Despite this, it is conceivable that the ECT residual stress-profiling technique may be transferable to machined surfaces.
[Type here]
More advanced forms of ECT including pulsed, swept frequency and multifrequency ECT have been trialled in a Federal Aviation Administration study (Patton et al., 2011) into the non-destructive detection of metallurgical machining features. In the tests, various probes were trialled, including a flexible magnetic carpet probe which facilitated better contact by allowing the probe coils to follow the contours of the test piece surface, reducing lift-off effects. Results showed that pulsed, swept and multifrequency ECT were not suited detection of metallurgical machining damage, this was largely due to the effect of surface topography features that arise from machining (feed marks). The effect of these features is to mask any metallurgical changes within the machined surface. However, these techniques were sensitive to topological features such as lapped material on the workpiece surface which resulted in probe lift-off changes.
The detrimental effect of surface roughness on impedance measurements has been reported in other studies and is the major barrier in adapting ECT for inspection of the white layer. Blodgett et al. (2003) measured a 30% reduction in conductivity for a surface with 13 µm RMS roughness compared to 1.5 µm RMS. In addition, there is also a detrimental compounding effect due to the similarity of the lift-off and conductivity curves in low conductivity aeroengine alloys such as Ti-6Al-4V, as illustrated in Figure 3. These curves are the trace formed on an impedance display for changes in each variable. It can be seen from Figure 3 that a change in lift-off can appear as an apparent reduction in conductivity for an alloy such as Ti-6Al-4V, thus increasing the chances of a false positive. Another key issue with ECT is electrical noise during the inspection. At high frequencies, the capacitance of the cable connecting the ECT probe to the electrical circuitry can be affected by interaction with the surroundings and results in additional noise to the impedance measurement. A system has been developed that mounts the electrical circuitry in the test probe (Hughes et al., 2016) and this facilitated the detection of smaller artificial slots than a conventional system due to an improved signal to noise ratio. Currently, the only solution to the issue of surface roughness is to polish the surface being inspected to produce an ideal flat surface.
Figure 3. Conductivity and lift of curves on the impedance plane, after (Cox, 2000).
[Type here]
white layers in nickel superalloys using ECT residual stress profiling should be the subject of future study due to the success of the technique for inspecting shot-peened surfaces
Ultrasonic techniques
In ultrasonic inspection techniques, the propagation of elastic waves is typically used to detect and size anomalous features such as cracks, but the phenomenon can also be utilized to determine underlying microstructural features (Brinksmeier et al., 1984). The technique is readily accessible and is widely documented in industrial standards (ISO, 2018a). With respect to detection of a white layer, surface acoustic wave (SAW) techniques are far more suitable than conventional bulk ultrasonic testing wherein un-guided waves are used (Auld, 1973). This is because SAW techniques are inherently surface inspection methods due to the limited depth of penetration of surface waves (also termed Rayleigh waves). The energy of the Rayleigh wave decays with depth and the depth of penetration is approximated to one wavelength (Auld, 1973). The wavelength can be controlled by altering the frequency of the induced wave, thus thin surface regions can be inspected through the use of very small wavelengths.
In SAW techniques a Rayleigh wave is introduced on the surface of a test piece by a piezoelectric device or a laser (Sharples et al., 2006, Patton et al.). The speed of the Rayleigh waves depends on the density and elastic stiffness constants (related to elastic modulus and crystal structure orientation) of the local region of material (Farnell, 1970). Therefore any change in these properties can be detected by measuring a change in the velocity of the SAW (Ostiguy et al., 2015).
Ultrasound is attenuated, even in ideal (anomaly free) materials, due to the spreading out of the wave. In non-ideal materials, there is also additional attenuation due to scattering and absorption (Li et al., 2015) and it is these two attenuation mechanisms that are fundamental to SAW NDT methods. Scattering is the reflection of a wave in directions other than the original direction of propagation whereas absorption is the conversion from sound to another form of energy. At material grain boundaries, ultrasound is always scattered to some degree due to changes in acoustic impedance (Zhang et al., 2016). Ultrasound attenuation can, therefore, be used as the basis of a technique for evaluating the grain size in polycrystalline materials, as shown by Li et al. (2015) in AISI 304 steel. It was suggested that the degree of attenuation is greater with smaller grain sizes as there are more grain boundaries to scatter the waves.
[Type here]
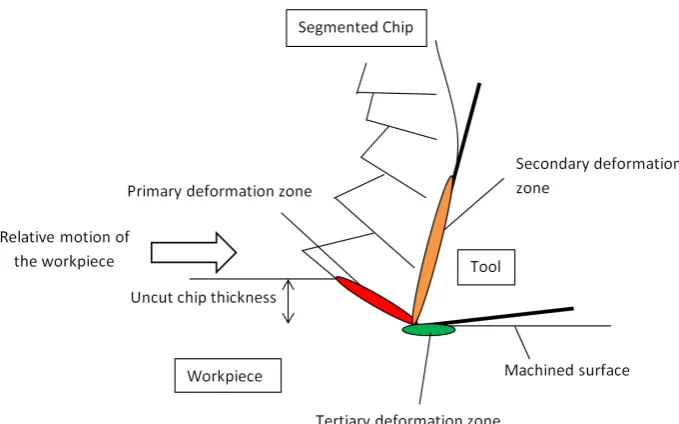
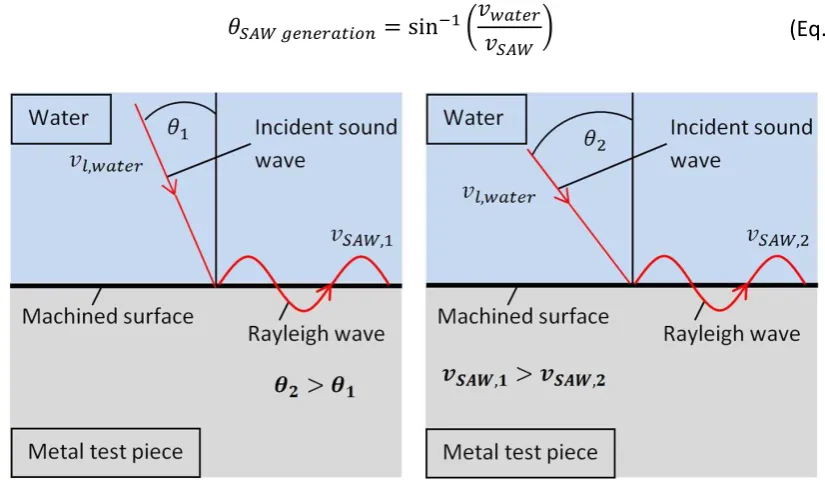
SAW velocity as highlighted by Equation 3.1 (Patton et al., 2011) and shown schematically in Figure 4.
sin (Eq. 1)
Figure 4. A schematic showing the dependence of the incident beam angle on SAW speed.
In Equation 3.1, is the incident ultrasound wave angle required to generate a SAW and and are the velocity of ultrasound in water and the velocity of a Rayleigh wave in the test piece respectively. Patton et al. (2011) proposed that this technique could detect damage due to changes in the elastic modulus of the surface region. Further investigation at higher frequencies, where penetration depth is smaller, could improve the capability to specifically detect white layer rather than simply identifying broader machining damage. Due to the findings of Patton et al. (2011), an investigation into the elastic modulus changes in the white layer and swept grain regions of titanium could reveal key differences between these features and aid the development of an NDT method to specifically target white layer. In the same study (Patton et al., 2011) the use of ultrasonic microscopy for detection of general machining damage was also investigated. As a SAW wave propagates, it loses energy into the surroundings, a portion of this acoustic energy propagates through the water surrounding the submerged test piece and can be detected by the detector. The amplitude of the radiation from the leaky SAW was found to have no correlation with the presence of metallurgical anomalies such as a white layer or swept grain as the effect of surface topology was overriding (Patton et al., 2011). The technique was instead found to be sensitive to SI topology features such as smeared, re-adhered chip material.
[Type here]
parameter of the SAW, a common measure of wave distortion. It is predicted that, based on results presented here, both non-linear ultrasound and attenuation of ultrasound have the potential for use as a technique for white layer detection. This is due to the ultra-fine grain structure in addition to SPD associated with the anomalous surface feature. It is important to consider that the technical maturity and accessibility of these methods is lower than a method such as conventional ECT, partly due to the greater complexity of these ultrasonic techniques. Spatially resolved acoustic spectroscopy (SRAS) is an ultrasonic inspection technique in which laser generated SAWs are used to determine the grain orientation in a material through measurement of acoustic velocity. The laser generated SAWs propagate across a small region of the sample and are detected by a continuous detection laser. By determining the velocity of the Rayleigh waves in many directions and comparing these measurements to known relationships between crystal orientation and the speed of sound, a map can be produced showing the grain structure and orientation of the crystal lattice (Smith et al., 2012). Further information on these crystal relationships can be found from Farnell (1970).
SRAS scans in multiple orientations, when combined, give comparable information to EBSD scans. This is at high scan rates of 1000 points per second and without the need to section all samples due to larger size constraints, although the spatial resolution is inferior to EBSD (several nm) and currently SRAS samples must be polished smooth (Mark et al., 2017). Although the capability of the current class of equipment is limited by sample roughness, techniques to circumvent this issue are under investigation (Sharples et al., 2014). The lower spatial resolution of SRAS is due to restrictions on the size of the generation patch that can be used, a smaller patch gives in better resolution but results in greater laser intensity which can lead to burning of the sample (Smith et al., 2014). However, white layer is generally a continuous surface layer so high lateral resolution is not critical and SRAS may still be able to detect a general change between the anomalous material and conventional material. It is more pertinent to consider the depth resolution of SRAS when considering white layer detection because decreasing the wavelength of the laser-induced surface waves will allow smaller thicknesses of material to be examined. The depth resolution could, therefore, be tailored to increase the signal-to-noise ratio of any measurable difference associated with the
T “‘A“
the waveform is measured, dictates that detection of wavelengths smaller than 16 is not
T
white layers would still form a significant portion of the interaction volume.
[Type here]
times greater than for EBSD. There has been no study into the use of SRAS for evaluation of machined surfaces, however, based on the theory behind the technique and results summarized here there is scope to trial this technique for white layer detection. The cost to implement SRAS, compared to a more established technique like ECT, would be higher due to the low technical maturity. The technique, at this stage, is still laboratory based.
Barkhausen noise inspection
The Barkhausen effect, first observed by Barkhausen (1919), is the discontinuous change in magnetization of a ferromagnetic material in a varying magnetic field. The effect occurs due to sudden, finite changes in the size of ferromagnetic domains through the movement of magnetic domain walls (Willcox and Mysak, 2004). The motion of these walls is affected by microstructural features such as grain boundaries, in addition to mechanical effects such as the material stress state (Brinksmeier et al., 1984). Only ferromagnetic materials, such as some steel alloys, can be tested with Barkhausen noise (BN) equipment, nickel superalloys and titanium alloys are paramagnetic and therefore not applicable to BN testing. Standards for this technique can be found from SAE-International (2010).
In BN testing, an alternating magnetic field is applied to the sample. As the magnetic field varies, the magnetic moments within the sample attempt to align with the field but, due to domain wall movement restrictions (e.g. grain boundaries), the magnetization of the sample occurs in a step-wise manner. This magnetization -up coil through spikes in induced current or voltage (Gauthier et al., 1998).
The most widely researched application of BN inspection is in verification of case-hardening depth in steels (Santa-aho et al., 2012, Dubois and Fiset, 1995). The technique has also been used for detection of grinding burn, a thermal defect (Karpuschewski et al., 2011) as well as for determination of residual stresses (Santa-aho et al., 2014b). More recently the technique has been specifically applied to detection of a white layer formed in milled steel N al., 2015, Stupakov et al., 2016), wherein increased tool wear during machining resulted in the appearance of a second peak in the BN envelope formed at different magnetic field strengths. Higher tool wear promotes white layer formation so this observation was attributed to increasing white layer thickness. Stupakov et al. (2016) then improved upon the technique by developing a BN sensor in-house and trialling different magnetization waveforms for a variety of surfaces. They were able to rank samples, using BN, in terms of the associated level of tool wear.
[Type here]
physical properties of the machined surface are facilitating this detection is required to enhance the overall understanding of this inspection technique.
It is worth considering that although residual stress profiles were measured for each surface, the effect of the residual stresses on the measurement was dismissed as inconspicuous. This was due to the hard material being studied, a reduced inspection depth and compensation of the compressive sub-surface by a tensile spike at the near-surface. However, the maximum filter frequency used (120-200 kHz) would not usually restrict the BN to within the white layer, as mentioned by Stupakov et al. (2016). The effect of residual stress and this apparent restriction in inspection depth is therefore worthy of further investigation. The white layers in this study where formed by the thermal mechanism, evidenced by the dark layers present beneath them, so it would also be appropriate to investigate the technique on a white layer formed by the SPD mechanism.
BN may be used for evaluating the case depth of case-hardened steels, due to the difference in magnetic properties of a magnetically soft phase such as cementite (the core) and a magnetically hard phase such as martensite (the case). Measured BN is therefore affected by the difference in phase composition between the case hardened layer and the core material. Early research in this area focused on simple BN measures, such as the RMS of the BN signal, using purpose-built equipment (Dubois and Fiset, 1995). More recently, magnetic voltage sweeps have been utilized on a commercially available BN analyzer to successfully order a set of case-hardened axles based on the depth of the hardened region, showing that custom, laboratory level equipment is not always necessary (Santa-aho et al., 2014a). BN has also been used (Alonso et al., 2014) for evaluating hardened layer thickness in grind-hardened surfaces using RMS measurements based on the same underlying microstructural changes. In this grind-hardening study, it was found that the RMS of the BN signal decreased with increasing hardening depth, as would be expected due to the larger percentage of magnetically hard material in the inspection volume. Similarly, Liu et al (2015) and Wilson et al. (2014) were able to successfully distinguish between different heat treatments in grade 91 steel tubes and pipes using BN and coercivity measurements. In this case, the microstructure of the steel, both in terms of the phases present and the precipitate density, influenced the NDT measurement.
[Type here]
formed via the SPD mechanism. As a result, it may be possible to use BN for detection of an SPD white layer through measurement of compressive residual stress in machined steel. Magnetizing voltage sweeps have also been used for residual stress evaluation (Santa-aho et al., 2014b). For these sweeps, the maximum slope of the magnetizing voltage sweep divided by the magnetizing voltage was seen to correlate linearly with tensile stress, a closer relationship than that which has been measured (Vrkoslavová et al., 2014) for the RMS of the BN signal. This again shows that in-house laboratory systems for BN are not always necessary due to the effectiveness of commercially available BN devices. The detection of tensile stresses using sweep measurements may allow identification of machining-induced white layers formed via phase transformation.
It has been demonstrated (Ktena et al., 2014) that the qualitative evaluation of grain size using BN testing is possible. Larger measured peak values in pick-up coil voltage have been attributed to smaller grain sizes. This is because a larger total grain boundary area, as found with smaller grains, restricts domain wall motion and consequently results in greater
It may, therefore, be possible that this technique could distinguish between nanoscale grains in the white layer and larger grains in a machined surface with good SI.
On-line measurements of elongation in skin passed steel samples have been carried out using BN (Peyton et al., 2016). Both the BN signal and hysteresis loop properties, such as the coercive field and the differential permeability, were found to change with percentage elongation. These changes in measured values were attributed to an increase in damage to the microstructure at greater elongation. Based on this research into in-process inspection, the adoption of BN within a machining centre may be achievable.
BN is a mature technique that would have a low cost to implement compared to other NDT techniques that remain in development. The specific research into the particular application of BN for white layer detection by a handful of authors means that there are already excellent foundations for further work in developing this technique. The major restriction on the adoption of BN for inspection for white layers is the limitation of the technique to steel alloys within aeroengine materials.
Optical scattering
The phenomenon of the reflection of light waves forms the basis of optical scattering NDT. Incident light waves on the surface of a perfectly flat material are reflected at an angle equal to the incident angle. For a rough surface, the beam is scattered over a range of angles (Rong-Sheng Lu and Gui Yun, 2006). Typically, optical scattering techniques are used for surface roughness measurements and studies have shown K K N
[Type here]
In one study (Daghini et al., 2014), an attempt was made to utilize optical scattering for detection of white layer in the surface of a hard turned steel. It was measured that the degree of optical scattering was greater from a surface machined with a worn tool compared to a new tool, particularly at high cutting speeds. It is claimed (Daghini et al., 2014) that the increase in the amount of scattering measured is due to the presence of a white layer rather than an increase in surface roughness which was similar across all the samples tested. This indicates that optical scattering could be appropriate as a test for white layer, however, only 4 samples and one type of alloy were investigated so further study is necessary to instil greater confidence in the presented results. Similar to AET, optical scattering would have a low cost to implement due to the high technical maturity and availability of equipment. The link between the physical properties of the white layer and the physical phenomenon behind the technique is not clear and requires further study.
Positron annihilation spectroscopy
Positron annihilation spectroscopy (PAS) is a technique in which positron-electron annihilation events are used to determine the proportion of crystallographic defects, such as dislocations, that are present within a test piece. Due to their positive charge, positrons are repelled within a material to the regions furthest from atomic nuclei, typically vacancies and dislocations in the crystal lattice (Patton et al., 2011). In these regions, due to the large distance from atomic nuclei, positrons annihilate with valence (outer shell) electrons which have much lower momentum than inner shell electrons. Thus, in a test piece with a large number of vacancies and dislocations, positrons will tend to annihilate with valence electrons, whereas for a test piece with a more ideal crystalline structure, the annihilation of positrons will be with a greater proportion of higher energy positrons. The spectrum of gamma-rays produced in the annihilation event is used to determine the nature of the collision (Horodek et al., 2012).
It has been shown that PAS can be used for the detection of machining damage in Ti-6Al-4V (Patton et al.), copper (Dryzek et al., 2015) and stainless steel (Horodek et al., 2012). The ability to distinguish between damaged an undamaged samples was attributed to the increased number of dislocations in the near-surface, caused by deformation during machining. A higher number of dislocations changed the nature of positron annihilation events and broadened the gamma-ray spectrum. No attempt has been made to distinguish machining damage into individual SI features such as a white layer. It is also worth noting that PAS has been used to identify damage in a worn track (Dryzek et al., 2014), which is one of the common situations to find white layer outside of machining. Due to the small depth of penetration of positrons in metals (only 29 µm in steel for a 22Na positron source (Horodek et al., 2012)), this is inherently a surface inspection technique so, therefore, shows good potential for detecting white layer if the effects of other SI features can be removed.
[Type here]
further study is necessary to distinguish the effects of the white layer and the swept grain region. A major barrier to any implementation of PAS is the extra precautions that must be in place to protect the operator due to the ionizing radiation released during positron annihilation. Combined with the lower technical maturity of the technique, compared to more established methods such as ECT, this results in an increased cost to implement for PAS. Finally, it should be noted that a lack of standards for this technique makes it less accessible.
Summary of NDT methods
A summary of all NDT methods discussed in this paper is presented in Table 3. The techniques have been assigned a usefulness score (U) out of 5, based on the sensitivity of the physical phenomenon behind the technique to a physical property of the white layer. A technique which is affected by changes in several key properties of a white layer will score highly (5) whereas a technique which is not affected by any property of the white layer will receive a low score (1).
A practicality score (P) out of 5 was also assigned. This score is assigned by assessing the feasibility of using the technique for a range of different aeroengine materials as well as considering the difficulty in carrying out inspection in-process, as part of a machining centre. Additionally, P also considers any limits in sensitivity that could restrict the effectiveness of the technique for thin white layers. A technique which has no material restrictions, is not reliant on a vacuum or large equipment and has high sensitivity, would score highly (5). It should be noted that the U and P scores are aimed at guiding an individual or organization that does not already possess considerable expertise and equipment resources in one particular field of NDT.
The product of these two scores (U*P) is used as an overall measure of the potential of each technique in the application of white layer detection. The techniques are summarized in Table 3 and are ranked according to this U*P score.
Table 3. A summary of NDT methods and their applicability to the detection of a white layer.
NDT Technique
Features detectable
Material limitations
U /5
P /4
U*P /25
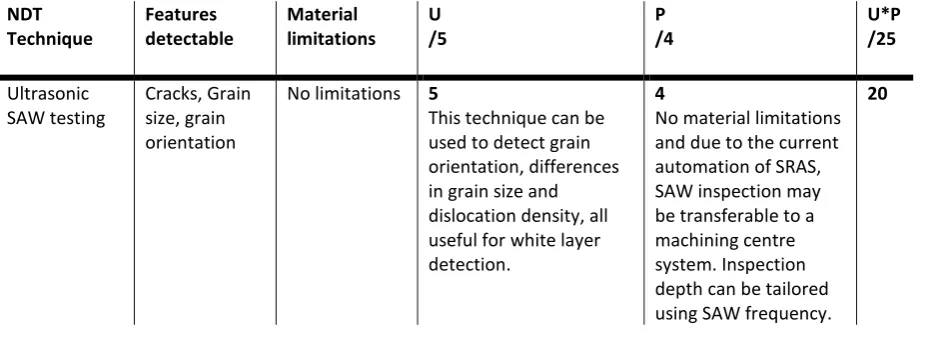
Ultrasonic SAW testing
Cracks, Grain size, grain orientation
No limitations 5
This technique can be used to detect grain orientation, differences in grain size and dislocation density, all useful for white layer detection.
4
No material limitations and due to the current automation of SRAS, SAW inspection may be transferable to a machining centre system. Inspection depth can be tailored using SAW frequency.
[Type here] Barkhausen noise inspection Residual stress, hardened surface layers, grain size, grinding burn, white layer Ferromagnetic materials 5
BN may detect white layers through association with large residual stresses, small grain sizes and hardness changes.
3
BN is suitable only for some steels. In-process monitoring may be possible.
Improvements would be required in the resolution capability. 15 Eddy current inspection Cracks, Residual stress changes, grain texture, conductivity changes Electrical conductors 4
ECT can be used for detection of extreme residual stresses, changes in conductivity and grain texture. It has been shown that white layers often possess extreme residual stresses and have a refined grain structure. Further study is needed to investigate a change in conductivity in the white layer.
2
Residual stress profiling is applicable only to nickel superalloys. Grain texture measurements are only suited to titanium alloys. Conductivity
measurements can be carried out in all materials. Penetration depth can be improved using input frequency changes although high frequency adds considerable noise, particularly with rough surfaces. In-process monitoring may be possible. 8 Acoustic emission testing Laps, smeared material, white layer*
No limitations 2
AET may be able to detect white layer formation from RMS measurements but there is difficulty in isolating other contributing factors to the measured signal.
4
AET can only be used in-process but would require calibration for every change in tooling and cutting parameters. 8 Positron Emission spectroscopy Lattice defects such as dislocations and vacancies
No limitations 4
PAS is very good for detecting severe plastic deformation which is fundamental to one of the formation
mechanisms for white layers.
2
There are no material limitations but there would be difficulty implementing the technique due to the ionizing radiation produced. 8 Optical scattering methods Roughness, white layer*
No limitations 1
There is no clear direct link to the physical properties of the white layer.
5
There are no material limitations and there is potential to implement in a machining centre.
5 Dye-penetrant inspection Surface breaking cracks Non-porous materials 1
The technique is only suitable for crack detection.
4
There are no material limitations but online inspection is unlikely.
[Type here] Magnetic particle inspection
Surface breaking and slightly sub-surface cracks.
Ferromagnetic materials
1
The technique is only suitable for crack detection.
3
Technique would be limited to steels and automated inspection would be difficult.
3
* Only one study claiming detection of a white layer with this method
Concluding remarks
This paper describes the current state-of-the-art in the destructive and non-destructive testing of machining-induced white layers. Analysis of the formation mechanisms and properties of white layers has permitted the review of NDT techniques that may be applicable to its detection. White layers formed in titanium and nickel superalloys arise due to different mechanisms to those in some steels but analysis of the physical properties has shown there is considerable similarity between white layers in different materials. Therefore, there is merit for further study into white layers formed in titanium as well as the determination of additional key physical properties of white layers in all materials. These properties include the elastic modulus and electrical conductivity as well as magnetic properties, as they are fundamental to a number of NDT techniques.
Conventional destructive characterization techniques, such as optical microscopy, in addition to more advanced testing using transmission electron microscopy and nanoindentation, are all costly and time-consuming. Non-destructive tests using BN, ECT, SAWs, AET, PAS offer improvements in both of these aspects, however, further research is required to develop these techniques to enable reliable detection of machining-induced white layer in-process. The key observations from this literature review and comments on the future needs in the development of an NDT method for detecting machining-induced white layer are outlined below.
1. The presence of a white layer significantly reduces the fatigue life of a component and as such should not be present on an aeroengine component.
2. White layers are well-known to be hard, contain extreme residual stresses and possess small grain size. However, there is room for further research into the white layers formed in titanium alloys as these are less well understood than their counterparts in steels and nickel superalloys.
3. Additional physical properties of the white layer such as elastic modulus, electrical conductivity as well as a number of magnetic properties should be determined. It would also be appropriate to investigate the crystallographic texture of machining-induced white layer.
4. White layers in machined surfaces are formed via the phase transformation mechanism or the SPD mechanism. The NDT method for detecting these two types of white layers may differ due to differences in residual stress states and phase composition changes.
[Type here]
Trials to investigate the effect of acoustic emission from the tertiary shear zone during formation of a white layer by, for example, rubbing the machined surface without creating a chip, would aid the development of this technique.
6. Eddy current inspection may facilitate the detection of white layer in nickel superalloys through measurement of residual stress. Resolution capability and the effect of surface roughness restrict the potential for detecting grain orientation with ECT. Further research into high frequency ECT of the machined surface of nickel superalloys is recommended based on current findings in the literature.
7. Ultrasonic SAW testing appears to be the most promising technique for detection of white layers across different material groups. This is due to the versatility, both in terms of material limitations and the ability to tailor inspection depth. The backscatter method has been shown to be capable of detecting machining damage but further work is needed to understand the relative influences of the white layer and swept grain regions. It is recommended that SAW testing of machined surfaces with a white layer is carried out using a technique such as SRAS, which would offer improved sensitivity over the backscatter technique.
8. Barkhausen noise has already been shown to be capable of white layer detection. To further develop the technique, an investigation into which specific properties of the white layer have significant effects on BN inspection should be carried out. It is important to separate the effects of residual stress and hardness changes. Additionally, attempts should be made to detect SPD white layers where a dark layer will not be present beneath the white layer.
9. An increase in optical scattering on a surface with white layer has been shown in one small-scale study. However, there is no apparent physical property of the white layer which should affect optical scattering and so further work is needed to understand this technique.
10. Positron annihilation spectroscopy has been used to detect machining damage but additional work should be carried out to separate the effects of the white layer and the swept grain regions. Due to the effects of dynamic recovery, it may be that the white layer has a lower density of crystallographic defects than the swept grain region and, therefore, may be less detectable than general machining damage.
Acknowledgements