COMMISSION OF THE EUROPEAN COMMUNITIES
Brussels, 21.06.2001 COM(2001) 305 final
ANNUAL REPORT FROM THE COMMISSION
CONTENTS
Annual Report from the Commission on the Guarantee Fund and its Management in 2000 .... 1
1. Legal bases... 4
2. Position of the Fund at 31 December 2000... 4
3. Payments into the Fund ... 5
3.1. Payments from the general budget in the course of the financial year... 5
3.2. Interest from financial investment of the Fund’s liquid assets ... 6
3.3. Recovery from defaulting debtors... 7
4. The Fund’s liabilities ... 7
4.1. Default payments... 7
4.2. EIB remuneration ... 7
ANNEX I: Legal bases for payments to the Guarantee Fund from the general budget ... 9
1. Decisions covered by Transfer 6/2000 ... 9
2. Decisions covered by Transfer 69/2000 ... 10
3. Decisions covered by Transfer 74/2000 ... 10
ANNEX II: EIB Status Report on the Fund and its management revenue and expenditure account and balance sheet at 31 December 2000 ... 11
1. Development of the Fund in 2000... 11
2. Situation of the Fund ... 11
2.1. Resources at 31 December 2000 ... 11
2.2. The Fund’s assets at 31 December 2000 ... 12
2.3. Liquidity risk... 12
3. Guarantee Fund investments: Analysis of results and performance in 2000... 13
3.1. General analysis ... 13
3.2 Sectoral analysis ... 14
3.2.1. Treasury operations ... 14
1. LEGAL BASES
Council Regulation (EC, Euratom) No 2728/94 of 31 October 1994 set up a Guarantee Fund for external operations in order to repay the Community’s creditors in the event of default by beneficiaries of loans granted or guaranteed by the Community.
In accordance with Article 6 of the Regulation, the Commission entrusted financial management of the Fund to the European Investment Bank (EIB) under an Agreement signed between the Community and the EIB on 23 November 1994 in Brussels and on 25 November 1994 in Luxembourg.
Under Article 8.2 of the Agreement, by 1 March each year the Bank must send the Commission a status report on the Fund and its management, the revenue and expenditure account and the financial statement for the Fund for the preceding year. An extract from the report covering 2000 is in Annex II.
In addition, Article 7 of the Regulation establishing the Fund requires the Commission to send the European Parliament, the Council and the Court of Auditors a report on the situation of the Fund and its management for each financial year by 31 March of the following year.
2. POSITION OF THEFUND AT31 DECEMBER2000
At the close of the 2000 financial year, the Fund totalled EUR 1 432 248 964.36 (Annex II). This is the sum, since the Fund was established, of all:
– budget payments to the Fund (EUR 1 824 703 500.00);
– successive yearly net results (EUR 210 473 626.02) and interest received on late recoveries;
– late repayments from non-member countries (EUR 326 997 369.48);
– debts corresponding to the repayments not made to the Bank (EUR
689 783.78);
– less: calls on the Fund’s resources (EUR 458 915 314.92) and successive repayments to the budget of the surplus in the Fund (EUR 471 700 000.00).
After the Bank’s remuneration is deducted, the Fund total at 31 December 2000 comes to EUR 1 431 559 180.58.
by guarantee payments under the Fund and EUR 50 496 420.98 in default interest accrued but not received at 31 December 2000.
Article 3 of the Regulation establishing the Fund requires that the amount of the Fund has to reach an appropriate level (target amount) set at 9% of the total outstanding capital liabilities arising from each operation, plus unpaid interest due.
Outstanding lending and loan guarantee operations for non-member countries plus unpaid interest due totalled EUR 14 068,8 million at 31 December 2000, of which EUR 164.6 million was accounted for by interest due but not yet paid.
The ratio between the Fund’s resources and outstanding capital liabilities within the meaning of the Regulation was 10.17%. Since this is higher than the target amount of 9%, there had to be a repayment from the Fund to the general budget of the Communities, as provided for in the third paragraph of Article 3 of the Regulation. The amount to be repaid to the budget came to EUR 165.36 million.
The following sections describe developments affecting the Fund’s resources and liabilities in 2000
3. PAYMENTS INTO THEFUND
3.1. Payments from the general budget in the course of the financial year
Article 1 of the Regulation of 25 May 1999 amending the Regulation establishing the Fund stipulates that the Fund is to be endowed by payments from the general budget equivalent to 9% of the capital value of loan and loan guarantee operations until the target amount is reached. This Article also lays down that the provisioning rate is to be raised to 10% for new operations if the Fund’s resources fall below 75% of the target amount as a result of guarantees being activated to cover any default.
The legal bases for the provisioning arrangements are described in Annex I.
The Council Decision of 31 October 1994 concerning budgetary discipline authorised the entry in the general budget of a reserve for loan and loan guarantee operations. This item, which was allocated provisions of EUR 203 million in 2000, is used for endowing the Fund by transferring amounts into the budget item for payments into the Fund.
On these legal bases, three transfers totalling EUR 186 290 500 were adopted by the budgetary authority in 2000 to endow the Guarantee Fund.
– Transfer 74/2000: EUR 20 475 000. This third transfer was for payments into the Fund in respect of loan operations adopted by the Council on 4 December 2000.The decisions covered by this transfer are given in Annex I.
The first of the three annual transfers to the Fund was made in April, and the remaining two in December 2000.
3.2. Interest from financial investment of the Fund’s liquid assets
The Fund’s liquid assets are invested in accordance with the management principles laid down in the Annex to the Community/EIB Agreement.
These principles state that during the Fund’s first years of operation it will be treated as a money-market investment fund dealing solely in short-term instruments up to one year, as long as the total amount invested does not exceed ECU 300 million. As the amount of the Fund exceeded this ECU 300 million threshold in 1995, the Commission agreed with the EIB to amend the investment principles early in 1996.
The new management procedures are based in principle on a ratio of one third invested for one year and two thirds for a maximum of 10 years, although at least EUR 150 million has to be short-term investments. The average term of investments from the Fund’s assets must not exceed five years.
The list of banks authorised to receive deposits is agreed by the Commission and the EIB. The original list has been revised several times in the light of the latest changes in bank ratings. Most of the banks are members of the euro clearing system. They all have a Moody’s rating of at least A1 for long-term and P1 for short-term investments, and investments made with them are governed by rules to ensure a good spread and avoid the concentration of risk.
In 2000 interest on deposits, the Guarantee Fund current account and securities totalled EUR 62 728 173.51, broken down as follows:
– deposits: EUR 18 996 521.08. This represents the situation at 31 December including interest received on bank deposits (EUR 17 082 335.80) and changes in interest accrued (EUR 1 914 185.28) in 2000. The interest accrued corresponds to interest which has not been received by the Fund at the end of the year but will be paid at the dates fixed for maturity of the investments. The interest accrued at 31 December 2000 (EUR 4 070 765.00) is reduced by the accrued interest entered in the accounts for 1999 but received in 2000 (EUR 2 156 579.72).
– Current accounts: EUR 157 806.60, comprising interest recorded on the current account.
The interest received is entered in the results for the financial year.
3.3. Recovery from defaulting debtors
Any late repayments by defaulting countries on operations where the Fund has honoured the guarantee are paid into the Fund. The running total now comes to EUR 326 997 369.48 (see point 2.1 of Annex II).
4. THEFUND’SLIABILITIES
4.1. Default payments
The Fund’s guarantee was called in on three occasions in 2000, involving a total of EUR 17 355 629.49 (see point 2.1 of Annex II).
4.2. EIB remuneration
Article 6 of the management Agreement between the Commission and the EIB sets an annual commission of 0.125% calculated on the Fund’s average monthly balances. The figure is to be reviewed at the end of any year in which the Fund’s liquid assets reach ECU 300 million and no later than three years following the date of the first payment into the Fund, taking into account such things as the growth of the Fund’s activities.
As the Fund had reached ECU 300 million at the end of 1995, the EIB’s remuneration was reviewed. Taking into account the Bank’s experience of the workload involved in its management, a supplementary Agreement dated 17 September and 23 September 1996 to the Agreement on the financial management of the Fund reduced the annual payment to 0.05% of the Fund’s assets; this rate was applied retrospectively to 31 December 1994.
ANNEX I
Legal bases for payments to the Guarantee Fund from the general budget
The Annex to the Regulation, which concerns the arrangements for payments under the Guarantee Fund, stipulates that, for borrowing/lending operations or guarantees to financial bodies under a framework facility spread over several years and with a micro-economic and structural purpose, payments will be made in annual tranches calculated on the basis of the annual amounts indicated in the financial statement attached to the Commission proposal, adapted, where appropriate, in the light of the Council decision.
In the case of other borrowing/lending operations such as balance-of-payments loans to non-member countries, irrespective of whether they are made in one or more than one tranche, the amount to be paid into the Fund will be calculated on the basis of the total amount for the operation decided on by the Council.
Three transfers were made under this procedure in 2000.
1. DECISIONS COVERED BYTRANSFER6/2000
As part of the financial cooperation with the Mediterranean countries:
– Council Decision of 24 January 1994 for a three-year loan of ECU 115 million for Syria.
– Council Decision of 14 April 1997 granting a Community guarantee to the EIB against losses on loans for projects outside the Community (Central and Eastern European countries, Mediterranean countries, Latin American and Asian countries and South Africa).
– Council Decision of 19 May 1998 granting a Community guarantee to the EIB against losses on loans for projects in the former Yugoslav Republic of Macedonia and amending Decision 97/256/EC granting a Community guarantee to the European Investment Bank against losses on loans for projects
outside the Community (Central and Eastern European countries,
Mediterranean countries, Latin American and Asian countries and South Africa).
– Council Decision of 14 December 1998 amending Decision 97/256/EC so as to extend the Community guarantee granted to the EIB to cover loans for projects in Bosnia and Herzegovina.
– Council Decision of 29 November 1999 granting a Community guarantee to the European Investment Bank against losses on loans for projects for the reconstruction of the earthquake-stricken areas of Turkey. These loans are limited to an overall ceiling of EUR 600 million over a period of three years.
beginning on 1 February 2000 for Central and Eastern Europe, the Mediterranean countries, Latin America and Asia and on 1 July 2000 for the Republic of South Africa and ending for all regions on 31 January 2007.
2. DECISIONS COVERED BYTRANSFER69/2000
– Council Decision of 20 March 2000 amending Decision 97/787/EC providing exceptional financial assistance for Armenia and Georgia in order to extend it to Tajikistan. The amount of aid made available to Tajikistan, in the form of loans, is EUR 75 million.
– Council Decision of 10 July 2000 providing supplementary macro-financial assistance of EUR 15 million to Moldova.
– Council Decision of 7 November 2000 amending Decision 2000/24/EC so as to extend the Community guarantee granted to the European Investment Bank to cover loans for projects in Croatia. These loans are limited to an overall ceiling of EUR 250 million over a period of four years.
3. DECISIONS COVERED BYTRANSFER74/2000
ANNEX II
EIB Status Report on the Fund and its Management Revenue and Expenditure Account and Balance Sheet at 31 December 2000
1. DEVELOPMENT OF THEFUND IN2000
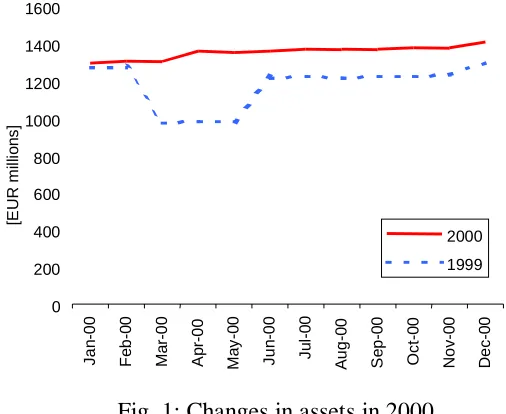
As stated in point 2.2, the total holdings of the Fund stood at EUR 1 410.1 million at 31 December 2000 as against EUR 1 297.8 million at 31 December 1999, an increase of EUR 112.3 million.
[image:9.595.181.434.227.434.2]0 200 400 600 800 1000 1200 1400 1600 Jan -00 Fe b-0 0 M a r-0 0 A p r-0 0 Ma y -0 0 Jun -00 Ju l-0 0 A ug-0 0 Se p -0 0 Oc t-0 0 No v -0 0 De c -0 0 2000 1999 [E U R m ill io n s ]
Fig. 1: Changes in assets in 2000
On 18 April 2000 the Fund received EUR 42.5 Million: on the one hand, a surplus of EUR 107.9 million was repaid to the Commission under Article 7 of the Agreement, and, on the other, the Fund’s resources were increased by EUR 150.4 million. The Fund’s resources were again increased by EUR 35.9 million on 29 December 2000.
The operating result came to EUR 57.4 million at 31 December 2000 as against EUR 41.1 million at 31 December 1999. Portfolio income (net of the spread of premiums/discounts) came to EUR 39.1 million, representing more than 68% of the revenue recorded at 31 December 2000.
2. SITUATION OF THEFUND
2.1. Resources at 31 December 2000
The Guarantee Fund balance increased by EUR 61 million, or approximately 5.3%, from EUR 1 160 million at 31 December 1999 to EUR 1 221 million at 31 December 2000.
Resources Situation at Movements Situation at
31/12/99 in 2000 31/12/00 Provisions
+ 1,638,413,000.00 186,290,500.00 1,824,703,500.00 Repayment of surplus
- 363,800,000.00 107,900,000.00 471,700,000.00 Activation of guarantee
- 441,559,685.43 17,355,629.49 458,915,314.92 Recovery of amounts guaranteed
+ 326,997,234.09 135.39 326,997,369.48
Balance
1,160,050,548.66 61,035,005.90 1,221,085,544.56
EUR 5.1 million was paid out from the Fund on 12 May 2000, EUR 4.9 million on 5 September 2000 and EUR 7.4 million on 22 December 2000, giving a total of EUR 17.4 million for 2000.
The payment of EUR 135.39 represents the interest received on late payments in respect of guaranteed amounts recovered from defaulting debtors in 2000.
2.2. The Fund’s assets at 31 December 2000
The Fund’s assets at 31 December 2000 came to EUR 1 410.1 million, broken down as below. The Fund operates in one currency only – the euro.
– EUR 489 million invested in short-term monetary deposits, i.e. 34.68%;
– EUR 1.8 million on current account, i.e. 0,13%;
– EUR 919.3 million in the investment portfolio, i.e. 65.19% (see table in 2.3).
2.3. Liquidity risk
In accordance with the strategy agreed with the Commission for the management of Guarantee Fund assets in 2000, the funds available are distributed as follows:
Fixed-rate investments Variable-rate TOTALS less than 3 months 3 months to 1 year 1 to 6 years securities
Current accounts
1,864,299.31 1,864,299.31
Fixed-term deposits
310,000,000.00 179,000,000.00 489,000,000.00 Securities portfolio
36,997,404.28 66,723,419.06 422,027,415.78 393,554,038.75 919,302,277.87 TOTALS
348,861,703.59 245,723,419.06 422,027,415.78 393,554,038.75 1,410,166,577.18 %
24.74 17.42 29.93 27.91 100.00
The remaining assets have been spread over the interest-rate curve for up to six years so that there is a regular flow of revenue and sufficient liquidity. At 31 December 2000 the target structure – one third short-term and two thirds divided equally into fixed-rate securities and variable-rate securities – had generally been respected. In accordance with the investment strategy for 2000, priority was given to the purchase of fixed-interest securities.
At 31 December 2000 the average term of long-term fixed-rate investments came to 2.3 years, compared with the maximum 2.5 years authorised; the average term for variable-rate securities was 1.2 months. Except in exceptional cases, fixed-term deposits are systematically renewed for between three and six months, in accordance with the Commission’s instructions on extending the duration of all of the assets invested in the Fund.
3. GUARANTEE FUND INVESTMENTS: ANALYSIS OF RESULTS AND PERFORMANCE IN
2000
3.1. General analysis
Overall, the Guarantee Fund produced EUR 57.4 million in net revenue, an overall average yield of 4.19%2 as compared to the average three-month Euribid reference rate of 4.27% for the same period, in a period of rising short-term interest rates (see point 3.2.1).
Investment income at 31 December 2000 was as follows:
2000 (EUR millions) Interest on short-term investment
19.0 Interest on securities
43.5 Interest on current account
0.2 Spread of premium or discount
-4.5 Commissions and financial charges
-0.8 Total
57.4
3.2 Sectoral analysis
3.2.1. Treasury operations
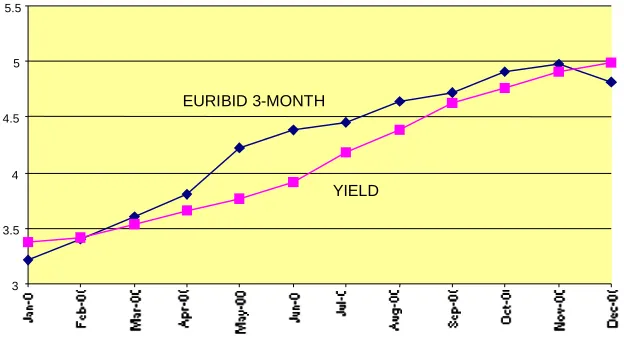
Investments in 2000 produced EUR 19 million in interest on capital averaging EUR 450.8 million. The yield on investments in 2000 averaged 4.14%3, as against 2.97 % at 31 December 1999, because of the rise in short-term rates and the extreme volatility of the financial markets. The increase in money-market rates was more pronounced with the euro than with other currencies and thus had a twofold effect: on the one hand, the yield on investments improved, while on the other, the yield spread deteriorated (the benchmark three-month Euribid rose significantly). It should
2
The basis for the calculation of overall yield is: act/360.
3
be remembered that the benchmark reflects the rise in rates (immediate effect), while the effect on the yield of the monetary portfolio is delayed due to the scheduling and extension of investments.
The spread calculated in this way is 13 basis points below the three-month Euribid variable reference rate4. This spread does not reflect the margin obtained at the beginning of operations, and this margin is not taken into consideration when calculating yield.
Period Yield Euribid three-month
reference
Spread
2000
4.14% 4.27% -0.13%
• Changes in yield and reference rates in 2000
The table below shows the rates obtained for short-term money-market investments as compared with the three-month Euribid reference rate.
3 3.5 4 4.5 5 5.5
EURIBID 3-MONTH
[image:12.595.141.453.300.471.2]YIELD
Fig. 2: Yield in relation to the benchmark rate
In a context of rising short-term interest rates, the yield of the monetary portfolio systematically lags behind the benchmark, while in absolute terms the overall yield of the portfolio followed the market and increased by 1.17% in 2000.
• Profile of counterparties
AA1
10 % AA2
14 %
AA3 48 % A1
[image:13.595.102.390.85.252.2]28 %
Fig. 3: Breakdown of short-term investment by type of counterparty at 31/12/00
• Geographical breakdown
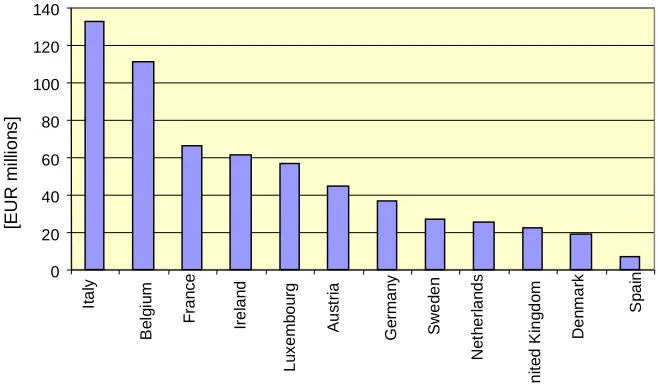
The geographical breakdown in terms of average capital of the countries with which the Fund made short-term deposits in 2000 was as follows:
0 20 40 60 80 100 120 140 It a ly Be lg iu m Fr a n c e Ir el an d Lu xem b ou rg Au s tria Ge rma n y S w ed en Ne th e rl a n d s U n it e d K ing do m De n m a rk Sp a in [E U R mi lli o n s ]
Fig. 4: Short-term investments: geographical breakdown of average capital
The EIB is pursuing its objective of a better geographical distribution throughout the countries of the European Union while at the same time maintaining the competitiveness of the yield obtained.
3.2.2. Investment portfolio
[image:13.595.136.465.364.556.2]The starting value of the securities in this portfolio is the acquisition cost. The difference between the entry price and the redemption value is divided pro rata temporis over the remaining life of each of the securities.
At 31 December 2000 the nominal value of the investment portfolio was EUR 914.1 million against a book value of EUR 919.3 million (including the premium and discounts to be written off).
The portfolio yielded a result of 39.3 million at 31 December 2000. This result breaks down as follows:
Interest received 43 573 845.83
Spread of premium / discount -4 521 285.47
39 052 560.36
The book yield on the investment portfolio came to 4.34 % at 31 December 2000 compared with 3.68% at 31 December 1999. In terms of a Salomon index reference benchmark for fixed-rate securities and the three-month Euribid for variable-rate securities, the overall spread is negative by 33 basis points compared with the aggregate benchmark of 4.67% (see Annex 2). This negative yield is the result of the rise in long-term rates in 2000. The benchmark reflects the actual changes in rates. while the portfolio’s yield lags behind the market because of phased reinvestments. The aggregate benchmark stood at 3.23% at 31 December 1999.
• Market value compared to book value in 2000 800 820 840 860 880 900 920 940 De c-9 9 Jan-00 Feb-00 Mar -00 Ap r-0 0 May -00 Jun-00 Jul-00 A ug-00 S ep-00 Oct-00 No v-0 0 De c-0 0 [E U R mi ll io n s ]
[image:15.595.136.457.109.306.2]Book value Market value
Fig. 5: Market value compared to book value in 2000
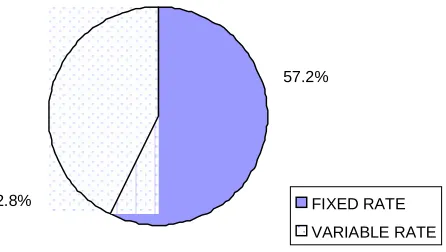
• Breakdown of the portfolio between fixed-rate and variable-rate securities
FIXED RATE
VARIABLE RATE 57.2%
42.8%
[image:15.595.168.391.386.512.2]• Redemption profile of investment portfolio
0 50 100 150 200 250 300 350
[E
U
R
mi
ll
io
n
s
]
2001 2002 2003 2004 2005 2006 2007 2008
Variable rate
[image:16.595.170.475.116.300.2]Fixed rate
Fig. 7: Investment portfolio: Redemption at 31.12.2000
The latest final maturity date for fixed-rate securities is 29 September 2006.
• Profile of issuers
All the securities held meet the following criteria:
– either they are issued by States in or by institutions guaranteed by the European Union, the G10 or supranational bodies;
– or they are issued by another sovereign State with a rating of at least AA3;
The profile of issuers was as follows at 31 December 2000:
Supranational 16%
Gov./Gov. agencies 50%
Other issuers/AAA
[image:17.595.175.433.118.251.2]34 %
POSITION OF THEGUARANTEEFUND AT31 DECEMBER2000
ASSETS 31/12/2000
Receivables with credit institutions CURRENT ACCOUNT
FIXED-TERM DEPOSITS
1 864 299.31 489 000 000.00 490 864 299.31 Investment portfolio
SECURITIES PORTFOLIO 919 302 277.87
919 302 277.87 Other receivables
ACCRUALS 22 082 387.18
22 082 387.18
TOTAL 1 432 248 964.36
LIABILITIES 31/12/2000
Guarantee Fund
GUARANTEE FUND 1 221 085 554.56
1 221 085 554.56 Other liabilities
ACCRUALS 689 783.78
689 783.78 Result
Result carried over Result for 2000
153 081 422.50 57 392 203.52 210 473 626.02
TOTAL 1 432 248 964.36
PROFIT AND LOSS AT 30/09/2000 1. INCOME
Interest on securities Interest on investments Interest on current account SUB-TOTAL
43 573 845.83 18 996 521.08 157 806.60 62 728 173.51 2. COSTS
Spread of premiums or discounts Commissions
Financial charges SUB-TOTAL
- 4 521 285.47 - 689 783.78 - 124 900.74 -5 335 969.99
Transfers Interest Late payments(**) Credits Calls EIB, others
Rev. to
the budget Debits Annual bal. Cumulative
defaults (*)
a b c d=(a+b+c) e f g h=(e+f+g) i=(d-h) j=(e-c)
Credits 1994 293.720.000 478.331 294.198.331
Debits 1994 0 0 2.699 2.699
Saldo al 31.12.94 294.195.633
Credits 1995 250.750.000 23.539.828 35.630.568 309.920.396
Debits 1995 303.072.581 195.618 303.268.198
Saldo al 31.12.95 6.652.197 267.760.010
Credits 1996 235.390.000 19.842.550 55.715.204 310.947.754
Debits 1996 52.540.497 1.849.279 54.389.775
Saldo al 31.12.96 256.557.979 271.154.609
Credits 1997 286.095.000 34.506.566 45.033.282 365.634.849
Debits 1997 54.290.854 6.962.746 61.253.600
Saldo al 31.12.97 304.381.249 291.337.822
Credits 1998 272.389.000 50.185.883 185.299.547 507.874.430
Debits 1998 15.407.951 7.592.489 66.000.000 89.000.440
Saldo al 31.12.98 418.873.990 134.300.629
Credits 1999 300.069.000 48.562.535 5.318.632 353.950.167
Debits 1999 16.247.803 7.431.441 297.800.000 321.479.244
Saldo al 31.12.99 32.470.923 145.229.800
Credits 2000 186.290.500 62.728.173,51 135 249.018.809
Debits 2000 17.355.629 5.335.970 107.900.000 130.591.599
Saldo al 31.12.00 118.427.209 162.585.294
Running total 1.824.703.500 239.843.866 326.997.3692.391.544.735 458.915.315 29.370.240 471.700.000 959.985.555 1.431.559.180
(*) Actual amount of accumulated defaults at the end of each year.
ANNEX III
Consolidated financial balance sheet of the Guarantee Fund at 31 December 2000
The consolidated financial balance sheet at 31 December 2000 is provided to supplement the position of the Guarantee Fund as set out in Annex II. The consolidated balance sheet also includes an additional EUR 215 094 849.09 which breaks down as follows:
– on the assets side, receivables from recipients of loans granted or guaranteed by the Commission totalling EUR 164 598 428.11 for non-member countries’ arrears on the payment of principal, interest due and default interest covered by the Guarantee Fund and EUR 50 496 420.98 for default interest accrued but not received at 31 December 2000. This default interest has been calculated in line with the penalty rates laid down in the loan contracts.
CONSOLIDATED FINANCIAL BALANCE SHEET OF THE GUARANTEE FUND AT 31 DECEMBER 2000
EUR
ASSETS LIABILITIES
31.12.00 31.12.99 31.12.00 31.12.99
Current account 1 864 299.31 4 749 649.43 Guarantee Fund
Fixed-term deposits 489 000 000.00 480 000 000.00 Payments from the budget (2) 1 187 643 500.00 1 166 713 000.00
Portfolio - surplus to be paid to the budget 165 360 000.00 107 900 000.00
Investment portfolio 919 302 277.87 813 073 283.47 Default interest accrued but not received 50 496 420.98 37 289 021.74
Receivables from recipients of loans granted or guaranteed by the
Community Other liabilities
1 403 499 920.98 1 311 902 021.74
Payments from the Fund (1) 164 598 428.11 147 242 798.63 Accruals 689 783.78 604 761.67
Default interest accrued but not received 50 496 420.98 37 289 021.74 Result
Other receivables Result carried over 185 761 769.79 142 617 676.92
Accruals 22 082 387.18 15 913 799.93 Result for financial year 57 392 338.90 43 144 092.87
TOTAL ASSETS 1 647 343 813.45 1 498 268 553.20 TOTAL LIABILITIES 1 647 343 813.45 1 498 268 553.20
PROFIT AND LOSS AT 31/12/2000
INCOME COSTS
31.12.00 31.12.99 31.12.00 31.12.99
Interest on securities 43 573 845.83 34 868 824.65 Spread of premium or discount 4 521 285.47 6 726 949.63
Gain on transfer of financial fixed assets 0.00 814 384.67 Commissions 689 783.78 604 761.67
Interest on investments 18 996 521.08 12 659 514.63 Financial charges 124 900.74 99 729.43
Interest on current account 157 806.60 219 810.68 TOTAL COSTS (B) 5 335 969.99 7 431 440.73
Default interest received on late recoveries 135.38 2 012 998.97
TOTAL INCOME (A) 62 728 308.89 50 575 533.60 RESULT (A - B) 57 392 338.90 43 144 092.87
(1) Capital, interest, default interest covered by payments from the Fund.